Abstract
Background
Traumatic brain injury (TBI) induces edema on the uninjured side (i.e., contralateral brain tissue; CBT). We evaluated the role of AQP4 in CBT edema formation following TBI.
Material/Methods
Mild or severe TBI was induced using a controlled cortical impact model in rats, immediately followed by intraventricular siRNA infusions. The effects of AQP4 siRNA on CBT edema were assessed at up to 168 h.
Results
Mild or severe TBI induced different patterns of CBT edema. Furthermore, following mild TBI, brain water content (BWC) was increased at 72 h thereafter and AQP4 expression was increased after 168 h, relative to non-injured rats (i.e., sham). AQP4 interference reduced AQP4 expression 48 h thereafter and BWC 72 h thereafter, relative to control siRNA. In contrast, following severe TBI, BWC was increased 1 h thereafter and AQP4 expression was transiently enhanced after 1 h, relative to sham. However, AQP4 interference reduced AQP4 expression after 1 h and BWC 24 h thereafter, relative to control siRNA. Finally, apparent diffusion coefficient (ADC) value in CBT was positively correlated with AQP4 expression level following severe, but not mild, TBI. AQP4 interference disrupted this correlation.
Conclusions
AQP4 interference reduces CBT edema formation, and ADC value may predict TBI severity.
MeSH Keywords: Aquaporin 4; Brain Edema; Brain Injuries; RNA, Small Interfering
Background
Traumatic brain injury (TBI) is an increasingly common clinical condition resulting from unforeseen and sudden causes, such as traffic accidents, falls, and gunshot wounds [1]. One of the most critical pathological changes following TBI is the development of brain edema, which is a potentially fatal pathological state that often is a direct factor leading to death of patients [2–4]. During the development of brain edema, excess extracellular fluid accumulates and results in elevation of intracranial pressure, which will impair the surrounding nerve functions [5]. In general, the pathogenesis of brain edema is classified as vasogenic edema or cytotoxic edema [6–8]. While the former is largely due to the disruptiona of the blood-brain barrier (BBB), leading to extracellular accumulation of fluid, the latter is characterized by cell swelling induced by intracellular accumulation of fluid [9]. Previous research has focused on the brain edema around the injured brain tissue area. However, little attention has been given to the edema in the contralateral brain tissue (CBT), which also often occurs after TBI [10].
While the mechanisms underlying the TBI-induced brain edema is very complex, the pathogenesis of brain edema on a cellular level must be taken into account for the development of effective therapeutic methods. For example, aquaporin 4 (AQP4) was most studied in several brain pathological conditions including stroke, traumatic brain injury, and autoimmune neurodegenerative diseases [11,12]. Studies have shown that AQP4 is the most abundant water channel protein in brain tissue [13]. Increased expression of AQP4 is associated with the formation of brain edema after TBI [14,15]. Additionally, it has been shown that prophylactic inhibition of AQP4 may prevent the subsequent formation of edema after TBI. For example, previous studies have demonstrated that intracranial infusions of AQP4 siRNA can reduce subsequent formation of brain edema in brain tissue surrounding the injured area [16]. However, it is still not clear whether prophylactic inhibition of AQP4 could prevent the brain edema in the CBT following TBI.
In addition, the emergence of different types of brain edema is likely dependent on the severity of TBI [17]. Hence, another focus of the present study was to evaluate the effects of different degree of TBI on the type of cerebral edema formation in CBT in vivo. Apparent diffusion coefficient (ADC) is likely a good indicator for different types of edema. The value of ADC is measured by using magnetic resonance diffusion imaging technique. It can reflect the Brownian motion of water molecules in vivo. Thus, ADC value can indicate the difference in the number of cells and volume in a tissue unit, and to a certain extent reflect the tissue extracellular space size and the amount of water influx. Previous studies have shown that ADC value is reduced during the intracellular edema due to the decreased extracellular space, and ADC value is increased when vasogenic edema occurs due to the influx of water molecules [6,16,17].
Taken together, the present study was designed to evaluate the role of AQP4 in brain edema formation in CBT following mild or severe TBI. To this end, mild or severe TBI was induced using a controlled cortical impact model in Sprague-Dawley rats, immediately following a direct intraventricular delivery of either control siRNA or AQP4 siRNA. The effects of AQP4 siRNA on CBT edema were then assessed after 1 h, 24 h, 48 h, 72 h, or 168 h, using MRI, immunohistochemistry, and histology. Additionally, ADC value was measured in order to evaluate the process of brain edema in the CBT after TBI.
Material and Methods
Animals
Adult male Sprague-Dawley rats (n=198) weighing at 300–350 g were purchased from the Experimental Animal Center of Sichuan University (animal license number: SCXK (Chuan) 2008–24), and were housed individually at 22°C to 25°C under a 12-h light/dark cycle and had free access to food and water. We randomly divided rats into 3 experimental groups: sham group (n=18), control siRNA group (n=90), and AQP4 siRNA group (n=90). According to time points (i.e., 1 h, 24 h, 48 h, 72 h, and 168 h) after TBI, each of the latter 2 groups were further divided into 5 subgroups (n=18/group). Within each group of rats, 2 rats were used for pathological observations, 6 rats were used for measure the protein levels of AQP4 in the CBT using semi-quantitative Western blotting, and 10 rats were used to measure the water content of the brain. All animal experiments were approved by the Institutional Animal Care and Use Committee of Central South University. The housing and treatment of the rats followed the guidelines of the “Guide for the Care and Use of Laboratory Rats” (Institute of Laboratory Animal Resources, Commission on Life Sciences 2011).
Controlled cortical impact model
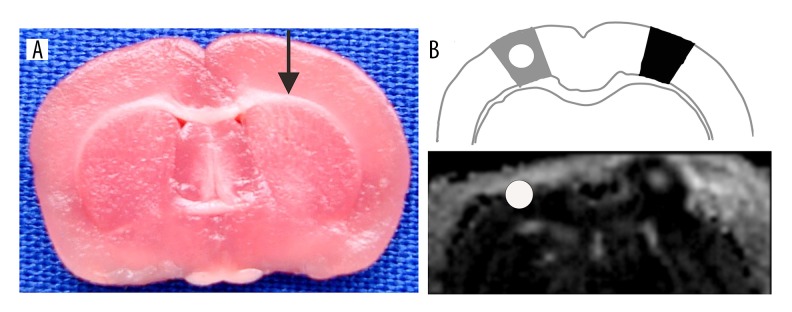
The controlled cortical impact model was modified based on Feeney’s model of cerebral contusion. Briefly, rats were anesthetized using intraperitoneal injection of 100 g/L chloral hydrate (4ml/kg), and then were place in the prone position. The body temperature of the rats was measured with a rectal thermometer and maintained at +37°C using a CMA 450 temperature controller (Harvard Apparatus, Holliston, MA). The heads of rats were fixed in a stereotactic head frame (ST-7Setagaya-Ku, Tokyo, Japan), and the head skin was disinfected and cut along the midline of the scalp for about 2 cm. The skull was drilled open 2.5 mm away from the middle line and in the middle of the bregma and lambda, using a dental drill (307-2B type, the Shanghai Ling Kawasaki Precision Tool Technology Co., Ltd., Shanghai, China) with 1.5-mm drill bit at the of speed 4000 rpm. Next, a 5-mm diameter center was cut open with mosquito forceps around the drilled hole, and the dura was kept intact. Traumatic brain injury was induced using a PinPoint™ Impactor (Hatteras Instruments, Cary, NC) aiming at the targeted open center on the skull. Based on our pilot studies, the impact time was set as 0.1 s, and the impact velocity was 2.5 m/s. In order to induce mild or severe TBI in the right hemisphere, a striking head size 4 or size 6 and impact depth of 1.5 mm or 3.5mm were selected, respectively. In addition, the sham group underwent the same procedure without receiving TBI. Subsequently, an injection needle was inserted at the center and lowered into the ventricles (5 mm from brain surface). A total volume of 10 μl of either control siRNA or AQP4 siRNA was injected into the ventricles at an infusion rate of 1 μl/min using a Hamilton syringe (Figure 1). The injection needle was left in place for 1 min after infusion. Immediately after removing the injection needle, skin tissue was sutured, and rats were then placed on a heating pad (+37°C) until awake. AQP4 siRNA was designed using BioEdit software based on AQP4 mRNA in rat sequence according to National Center for Biotechnology Information.
Figure 1.
Representative image showing the siRNA injection site (A) and schematic showing the TBI and CBT areas and representative MRI image (B). Black arrow represents the track of the injection needle through the damaged area to intraventricular (a visible black dye diffused in the ventricle and within reach of the lateral ventricle). Dark area represents the TBI area, and grey area represents the CBT area. White circle represents the area for ADC value measurement.
AQP4 siRNA target sequence: 5′-AGATCAGCATCGCCAAGTC-3′ (registration number: 012825, located at AQP4 cDNA first 326-3456 p).
Target dsRNA sense strand is 5′-AGAUCAGCAUCGCCAAGUCUU-3′, antisense strand is 5′-UUUCUAGUCGUAGCGGUUCAG-3′.
Magnetic resonance imaging
A respiratory monitoring pad (SA Instruments, Inc., Stony Brook, NY) was placed in the abdomen of the rat to monitor breathing in rats. The MRI was taken using Bruker 7T BioSpin MR spectrometer (Bruker, Germany) with a pore size of 16-cm diameter, the maximum gradient strength of 300 mT/m, and 24-channel pulse coil surface. The imaging parameters were set as follows: T2WI: TR/TE=1200.0 m/50.0 ms, matrix=256×256, NEX=4, FOV=3.6×3.6 cm, slice thickness=1.0 mm, spacing=0.00 mm. Echo planar imaging was used for DWI sequence: TR/TE=9000 ms/102 ms, b value=800 s/mm2, FOV=3 cm, NEX=2. After the MRI scan was completed, images were transferred to the workstation, and the ADC value within CBT was measured using ParaVision software by 2 experienced physicians using a double-blind method. Three ROI were selected from the CBT region, and the data is shown as mean ±SD (standard deviation).
Hematoxylin and eosin staining
Rats were anesthetized using 100 g/L chloral hydrate (4 ml/kg, i.p.), followed by left ventricular perfusion of 40 g/L paraformaldehyde until colorless liquid flowed out of the right atria. The brains were quickly removed and placed in 40 g/L paraformaldehyde for fixation over 24 h. Coronal sections of the sham control, Control siRNA, or AQP4 siRNA-treated brain tissues were embedded in paraffin, sectioned, and stained with hematoxylin and eosin (H&E). H&E staining sections were observed under a light microscope and photographed.
Immunohistochemistry and DAB staining
Immunohistochemical staining of IgG was conducted using EnVision™ System (GLK500705, DAKO, Denmark). Paraffin sections were deparaffinized and dehydrated, washed 3 times with PBS, and were incubated in 16.7 mol/L hydrogen peroxide at room temperature for 10 min. Sections were then washed 3 times with PBS and were incubated with primary antibody (IgG, 1:800, Santa Cruz, CA) overnight at 4°C. Sham control, Control siRNA, or AQP4 siRNA-treated brain sections were washed with PBS 3 times, and were incubated with secondary antibody (Zhongshan Golden Bridge Biotechnology, Beijing, China) at room temperature for 20 min. Sections were finally washed 3 times with PBS, and mounted with DAB fluorescent mounting media and coverslip.
Western blot
Brain tissue of the uninjured area was isolated and ground in liquid nitrogen with rapid tissue lysate (RIPA) to extract total protein lysate samples. Tissue samples were boiled in a dry heat block at 100°C for 10 min. The protein concentration of the samples was determined using the BioRad DC Protein™ Assay kit. Proteins were separated on 10% Tris-HCl polyacrylamide gel at 120 V for 1 h, and transferred to a polyvinylidene difluoride membrane (Millipore Co., Billerica, MA) for 1 h at 100 V. Membranes were then blocked in 5% milk for 1 h, and incubated with antibody (rabbit anti-rat AQP4, 1:200, Chemicon, USA) overnight (16–20 h) at 4°C. Membranes were then incubated in secondary antibody (goat anti-rabbit, 1:200, Zhongshan Golden Bridge Biotechnology, Beijing, China) conjugated to horseradish peroxidase (HRP) for 1 h, followed by development with an enhanced chemiluminescence (ECL) system (Pierce Biotech, Rockford, IL). Protein levels were quantified by densitometry using the BioRad imaging system (Zhongshan Golden Bridge Biotechnology, Beijing, China). AQP4 levels were normalized to the levels of the loading control, β-actin, and then to the AQP4 levels in sham group.
Brain water content
Rats were anesthetized using 100 g/L chloral hydrate (4 ml/kg, i.p.), and were decapitated. The brains were removed, and the hemisphere of the non-injured side was quickly isolated and weighed immediately, using an electronic balance (BSAl24S-CW, Sartorius Scientific instrument, Beijing, China). Brain tissue was then dried in an electric oven dried at 105°C for 48 h to constant weight (difference between 2 dry weight measurements <0.0002 g), and brain water content was calculated as [(wet weight − dry weight)/wet weight]×100%.
Statistical analysis
Data are expressed as mean ± standard deviation (Mean ±SD) or mean ± standard error (Mean ±SEM). All data analysis was performed using SPSS 13.0 statistical software or unpaired t test. One-way ANOVA was used for multiple-group comparison with post hoc Tukey test. Pearson correlation test was used to examine the correlation between ADC value and AQP4 expression level. p<0.05 was considered statistically significant.
Results
Different patterns of edema in CBT following mild or severe TBI
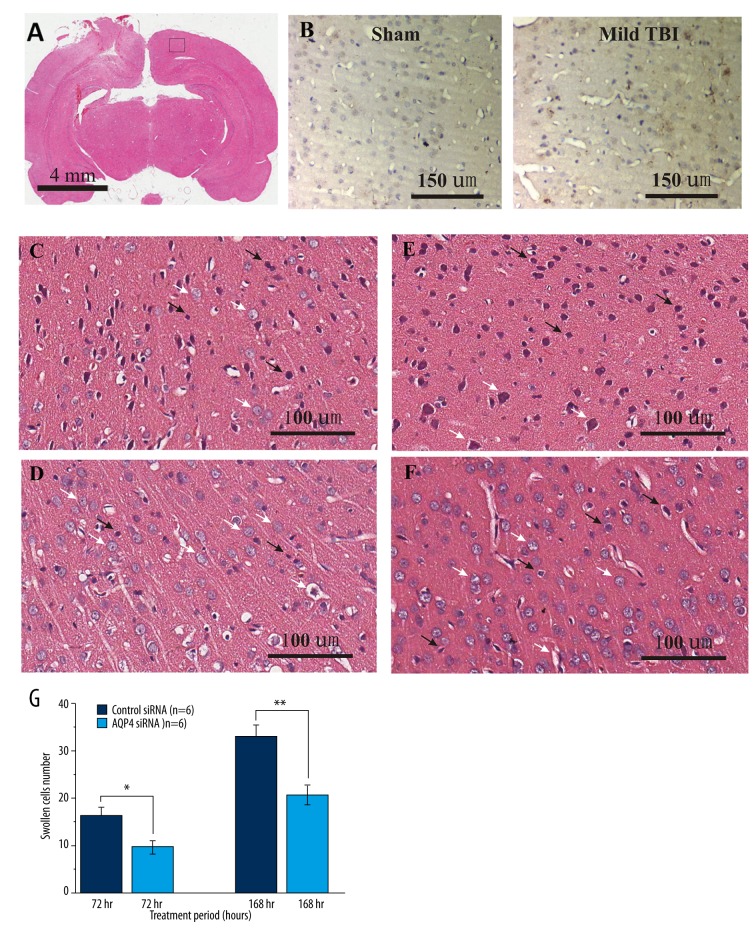
In the sham group, neural cells exhibited normal morphology and the microvascular endothelium was intact. Following mild TBI (Figure 2A), cells in the CBT exhibited normal morphology and normal intracellular space after 1 h, 24 h, or 48 h in rats receiving intracranial infusions of control siRNA, as compared with sham rats. Immunohistochemical staining of IgG further demonstrated the structural integrity of blood-brain barrier compared with the sham control (Figure 2B). However, swollen glial cells with abundant lightly staining cytoplasm started to be visible in CBT after 72 h, suggesting the emergence of cytotoxic edema (Figure 2C). Furthermore, cytotoxic edema became more noticeable with widened tissue spaces and lightly staining cytoplasm, and mixed edema appeared after 168 h (Figure 2D). However, intracranial infusions of AQP4 siRNA abated intracellular edema after 72 h (Figure 2E, 2G) and reduced mixed edema after 168 h, with improved glial cell morphology (Figure 2F, 2G).
Figure 2.
Pathological changes in rat brain tissue on the uninjured side (i.e., CBT) after mild TBI. Representative images of (A) whole-brain coronal section, (B) IgG immunohistochemical stainings for sham control (middle panel) and after 1-h mild TBI (right panel), (C) control siRNA treatment after 72 h, (D) AQP4 siRNA after 72 h, (E) control siRNA treatment after 168 h, and (F) AQP4 siRNA after 168 h. Figure 2G is a bar graph summary of the swollen individual cells from each group. * Indicates, P<0.05, ** indicates, P<0.01 by unpaired t tests. Scale bars represent (A) 4 mm, (B) 150 μm or (C–F) 100 μm.
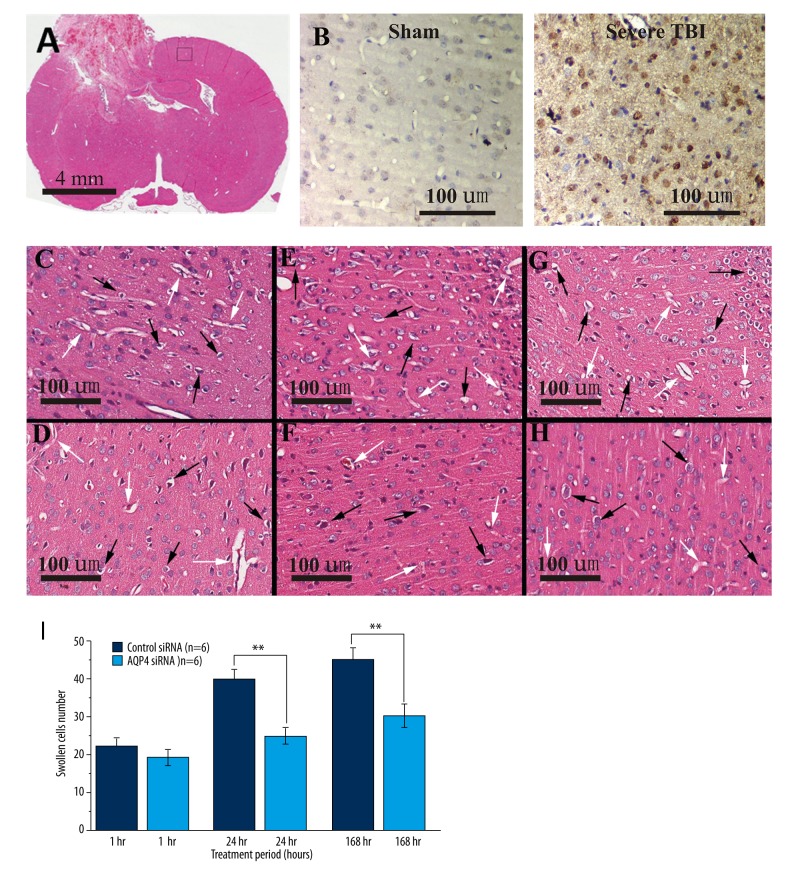
In contrast, following severe TBI (Figure 3A), vasogenic edema exhibited as early as 1 h after intracranial infusions of control siRNA, as compared with the sham group. Immunohistochemical staining of IgG further showed the blood-brain barrier damage (Figure 3B), indicating severe trauma group CBT area with a certain degree of contrecoup injury. Additionally, swollen glial cells with abundant lightly staining cytoplasm started to be visible in CBT after 1 h, suggesting the emergence of cytotoxic edema (Figure 3C). Similar intracellular edema in CBT appeared 24 h thereafter (Figure 3E). Additionally, mixed edema appeared in CBT 72 h thereafter (Figure 3G). Interestingly, intracranial infusions of AQP4 siRNA failed to abate vasogenic edema after 1 h (Figure 3D, 3I), but alleviated the intracellular edema 24 h thereafter (Figure 3F, 3I) and reduced mixed edema after 168 h, with improved glial cell morphology (Figure 3H, 3I).
Figure 3.
Pathological changes in rat brain tissue on the uninjured side (i.e., CBT) after severe TBI. Representative images of (A) whole-brain coronal section, (B) IgG immunohistochemically staining for sham control (middle panel) and after 1-h severe TBI (right panel), (C) control siRNA treatment after 1 h, (D) AQP4 siRNA after 1 h, (E) control siRNA treatment after 24 h, (F) AQP4 siRNA after 24 h, (G) control siRNA treatment after 168 h, and (H) AQP4 siRNA after 168 h. Figure 3I is a bar graph summary of the swollen individual cells from each group. ** Indicates, P<0.01 by unpaired t test. Scale bars represent (A) 4 mm or (B–H) 100 μm.
Effects of intracranial infusions of AQP4 siRNA on AQP4 expression in CBT after TBI
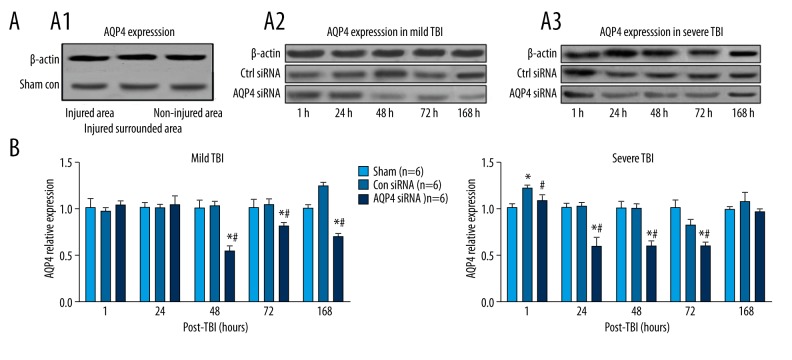
Following mild TBI, the expression of AQP4 was not altered after intracranial infusions of control siRNA, as compared with the sham group (Figure 4A). Furthermore, the expression level of AQP4 was increased robustly after 168 h (Tukey test, p<0.05; Figure 4A). However, intracranial infusions of AQP4 siRNA attenuated the expression of AQP4 48 h thereafter, as compared with control siRNA group (Tukey test; p<0.05; Figure 4A, 4B).
Figure 4.
Relative repression levels of AQP4 in sham control and CBT after mild or severe TBI. (A) Representative Western blot samples shown in sham control (A1), mild TBI (A2), and severe TBI (A3). (B) Bar graphs summary shown AQP4 relative expression levels in each group. * (p<0.05) represent the ANOVA simple main effects, as compared to sham group. # (p<0.05) represents the ANOVA simple main effect, as compared to the control siRNA group.
In contrast, following severe TBI, the expression of AQP4 in CBT was rapidly increased as early as after 1 h (Tukey test, p<0.05; Figure 4A, 4B), but continued to decline to a similar expression level as in the sham group 24 h thereafter (Figure 4B). However, intracranial infusions of AQP4 siRNA attenuated the expression of AQP4 in CBT 1 h thereafter (Tukey test, p<0.05; Figure 4B), and returned to a similar level after 168 h, as compared with the control siRNA group (Tukey test, p<0.05; Figure 4B).
Effects of intracranial infusions of AQP4 siRNA on water content in CBT after TBI
Following mild TBI, water content in CBT was increased 72 h thereafter, after intracranial infusions of control siRNA, as compared with the sham group (Tukey test; p<0.05; Figure 5A). However, intracranial infusions of AQP4 siRNA attenuated water content in CBT 72 h thereafter, as compared with control siRNA group (Tukey test; p<0.05; Figure 5A).
Figure 5.
Water content in CBT after (A) mild or (B) severe TBI. * (p<0.05) represent the ANOVA simple main effects, as compared to sham group. # (p<0.05) represents the ANOVA simple main effect, as compared to control siRNA group.
In contrast, following severe TBI, water content in CBT was increased 1 h thereafter, after intracranial infusions of control siRNA, as compared with the sham group (Tukey test; p<0.05; Figure 5B). However, intracranial infusions of AQP4 siRNA attenuated water content in CBT 24 h thereafter, as compared with the control siRNA group (Tukey test; p<0.05; Figure 5B).
Apparent diffusion coefficient values in CBT following mild or severe TBI
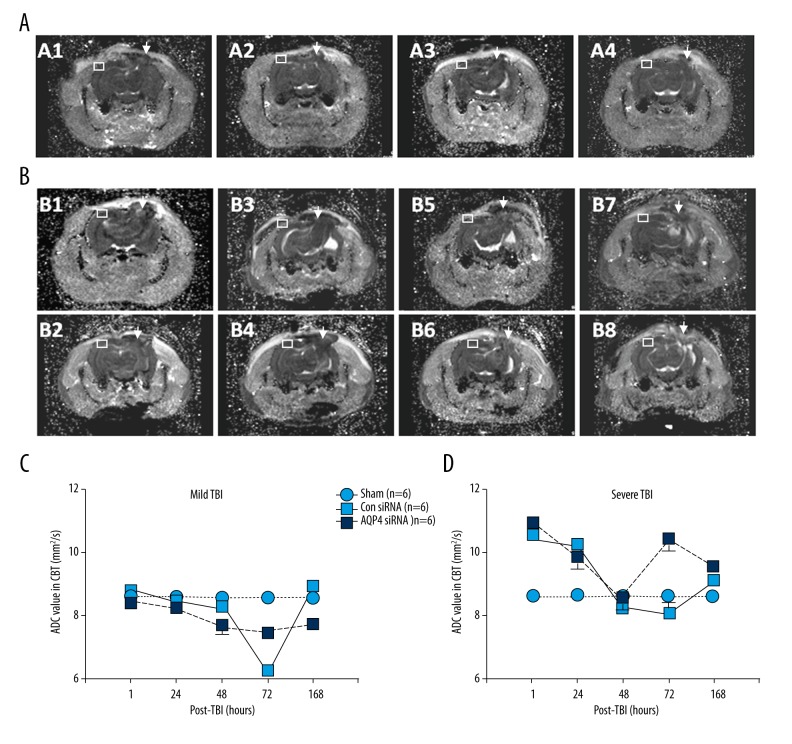
Following mild TBI, ADC value in the CBT region was not altered after 1 h, 24 h, 48 h, or 168 h after intracranial infusions of control siRNA, as compared with the sham group (Tukey test; p<0.05; Figure 6C). Interestingly, ADC value was transiently reduced after 72 h (Tukey test; p<0.05; Figure 6C). However, intracranial infusions of AQP4 siRNA attenuated ADC value 48 h thereafter as compared with the sham group (Tukey test; p<0.05; Figure 6C), but exhibited higher ADC value in CBT as compared with control siRNA group after 72 h (Tukey test; p<0.05; Figure 6C).
Figure 6.
ADC values in CBT after (A, C) mild or (B, D) severe TBI. Representative MRI images are shown in (A1) control siRNA treatment after 72 h, (A2) AQP4 siRNA after 72 h, (A3) control siRNA treatment after 168 h, and (A4) AQP4 siRNA after 168 h, after mild TBI. Representative MRI images are shown in (B1) control siRNA treatment after 1 h, (B2) AQP4 siRNA after 1 h, (B3) control siRNA treatment after 24 h, (B4) AQP4 siRNA after 24 h, (B5) control siRNA treatment after 72 h, (B6) AQP4 siRNA after 72 h, (B7) control siRNA treatment after 168 h, and (B8) AQP4 siRNA after 168 h, after severe TBI. White Arrows shown the traumatic areas and white boxes show the areas for ADC values measured.
In contrast, following mild TBI, ADC value was robustly increase in CBT area after 1 h, after intracranial infusions of control siRNA, as compared with sham group (Tukey test; p<0.05; Figure 6D). Furthermore, ADC value was then gradually decreased in CBT 24 h thereafter as compared with sham group (Tukey test; p<0.05; Figure 6D). However, intracranial infusions of AQP4 siRNA failed to attenuate ADC value in CBT 1 h thereafter as compared with control siRNA group (Tukey test; p<0.05; Figure 6D). Instead, intracranial infusions of AQP4 siRNA increased ADC value in CBT after 72 h as compared with control siRNA group (Tukey test; p<0.05; Figure 6D).
The correlations of apparent diffusion coefficient values with AQP4 expression level in CBT following mild or severe TBI
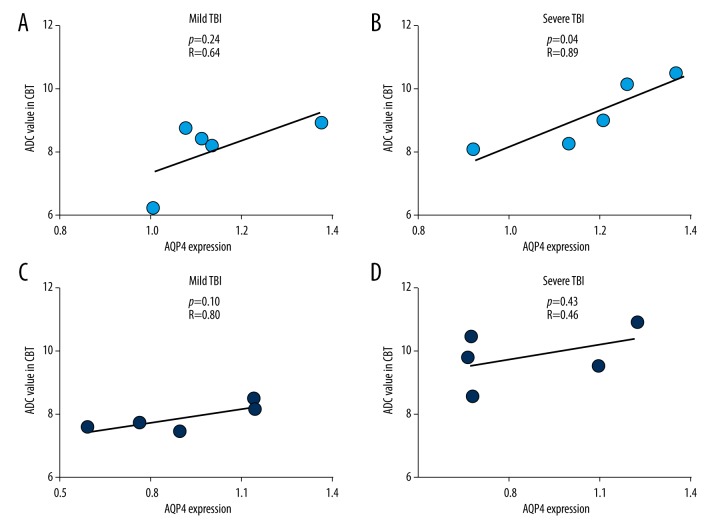
Following mild TBI, ADC value in the CBT region was not correlated with AQP4 expression level in CBT in rats receiving intracranial infusions of control siRNA (Pearson correlation test, p=0.24, R=0.64; Figure 7A) or in rats receiving intracranial infusions of AQP4 siRNA (Pearson correlation test, p=0.10, R=0.80; Figure 7C).
Figure 7.
Correlations of ADC values in CBT and AQP4 protein expression levels in CBT with (A) control siRNA or (C) AQP4 siRNA treatments following mild TBI, or (B) control siRNA or (D) AQP4 siRNA treatments following severe TBI.
Following severe TBI, ADC value in the CBT region was positively correlated with AQP4 expression level in CBT in rats receiving intracranial infusions of control siRNA (Pearson correlation test, p=0.04, R=0.89; Figure 7B), but not in rats receiving intracranial infusions of AQP4 siRNA (Pearson correlation test, p=0.43, R=0.46; Figure 7D).
Discussion
The present study found that varying degrees of TBI could cause different patterns of pathological edema and prognosis to uninjured CBT region. Specifically, mild TBI did not cause abnormality of blood-brain barrier structures, alter cell morphology, or enlarge gaps between adjacent cells in CBT during the early post-TBI period. In the later phase, mild cytotoxic edema in CBT emerged, and was exacerbated after 168 h with mixed edema. This could be caused by the reduction of CBT perfusion due to compression of the contralateral edematous hemisphere. It has been shown that apparent mixed edema peaks in damaged regions after 72 h following TBI [18,19]. In contrast to mild TBI, severe TBI caused significant vasogenic edema in CBT in the early phase (i.e., 1 h). Pathological analysis revealed that blood-brain barrier damage was likely the main cause. The breakdown of the blood-brain barrier likely induced extravasation of tissue fluid within blood vessels and increased extracellular osmotic pressure, which led to subsequent intracellular edema 24 h thereafter and mixed edema 72 h thereafter. Such pathological changes in CBT following severe TBI were consistent with our previous report [20].
While numerous studies have demonstrated the critical role of AQP4 in brain edema formation after TBI, the dynamic expression levels of AQP4 following TBI are likely altered by the pattern of edema. Specifically, following mild TBI, the corresponding AQP4 expression level in CBT was not changed during the early post-TBI period either, but was robustly increased in the late phase (i.e., 168 h) when mixed edema occurred. In contrast to mild TBI, following severe TBI, AQP4 expression in CBT was greatly enhanced in the early phase of the post-TBI period. These results are different from the findings in previous studies that AQP4 mRNA expression is attenuated in the early phase of post-TBI period (i.e., 1 day) in the edematous contusional cortex with impaired blood-brain barrier integrity [21]. Surprisingly, AQP4 expression in CBT was gradually decreased later on, indicating that damage to the blood-brain barrier may trigger the self-protection mechanisms to suppress AQP4 expression [21]. Thus, the onset of such self-protection mechanisms may be delayed in CBT, but not in the edematous contusional brain regions.
Consistent with previous studies, the present study demonstrated that preventive AQP4 siRNA interference alleviated the brain edema in CBT following TBI. Such effects of AQP4 siRNA interference are likely due to the reduction of subsequent cytotoxic edema, but not the early emerged vasogenic edema, in the CBT area. Specifically, AQP4 siRNA interference was able to decrease AQP4 protein expression in the CBT area after 48 h when pathological edema was not apparent. Such an interference therapy continuously suppressed AQP4 protein expression and significantly abated edema and reduced water content in CBT after 72 h and 168 h, when intracellular edema exacerbated in control siRNA-treated rats. However, AQP4 siRNA did not reduce early vasogenic edema caused by blood-brain barrier damage after severe TBI. Thus, AQP4 siRNA-induced reduction in brain water content of CBT during the early phase of post-TBI period may be due to the attenuation of cytotoxic edema. Hence, AQP4 siRNA interference may be a good prophylactic therapy for mild TBI, and an adjunct therapy for severe TBI.
Clinically monitoring the status of brain edema is always a challenge. While the present study has shown that ADC value may not be a good index for evaluating the therapeutic outcomes of AQP4 siRNA interference, it may help distinguish the pattern of brain edema during the early phase of the post-TBI period. Specifically, following mild TBI, edema occurred in CBT 72 h thereafter, and ADC value was not altered at the early phase, but was transiently decreased at 72 h and recovered at 168 h. Furthermore, AQP4 siRNA interference continuously suppressed ADC value in CBT 48 h thereafter. Hence, the changes of ADC value are not able to reflect the status of brain edema after mild TBI. A robust increase in ADC value was observed in CBT, but was gradually decreased during the late phase of post-TBI period. Notably, AQP4 siRNA interference robustly increased ADC value at 72 h. In fact, the fluctuating ADC value may be results of the complexity of brain edema patterns induced by various degrees of TBI. Previous studies have shown that ADC value is reduced during the intracellular edema due to the decreased extracellular space, and ADC value is increased when vasogenic edema occurs due to the influx of water molecules [6,16,17]. Thus, it is difficult to evaluate status of edema in CBT using ADC value during the late phase of post-TBI period. Additionally, previous studies have demonstrated that AQP4 expression level correlates with ADC value in periventricular brain region and hydrocephalus severity in the rat brain [16]. Adding to the literature, the present study has shown that AQP4 expression level in CBT is positively correlated with ADC value in CBT only after severe TBI, but not after mild TBI. Furthermore, AQP4 siRNA interference disrupted such a correlation. In general, our results indicated that vasogenic edema, which occurs during the early phase of post-TBI period, may enhance the ADC value, and thus can reflect the severity of TBI.
Conclusions
Despite the seriousness of brain edema, only symptomatic treatments to remove edema fluid are currently available. The present study showed that intraventricular infusions of AQP4 siRNA alleviated the progress of brain edema by reducing AQP4 expression in the CBT area, but did not alleviate the early vasogenic edema after severe brain injury. Furthermore, the development of a fast and sensitive diagnostic tool will be highly beneficial for identification of edema type and determination of subsequent therapy. The present study has also demonstrated that different levels of TBI caused different patterns of pathological edema in CBT. While mild TBI caused advanced secondary cytotoxic edema, severe TBI led to early vasogenic edema, followed by secondary intracellular edema and mixed edema. Functional magnetic resonance ADC values may be used in the early phase to discern any pathological changes in CBT, but it is difficult to evaluate status of edema in CBT using ADC value during the late phase of the post-TBI period.
Footnotes
Source of support: This work was supported by key scientific research projects funding (2014-079) of Haikou City, Hainan Province, P.R. China and the National Natural Science Foundation of China (NSFC: 81160181)
Conflict of interest
The authors have no conflict of interest to disclose.
References
- 1.Risdall JE, Menon DK. Traumatic brain injury. Philos Trans R Soc Lond B Biol Sci. 2011;366(1562):241–50. doi: 10.1098/rstb.2010.0230. [DOI] [PMC free article] [PubMed] [Google Scholar]
- 2.Thal SC, Neuhaus W. The blood-brain barrier as a target in traumatic brain injury treatment. Arch Med Res. 2014;45(8):698–710. doi: 10.1016/j.arcmed.2014.11.006. [DOI] [PubMed] [Google Scholar]
- 3.Alves JL. Blood-brain barrier and traumatic brain injury. J Neurosci Res. 2014;92(2):141–47. doi: 10.1002/jnr.23300. [DOI] [PubMed] [Google Scholar]
- 4.Marmarou A. Pathophysiology of traumatic brain edema: current concepts. Acta Neurochir Suppl. 2003;86:7–10. doi: 10.1007/978-3-7091-0651-8_2. [DOI] [PubMed] [Google Scholar]
- 5.Michinaga S, Koyama Y. Pathogenesis of brain edema and investigation into anti-edema drugs. Int J Mol Sci. 2015;16(5):9949–75. doi: 10.3390/ijms16059949. [DOI] [PMC free article] [PubMed] [Google Scholar]
- 6.Wei XE, Zhang YZ, Li YH, et al. Dynamics of rabbit brain edema in focal lesion and perilesion area after traumatic brain injury: A MRI study. J Neurotrauma. 2012;29(14):2413–20. doi: 10.1089/neu.2010.1510. [DOI] [PMC free article] [PubMed] [Google Scholar]
- 7.Lescot T, Fulla-Oller L, Po C, et al. Temporal and regional changes after focal traumatic brain injury. J Neurotrauma. 2010;27(1):85–94. doi: 10.1089/neu.2009.0982. [DOI] [PubMed] [Google Scholar]
- 8.Donkin JJ, Vink R. Mechanisms of cerebral edema in traumatic brain injury: Therapeutic developments. Curr Opin Neurol. 2010;23(3):293–99. doi: 10.1097/WCO.0b013e328337f451. [DOI] [PubMed] [Google Scholar]
- 9.Nag S, Manias JL, Stewart DJ. Pathology and new players in the pathogenesis of brain edema. Acta Neuropathol. 2009;118(2):197–217. doi: 10.1007/s00401-009-0541-0. [DOI] [PubMed] [Google Scholar]
- 10.Lu H, Lei X. The apparent diffusion coefficient does not reflect cytotoxic edema on the uninjured side after traumatic brain injury. Neural Regen Res. 2014;9(9):973–77. doi: 10.4103/1673-5374.133150. [DOI] [PMC free article] [PubMed] [Google Scholar]
- 11.Fukuda AM, Badaut J. Aquaporin 4: A player in cerebral edema and neuroinflammation. J Neuroinflammation. 2012;9:279. doi: 10.1186/1742-2094-9-279. [DOI] [PMC free article] [PubMed] [Google Scholar]
- 12.Iacovetta C, Rudloff E, Kirby R. The role of aquaporin 4 in the brain. Vet Clin Pathol. 2012;41(1):32–44. doi: 10.1111/j.1939-165X.2011.00390.x. [DOI] [PubMed] [Google Scholar]
- 13.Yasui M. [Role of aquaporin, water channel in the brain]. Nihon Yakurigaku Zasshi. 2012;139(5):230. [in Japanese] [PubMed] [Google Scholar]
- 14.Lopez-Rodriguez AB, Acaz-Fonseca E, Viveros MP, Garcia-Segura LM. Changes in cannabinoid receptors, aquaporin 4 and vimentin expression after traumatic brain injury in adolescent male mice. Association with edema and neurological deficit. PLoS One. 2015;10(6):e0128782. doi: 10.1371/journal.pone.0128782. [DOI] [PMC free article] [PubMed] [Google Scholar]
- 15.Ding JY, Kreipke CW, Speirs SL, et al. Hypoxia-inducible factor-1alpha signaling in aquaporin upregulation after traumatic brain injury. Neurosci Lett. 2009;453(1):68–72. doi: 10.1016/j.neulet.2009.01.077. [DOI] [PMC free article] [PubMed] [Google Scholar]
- 16.Badaut J, Ashwal S, Adami A, et al. Brain water mobility decreases after astrocytic aquaporin-4 inhibition using RNA interference. J Cereb Blood Flow Metab. 2011;31(3):819–31. doi: 10.1038/jcbfm.2010.163. [DOI] [PMC free article] [PubMed] [Google Scholar]
- 17.Tourdias T, Dragonu I, Fushimi Y, et al. Aquaporin 4 correlates with apparent diffusion coefficient and hydrocephalus severity in the rat brain: A combined MRI-histological study. Neuroimage. 2009;47(2):659–66. doi: 10.1016/j.neuroimage.2009.04.070. [DOI] [PubMed] [Google Scholar]
- 18.Chesnut RM, Marshall SB, Piek J, et al. Early and late systemic hypotension as a frequent and fundamental source of cerebral ischemia following severe brain injury in the Traumatic Coma Data Bank. Acta Neurochir Suppl (Wien) 1993;59:121–25. doi: 10.1007/978-3-7091-9302-0_21. [DOI] [PubMed] [Google Scholar]
- 19.Hlatky R, Valadka AB, Robertson CS. Intracranial hypertension and cerebral ischemia after severe traumatic brain injury. Neurosurg Focus. 2003;14(4):e. doi: 10.3171/foc.2003.14.4.2. [DOI] [PubMed] [Google Scholar]
- 20.Lu H, Lei XY, Hu H, He ZP. Relationship between AQP4 expression and structural damage to the blood-brain barrier at early stages of traumatic brain injury in rats. Chin Med J (Engl) 2013;126(22):4316–21. [PubMed] [Google Scholar]
- 21.Ke C, Poon WS, Ng HK, et al. Heterogeneous responses of aquaporin-4 in oedema formation in a replicated severe traumatic brain injury model in rats. Neurosci Lett. 2001;301(1):21–24. doi: 10.1016/s0304-3940(01)01589-0. [DOI] [PubMed] [Google Scholar]


