Abstract
BACKGROUND AND PURPOSE:
Rasmussen syndrome, also known as Rasmussen encephalitis, is typically associated with volume loss of the affected hemisphere of the brain. Our aim was to apply automated quantitative volumetric MR imaging analyses to patients diagnosed with Rasmussen encephalitis, to determine the predictive value of lobar volumetric measures and to assess regional atrophy differences as well as monitor disease progression by using these measures.
MATERIALS AND METHODS:
Nineteen patients (42 scans) with diagnosed Rasmussen encephalitis were studied. We used 2 control groups: one with 42 age- and sex-matched healthy subjects and the other with 42 epileptic patients without Rasmussen encephalitis with the same disease duration as patients with Rasmussen encephalitis. Volumetric analysis was performed on T1-weighted images by using BrainSuite. Ratios of volumes from the affected hemisphere divided by those from the unaffected hemisphere were used as input to a logistic regression classifier, which was trained to discriminate patients from controls. Using the classifier, we compared the predictive accuracy of all the volumetric measures. These ratios were used to further assess regional atrophy differences and correlate with epilepsy duration.
RESULTS:
Interhemispheric and frontal lobe ratios had the best prediction accuracy for separating patients with Rasmussen encephalitis from healthy controls and patient controls without Rasmussen encephalitis. The insula showed significantly more atrophy compared with all the other cortical regions. Patients with longitudinal scans showed progressive volume loss in the affected hemisphere. Atrophy of the frontal lobe and insula correlated significantly with epilepsy duration.
CONCLUSIONS:
Automated quantitative volumetric analysis provides accurate separation of patients with Rasmussen encephalitis from healthy controls and epileptic patients without Rasmussen encephalitis, and thus may assist the diagnosis of Rasmussen encephalitis. Volumetric analysis could also be included as part of follow-up for patients with Rasmussen encephalitis to assess disease progression.
Rasmussen syndrome, also known as Rasmussen encephalitis (RE), is a chronic inflammatory disease of the brain, which typically affects only 1 hemisphere. It is usually associated with a progressive course of focal seizures, characterized by epilepsia partialis continua and neurologic deficits (most frequently hemiparesis). It is generally believed that RE is driven by a T-cell-mediated inflammation that leads to neuronal and astrocytic cell death in 1 hemisphere.1,2 The disease is characterized by 3 stages: 1) the predromal stage of mild hemiparesis and infrequent seizures; 2) an acute stage with frequent seizures from 1 hemisphere characterized by epilepsia partialis continua, with deterioration of neurologic functions (histopathology in this stage shows the highest inflammatory intensity); and 3) a residual stage with severe, fixed neurologic deficits and drug-resistant seizures (histopathology in this stage shows a decrease in inflammation).1
MR imaging characteristics of RE include early cortical swelling followed by cortical and subcortical hyperintensity on fluid-attenuated inversion recovery and T2-weighted images, with progressive atrophy of the affected hemisphere.1 The peri-Sylvian region has been observed to be the predominant site for signal abnormality and atrophy.3 Volume loss of the ipsilateral caudate head is also frequently observed.3
During the past decade, MR imaging has become an increasingly important tool in the diagnosis of RE as well as in assessing disease progression and therapeutic effectiveness. The degree of hemispheric atrophy in RE can be obtained from MR imaging on the basis of manual planimetry1 and manual volumetry,4 both of which can be labor-intensive, time-consuming, and rater-dependent. Fully automated volumetric methods have been proposed that showed a high concordance with planimetric methods and clinical parameters.5
To date, no studies have examined how volumetric measures can help predict RE—that is, when a new patient presents with suspected RE, can the extent of atrophy on MR imaging be quantified to predict the probability that the patient truly has RE? In the early stage of the disease, atrophy can be too subtle for visual inspection to detect; therefore, diagnosis is often uncertain and delayed. Can fully automated volumetric methods be used to complement visual analysis? Furthermore, progression of RE can be slow, especially at the residual stage. Can fully automated volumetric methods be used to reveal slow changes across the years? In an attempt to answer these questions, in this study, we examined 15 volumetric measures in a cohort of patients with RE and 2 control groups: One group consisted of 42 age- and sex-matched healthy controls; the other group consisted of 42 patients with non-RE epilepsy and matched disease duration. Once the volumetric measures were obtained, we used them to form a statistical model to classify patients and controls, and determined the measure with the highest predictive accuracy. The same volumetric measures were then used to examine regional atrophy differences and were correlated with disease progression.
Materials and Methods
Patients
This retrospective study was approved by the Cleveland Clinic institutional review board. Patients evaluated at the Cleveland Clinic Epilepsy Center were included by using the following criteria: 1) clinical diagnosis of RE following general guidelines specified in the literature,3 and 2) MR imaging available with T1-weighed MPRAGE sequence.
Controls
Forty-two healthy controls (34 provided by the Pediatric Imaging, Neurocognition and Genetics Study [http://ping.chd.ucsd.edu] and 8 from the Cleveland Clinic) were chosen to be age- and sex-matched to the scans of 42 patients with RE. The control subjects were free of any neurologic diseases.
An additional group of 42 controls with non-RE epilepsy (all from the Cleveland Clinic) were chosen with matching epilepsy duration with the 42 scans from patients with RE. All the controls with non-RE epilepsy had negative (nonlesional) findings on MR imaging and had clearly lateralizing epilepsy as documented by their video-electroencephalography monitoring.
MR Imaging Protocol
Of the 42 scans from patients with RE, 18 MRIs were performed with a 1.5T Avanto scanner (Siemens, Erlangen, Germany), 22 were performed with a 3T Skyra scanner (Siemens), and 2 were performed with a 3T Trio scanner (Siemens) at the Cleveland Clinic. The 3D volumetric T1-weighted MPRAGE sequence was used for the volumetric processing. Sequence parameters at 1.5T were the following: TR = 11 ms, TE = 4.6 ms, no inversion, flip angle = 20°, bandwidth = 130 kHz, section thickness = 1.25 mm, no gap, in-plane resolution = 0.9 mm. Sequence parameters at 3T (Trio/Skyra) were the following: TR = 1860/1800 ms, TE = 3.4/2.56 ms, TI = 1100/900 ms, flip angle = 10°, bandwidth = 130/220 kHz, section thickness = 0.94/1 mm, no gap, in-plane resolution = 0.94/0.41 mm.
Of the 42 healthy control scans, 24 were obtained with a 3T Signa scanner (GE Healthcare, Milwaukee, Wisconsin) by using the echo-spoiled gradient-echo sequence. Sequence parameters were the following: TR = 8.132 ms, TE = 3.452 ms, TI = 640 ms, flip angle = 8°, bandwidth = 244 kHz, section thickness = 1.2 mm, no gap, in-plane resolution of 0.94 mm. Eighteen patients were scanned with a 3T Trio scanner with the MPRAGE sequence (with the same parameters as reported in the previous section). Of the 42 non-RE epilepsy control scans, 15 MRIs were performed by using a 1.5T Avanto scanner, 25 MRIs were performed by using a 3T Skyra scanner, and 2 MRIs were performed by using a 3T Trio scanner, with the same parameters as reported in the previous section.
Volumetric Analysis
All MR imaging processing was performed by using standard procedures of the freely available BrainSuite software (Version 15b; http://brainsuite.org/). BrainSuite provides an automatic sequence to extract surface models of the cerebral cortex. The procedure uses anatomic information from both the surface models and volume of the brain images for accurate coregistration between the subject and an atlas.6–8 The final parcellation computes volumes of 140 brain regions (70 from each hemisphere). WM, GM, and CSF volumes are generated separately by surface and volume registration (SVReg) for each of the brain regions. Details can be found in the On-line Appendix.
The following volumes on each side of the brain are calculated in milliliters by using built-in statistical tools of BrainSuite:
Hemispheric Volume = GM + WM without brain stem and cerebellum
Lobar volume = GM + WM of a particular lobe
Mesial and subcortical structure volume = volume of amygdala + hippocampus, putamen, caudate nucleus, thalamus, globus pallidus, brain stem, and cerebellum.
Ratios of the volumes were calculated in the following manner:
Interhemispheric ratio (HRvol) = volume of the affected hemisphere (AH)/volume of the unaffected hemisphere (UH)
Lobar/GM/WM/mesial/subcortical structure ratios: volume of Lobar/GM/WM/mesial/subcortical structure from the AH/volume of Lobar/GM/WM/mesial/subcortical structure from the UH
In total, we generated 15 volumetric ratio measures: HRvol, insular, frontal, temporal, parietal, occipital, GM, WM, amygdala and hippocampus (combined), putamen, caudate nucleus, thalamus, globus pallidus, brain stem, and cerebellum.
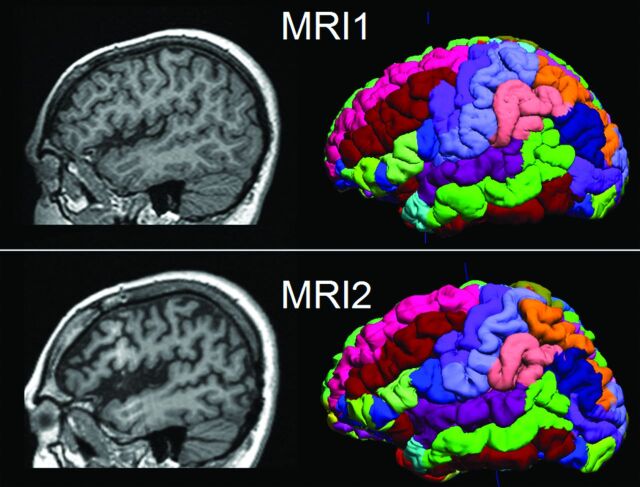
Visualization of the parcellated brain regions (the final output of BrainSuite processing) in 1 patient is shown in Fig 1 as an example. This patient underwent 2 MRIs, separated by 7 years, with the second scan showing progressive atrophy around the left peri-Sylvian area.
Fig 1.
Illustration of 2 serial MRIs from the same patient (P6) and the SVReg output of BrainSuite. First row: MR imaging at 10 years of age. Second row: MR imaging at 17 years of age. Shown in the left column are the sagittal T1-weighted MPRAGE images. The right column is the cortical rendering of the SVReg labels, with different colors denoting different anatomic areas of the brain. Pronounced atrophy can be observed at the left peri-Sylvian area, and HRvol shows a decrease from 0.79 to 0.70.
Scans from controls were processed with the same methodology as patients. In healthy controls (who did not have an affected hemisphere), all the ratios were calculated by randomly dividing the 2 sides. In controls with non-RE epilepsy, all ratios were determined by dividing the epilepsy side by the nonepileptic side.
Statistics
Statistical analyses were performed by using the Statistics Toolbox in Matlab 2013b (MathWorks, Natick, Massachusetts). The Mann-Whitney U test was performed to compare the degree of atrophy between different brain regions (multiple comparison corrected by the false discovery rate9). The 2-tailed Pearson correlation coefficient test was used to assess the correlation between the lobar ratios and epilepsy duration. The significance level was set at P < .05. The methodology of classification is described below.
Overall Workflow
As shown in On-line Fig 1, the 15 volumetric ratio measures from both patients and controls were first normalized by subtracting the pooled mean and dividing by the pooled SD. The logistic regression classifier was trained to discriminate the patients and controls by using each of the volumetric ratio measures. The binary logistic regression classifier can be described as follows:
where fi(n) is the nth observation from the ith feature, β0, β1 are the regression parameters, and π[fi(n)] is the probability that the feature fi(n) belongs to the patient class. For example, a value of π[fi(n)] = 0.8 denotes an 80% probability that the feature fi(n) belongs to the patient class. The decision boundary for the classifier was set at 0.5 (ie, a value of π[fi(n)] > 0.5 denotes a patient class).
Cross-Validation
The performance of the classifier was assessed via 5-fold cross-validation. For the cross-validation, the original features were randomly partitioned into 5 equal-sized subgroups (G1,G2…G5) containing equal numbers of patients and controls. From the 5 subgroups, a single subgroup was used as a validation dataset for testing the model and the remaining 4 subgroups were used as training data. The process was repeated 5 times so that each of the subgroups was used once as the testing dataset. The performance of the classifier was then quantified by estimating the accuracy (Acc) of the predictor on the validation dataset (or test data) as follows:
where TP, TN, FP, and FN denote the number of true-positives, true-negatives, false-positives, and false-negatives, respectively. The mean values of accuracy across the 5 trials were used to quantify the performance of the classifier.
Classifier Design
Based on the results of the cross-validation analysis described in the previous section, the feature with the highest accuracy was selected for constructing the optimal classifier. A leave-one-out cross-validation strategy was used—ie, the classifier was constructed by using N-1 samples and was tested on the left-out sample. The process was repeated N times so that each of the samples was used once as the testing data. The sensitivity and specificity of the classifier were estimated, and the receiver operating characteristic curve was constructed. The performance of the classifier was evaluated by estimating the area under the curve.
Probability Curve
Equation 1 was used to generate a probability curve to describe how the chosen feature predicts the probability of the patient belonging to the RE group. The probability curve was generated from the 42 RE scans and 42 non-RE epilepsy scans from this study (assuming a pretest probability of 50%); another probability curve was additionally generated to correct for the difference in incidence of RE and non-RE epilepsy (1 in 1,000,000 versus 1 in 100) with the methods established by Whittemore.10
Results
Patient and Control Demographics
Table 1 describes the 19 patients with RE included in this study. All patients met the diagnostic criteria as previously published.3 In 15 patients, the diagnosis was confirmed by biopsy and/or surgical pathology. In the remaining 4 patients, the RE diagnosis was based on the presence of the following features: 1) focal seizures and unilateral cortical deficits, 2) electroencephalography with unihemispheric slowing with or without epileptiform activity and unilateral seizure onset, and 3) MR imaging with unihemispheric atrophy and T2/FLAIR hyperintense signal in the GM/WM or caudate. Forty-two MRIs from these 19 patients with RE were included in this study.
Table 1:
Detailed demographics and clinical data of the 19 patients with RE and 2 control groups
| Demographics | |
|---|---|
| Patients with RE (N = 19) | |
| Mean age and SD at epilepsy onset (median) (range) (yr) | 7.3 ± 5.3; 8; 1.5–22 |
| Mean disease duration and SD at first MRI (median) (range) (yr) | 4.0 ± 4.8; 2.9; 0.1–20 |
| Sex (No.) | |
| Female | 11 |
| Male | 8 |
| Handedness (No.) | |
| Right | 13 |
| Left | 5 |
| Ambidextrous | 1 |
| Surgery location (No.) | |
| Hemispherectomy | 12 (10 SF) |
| Frontal | 1 (1 SF) |
| Insular/opercular | 1 |
| Temporal | 1 |
| No surgery | 4 |
| No. of MRI scans | |
| Single scan | 10 |
| Multiple scans | 9 (range, 2–7) |
| Mean age and SD at MRI (N = 42 scans) (median) (range) (yr) | |
| RE scans | 14.2 ± 8.0; 14.8; 3–43 |
| Healthy controls | 14.3 ± 8.0; 14.0; 3.6–43 |
| Controls with non-RE epilepsy | 16.9 ± 7.6; 15.5; 5–31 |
| Mean disease duration and SD at MRI (N = 42 scans) (median) (range) (yr) | |
| RE scans | 7.0 ± 5.6; 6.3; 0.8–21.4 |
| Controls with non-RE epilepsy | 7.6 ± 5.1; 6.5; 1–22 |
Note:—SF indicates seizure-free with >12 months postoperative follow-up.
Predictive Values
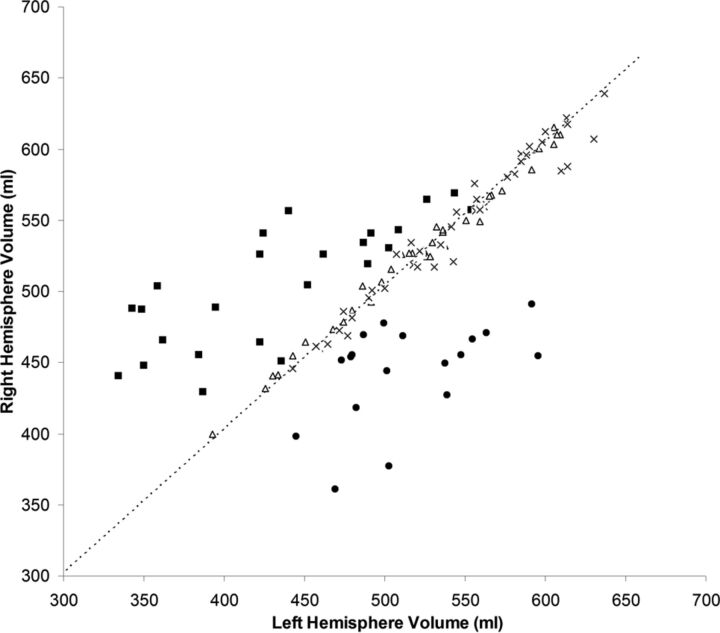
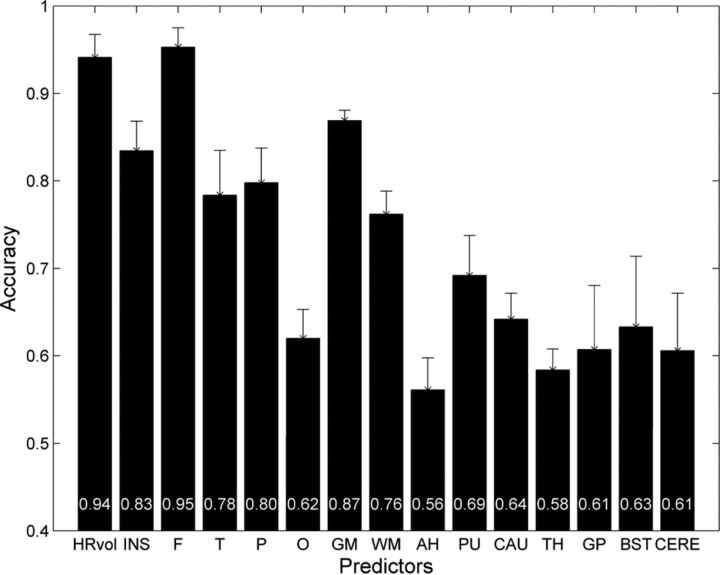
As shown in Fig 2, hemispheric asymmetry of total brain volume produced a clearly defined separation of patients with RE from controls (both healthy and those with non-RE epilepsy). Both control groups clustered tightly along the diagonal line that represents hemispheres with equal volumes, whereas the patients (regardless of left- or right-sided) showed markedly more dispersion in the hemispheric volumes. In all patients with RE, HRvol was <1.0, indicating a smaller volume of the affected hemisphere. Figure 3 shows the mean accuracy of the logistic regression classifier for all volumetric measure ratios, using controls with non-RE epilepsy. The highest prediction accuracy was for HRvol and frontal lobe ratio (0.94 and 0.95), which were not significantly different.
Fig 2.
Absolute volume of the right hemisphere versus volume of the left hemisphere in patients with RE and 2 control groups. Triangles indicate healthy controls; crosses, controls with non-RE epilepsy; squares, patients with left RE; and circles, patients with right RE. The dashed line is the diagonal line representing hemispheres with equal volumes.
Fig 3.
Mean accuracy across the 5 cross-validation runs of the logistic regression classifier for 15 volumetric ratio measures. Patients with RE were compared with controls with non-RE epilepsy with matching disease durations. Error bars denote the SD. The mean accuracy values for each measure were plotted at the bottom of the bars. INS indicates insula; F, frontal; T, temporal; P, parietal; O, occipital; AH, amygdala and hippocampus; PU, putamen; CAU, caudate nucleus; TH, thalamus; GP, globus pallidus; BST, brain stem; and CERE, cerebellum.
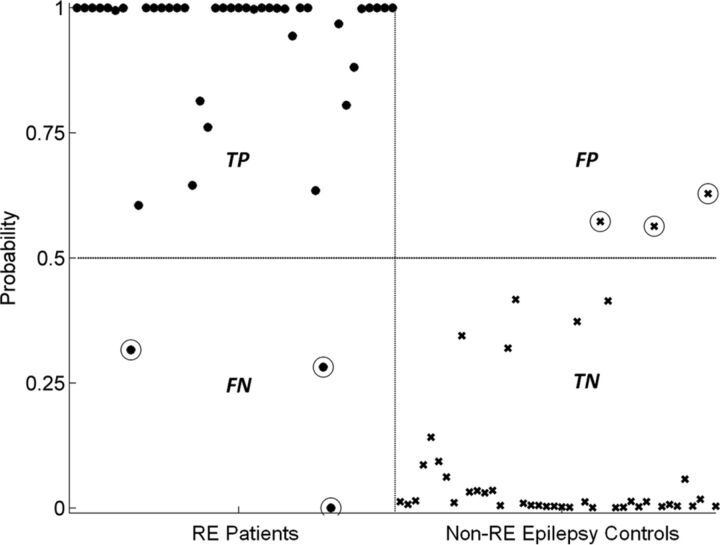
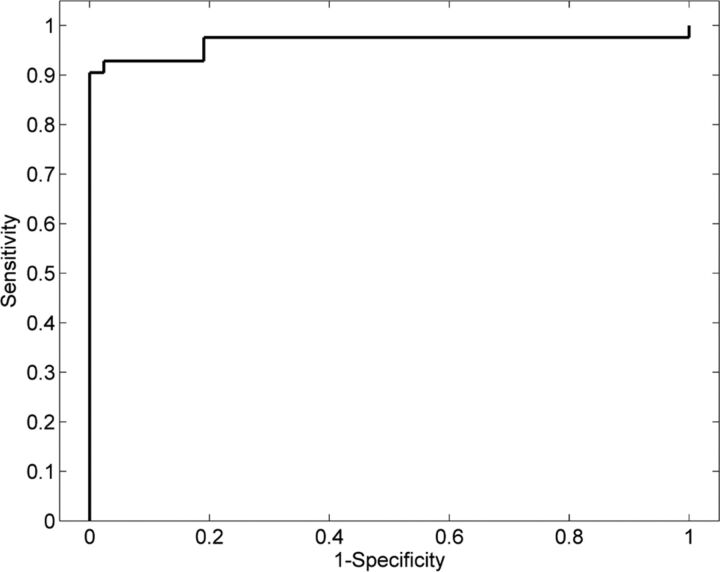
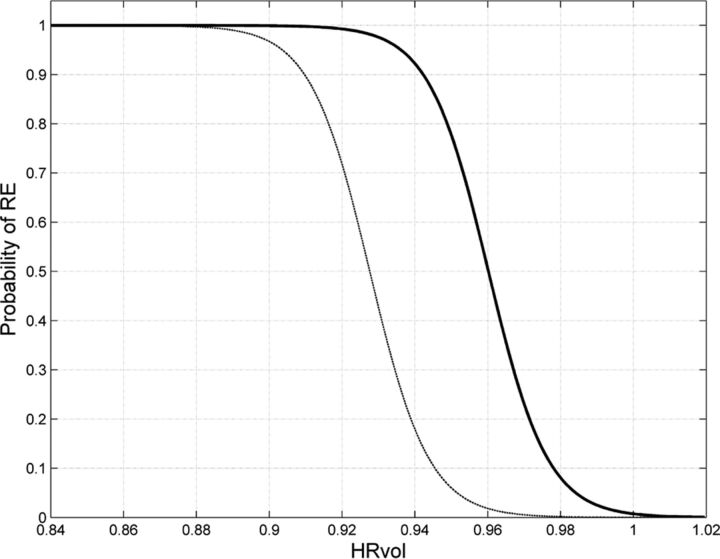
We used HRvol as the feature for the classifier and evaluated its performance. With this classifier, most of the patients and controls were correctly classified. As shown in Fig 4, of 42 scans of patients with RE, only 3 were misclassified; of 42 controls with non-RE epilepsy, only 3 were misclassified. The classifier attained a sensitivity of 0.93 and a specificity of 0.93. The receiver operating characteristic curve of the detector is shown in Fig 5. The area under the curve was 0.97, which denotes a highly discriminative classifier. Figure 6 shows the probability curves that depict the relationship between HRvol and the probability of the patient belonging to the RE group. The classifier using the frontal lobe ratio had a similar performance (sensitivity = 0.95, specificity = 0.97, area under the curve = 0.97).
Fig 4.
Performance of the classifier using HRvol. Patients with RE are denoted with dots, and controls with non-RE epilepsy were denoted with crosses. True-positives (TP) are defined as patients correctly identified as patients by the classifier. True-negatives (TN) are defined as controls correctly identified as controls. False-positives (FP) are defined as controls incorrectly identified as patients. False-negatives (FN) are defined as patients incorrectly identified as controls. Circled dots/crosses denote the subjects who were misclassified (3 FPs and 3 FNs).
Fig 5.
Receiver operating characteristic analyses showing a highly discriminative classifier using HRvol.
Fig 6.
Probability curves depicting the relationship between HRvol and the probability of RE. The solid curve was estimated on the basis of comparison of 42 scans from patients with RE and 42 scans from controls with non-RE epilepsy with the same disease duration. The thin dashed curve was additionally generated to correct for the difference in incidence of RE and non-RE epilepsy (1 in 1,000,000 versus 1 in 100).
Degree of Atrophy
As shown in Table 2, among all the lobar regions, the insula exhibited the most atrophy at the most recent MRI (P < .05). Among all the basal ganglia and mesial temporal structures, the regional atrophy differences were not statistically significant. Nine patients showed ipsilateral brain stem atrophy, and 3 patients showed contralateral cerebellar atrophy, with a ratio of <0.95 at the most recent MRI.
Table 2:
Regional atrophy difference in all the lobar, basal ganglia and mesial temporal structure regions
| Region | Ratio of Atrophy (±SD) |
|---|---|
| Lobar | |
| Insula | 0.77 ± 0.04 |
| Frontal | 0.84 ± 0.03 |
| Temporal | 0.88 ± 0.03 |
| Parietal | 0.87 ± 0.03 |
| Occipital | 0.90 ± 0.05 |
| GM | 0.85 ± 0.02 |
| WM | 0.88 ± 0.02 |
| Basal ganglia and mesial temporal structures | |
| AH | 0.90 ± 0.02 |
| PU | 0.88 ± 0.03 |
| CAU | 0.89 ± 0.06 |
| TH | 0.95 ± 0.04 |
| GP | 0.94 ± 0.02 |
Note:—AH indicates amygdala and hippocampus combined; PU, putamen; CAU, caudate nucleus; TH, thalamus; GP, globus pallidus.
Longitudinal Analyses
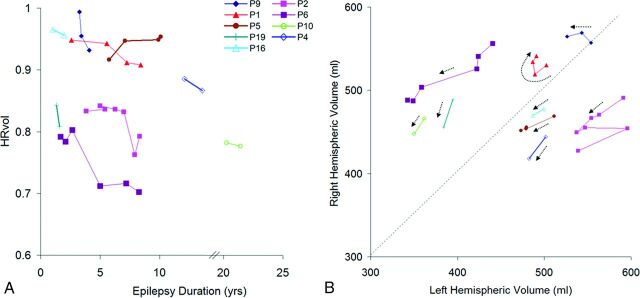
Figure 7A shows the disease progression in the 9 patients with multiple scans. The median change of HRvol per year was −1.4%. All patients had decreasing HRvols, indicating disease progression, with the exception of 1 patient (P5) who showed an increase of HRvol with time. Seven of these 9 patients had intravenous immunoglobulin (IVIG) treatment with varying responses. P9 responded well with a reduction of seizures; P1 and P6 had only transient responses in terms of seizure control after each IVIG cycle; and patients 2, 4, 5, and 16 had no clear benefit. In P2, a marked drop of HRvol was observed at the sixth MRI, at which time the patient was admitted for status epilepticus. The seventh MRI in the same patient was performed after seizures were controlled (IVIG + steroids + tacrolimus), and a slight increase of HRvol was observed at that time, though not back to the baseline level of the previous 5 MRIs.
Fig 7.
A, HRvol plotted over epilepsy duration in the 9 patients with serial MR imaging. All except P5 show a decrease in HRvol for the observed time. The axis is broken from 14 to 20 years because there are no data points for these durations. B, Absolute hemispheric volume (right-sided versus left-sided plots) of the same 9 patients. The direction of each dotted arrow shows the progression of disease over time in each patient. A and B share the same symbol for each patient for direct comparison.
Additional information can be obtained by analyzing absolute volumes of the hemispheres as shown in Fig 7B. The volumes of most patients moved downward (toward origin) with time, as indicated by the arrows. P2 (who had a marked drop of HRvol at the sixth MRI due to status epilepticus) had abrupt changes in the absolute volumes, and review of the MR imaging showed bilateral swelling, more on the unaffected side. P1 and P9 did not show a clear downward trend.
Correlation of Volume Loss with Disease Duration
The ratios of frontal lobe and insular volumes were significantly negatively correlated with disease duration (P = .018, P < .01, respectively, 2-tailed Pearson correlation test). The correlation was not significant for the ratio of the other lobes, mesial or deep brain structures, or interhemispheric ratio.
Discussion
We present here automated volumetric analyses of a large series of patients diagnosed with Rasmussen syndrome. Independently using a different platform of processing routines, our results confirmed the volumetric findings reported in a previous study by Wagner et al.5 We further expanded the previous study by evaluating the predictive values of volumetric findings, with the addition of healthy and epilepsy controls. Our study provides further evidence that automatic volumetric analysis can be useful in the diagnosis of patients with RE on an individual basis.
The most important finding from our study is that volumetric measures, particularly interhemispheric and frontal lobe ratios, had a high degree of accuracy in separating patients from those with non-RE epilepsy with the same disease duration. Used in the relevant clinical settings, such as initial and follow-up investigations in patients with epilepsy with suspected RE, the probability curve that was estimated by using HRvol can potentially provide an objective measure to solidify the confidence of the diagnosis. Additionally, with the methodology established in this article, such patients can be studied prospectively with volumetric findings compared with surgical pathology/biopsy.
In terms of lobar atrophy, we found the insula to be significantly more atrophic than all the other lobes. In terms of predictive value, the frontal lobe ratio was found to be the most predictive measure for RE among all lobes—that is, the frontal lobe ratio separated patients from controls with the highest accuracy. One should not confuse prediction accuracy with the size of an effect (atrophy) because having a large effect does not necessarily imply higher accuracy. This was seen in our data, in which the frontal lobe ratio had the best accuracy but the insula had the most atrophy. Segmentation of the insula cortex can be difficult, and thickness can be overestimated; these issues cause more noise in the measured data, which can explain the lower accuracy. Both frontal and insular ratios, however, correlated significantly with disease duration. These findings support the frontal lobe and insula being preferentially involved in the atrophic process, compared with the temporal, parietal, and occipital lobes. This finding is consistent with those from previous studies.1,5,11–13
Our results show that the predictive accuracy of GM is greater than that of WM; these findings may suggest that GM is preferentially affected in RE compared with WM. In terms of the severity of atrophy, both GM and WM were affected and lost volume across the years. Although GM had a lower mean ratio than WM, the difference was not statistically significant. Overall, this finding is consistent with findings in the previous study by Wagner et al,5 in which the authors found a preferential effect of RE on GM, and other studies that documented additional WM involvement (especially at the advanced stages of RE) by pathology and imaging methods.14,15
Three patients (P8, P9, P16) were misclassified as healthy by the HRvol classifier and the frontal lobe ratio classifier. All 3 patients had pathologic confirmation of RE based on biopsy and/or surgical pathology. In P9 and P16, the MRIs that were misclassified were at 3 years and 1 year of epilepsy onset, respectively; later MRIs at (3.5 and 2 years, respectively) were correctly classified as RE. These data indicate a need for improving the sensitivity of our methodology, especially for detecting subtle changes at an early stage of the disease; alternatively, these data could suggest that volume loss in select patients at the initial stage of RE may not be sufficient to be differentiated from normal variations. On the other hand, the 3 patients in our cohort who had the shortest disease duration at the first MRI (0.1, 0.83, 0.91 years, respectively) were all correctly classified; this result demonstrates the effectiveness of our methodology in these patients.
Our findings also demonstrated the feasibility that progression of RE can be measured by volumetric analysis. Most patients with serial MRIs showed a decrease in HRvol, indicating disease progression despite IVIG and antiepileptic drug treatments. Additionally, by analyzing the absolute hemispheric volumes, we found that patients with RE also had atrophy in the unaffected hemisphere and had bilateral brain volume loss—that is, the volume of most patients moved downward (toward origin) across time as shown on the absolute hemisphere volume plot. The patients who showed unusual time courses of longitudinal hemispheric volumes and ratios could be explained in several ways: 1) natural progression of the disease (acute and chronic); for example, P2 had abrupt changes in the absolute volumes due to status epilepticus, and review of the MRI showed bilateral swelling which might have contributed to the volume change; 2) transient response to treatment; for example, P1 had had transient response to IVIG, which may have caused corresponding volume changes; 3) natural brain development; for example, P1 and P9, who did not show a clear downward trend of the arrows, were 8 and 3 years of age, respectively. It is conceivable that between the scans, the brains were still developing and growing; therefore, absolute volume may not be a good measure of disease progression. In fact, HRvol of both patients showed a clear downward trend with time. 4) The last reason is the possibility of bilateral RE; for example, P5 was the only patient whose HRvol increased with time, indicating a higher volume of atrophy in the unaffected hemisphere than in the affected hemisphere. This finding raises the possibility of bilateral RE, despite the seizures being found in the affected hemisphere only by electroencephalography. However, the presence of bilateral RE is debated and likely very rare; only 2 cases of the reported 200–300 cases in the literature showed histopathologic proof for bilateral RE.16,17 No biopsy was obtained from the unaffected hemisphere to confirm or disprove the possibility of bilateral RE in P5.
The performance of the classifier constructed in our study was similar when comparing patients with RE to either the healthy controls or the controls with non-RE epilepsy. If one takes into account the epilepsy controls having the same disease duration as the patients with RE, our data provide quantitative evidence that brain volume decrease (likely caused by extensive neuronal loss1–3) is a characteristic of RE, which, as we show in this study, can be used to accurately separate patients with RE from those with non-RE epilepsy.
Several limitations should be considered when interpreting the results of our study:
Three patients in this study had an adolescent or adult-onset age (13, 13, and 22 years of age, respectively). These patients are considered to have a less common presentation of RE18 and could bring heterogeneity to the study cohort. Additionally, 4 patients did not have pathology/biopsy to confirm RE. Although we followed the commonly accepted diagnostic criteria,3 the lack of pathologic confirmation could still potentially contribute to an inaccurate diagnosis of RE.
Due to the retrospective design of the study, there was a relatively long interval between disease onset and the earliest MR imaging available for volumetric analysis in our cohort. Only in a small subset of patients with RE (3 of 19) did we have access MRI data within 1 year of their initial disease onset. For the other patients, the initial MRI was either performed outside the Cleveland Clinic or not performed with volumetric T1 sequences and could not be used for analysis. Therefore, on the basis of the current data, it was not possible to determine the effectiveness of our methodology for early diagnosis. Additionally, many of the patients with RE were referred to our center for surgery; in these patients, only 1 presurgical MRI was available for analysis and there were no data for the later stages of the disease. Overall, further prospective studies are warranted to confirm the validity of the findings from our current study.
The 42 MRIs from the 19 patients with RE were treated as 42 different cases and were matched to 42 different control subjects, introducing potential bias in the comparison.
This study was not set up to evaluate the effectiveness of immune therapy. We could not assess whether IVIG was an effective treatment to alleviate the disease impact because there was no proper control group (patients without IVIG). A more rigorous study design is needed to make any definite conclusions on treatment effectiveness.
As future work, it is conceivable to use the established methodology to prospectively analyze patients with suspected RE and compare with biopsy and surgical pathology. Our methodology can also be used to monitor disease progression in patients with confirmed RE by calculating volumetric changes in hemispheric and lobar regions on their repeat MRIs. In terms of methodologic improvement, in addition to volumetric measures, we will also extract other important features of the T1 dataset (such as signal change) to be used as the input to the classifier, to improve classification of patients at the early stage of the disease.
Conclusions
Our study highlights the usefulness of volumetric analysis to assist the diagnosis of patients with Rasmussen syndrome. We demonstrate that interhemispheric and frontal lobe ratios can accurately classify individual patients with RE from healthy controls and patients with non-RE epilepsy with the same disease duration. The probability curves generated in our study can be used in appropriate clinical settings to solidify the confidence of the diagnosis of RE. We also demonstrate that progression of hemispheric atrophy can be measured reliably by volumetric analysis. Such analysis, when used in conjunction with other clinical data, can provide insight into disease progression and treatment effectiveness, and could be considered as part of the follow-up process for patients with suspected RE.
Supplementary Material
Acknowledgments
We thank James Bena, Lead Biostatistician, Cleveland Clinic Quantitative Health Sciences, for his assistance on the statistical analyses.
ABBREVIATIONS:
- HRvol
interhemispheric ratio (affected side/unaffected side)
- IVIG
intravenous immunoglobulin
- RE
Rasmussen encephalitis
- SVReg
surface and volume registration
Footnotes
Disclosures: Z. Irene Wang—RELATED: Grant: National Institute of Neurological Disorders and Stroke R01 NS074980.* David W. Shattuck—RELATED: Grant: National Institute of Neurological Disorders and Stroke R01 NS074980.* Richard M. Leahy—RELATED: Grant: National Institute of Neurological Disorders and Stroke R01 NS074980, R01 NS089212.* Elaine Wyllie—UNRELATED: Royalties: Wolters Kluwer Publishing, Lippincott, Comments: royalties for being the editor-in-chief of Wyllie's Treatment of Epilepsy, 6th ed. John C. Mosher—RELATED: Grant: National Institutes of Health National Institute of Neurological Disorders and Stroke R01 NS074980.* Stephen E. Jones—RELATED: Grant: National Institutes of Health National Institute of Neurological Disorders and Stroke R01 NS074980*; UNRELATED: Congressionally Directed Medical Research Programs*; Payment for Lectures (including service on Speakers Bureaus): Siemens, Monteris Medical, Comments: for speaking about 7T and about advanced imaging; Royalties: Academic Press (for MRI Atlas of Pituitary Pathology); Payment for Development of Educational Presentations: Webinar on MS imaging (Cleveland Clinic). *Money paid to the institution.
Part of the data used in the preparation of this article were obtained from the Pediatric Imaging, Neurocognition and Genetics Study (PING) database (http://ping.chd.ucsd.edu). As such, the investigators within PING contributed to the study by providing data but did not participate in the analysis or writing of this study.
Research reported in this publication was supported by the National Institute of Neurological Disorders and Stroke of the National Institutes of Health under award No. R01 NS074980 (Z.I.W., S.E.J., D.W.S., R.M.L., J.C.M.) and R01 NS089212 (R.M.L.). Healthy control data collection and sharing for this project were funded by the Pediatric Imaging, Neurocognition and Genetics Study via the National Institutes of Health grant RC2DA029475 and the National Institute on Drug Abuse and the Eunice Kennedy Shriver National Institute of Child Health and Human Development.
The content is solely the responsibility of the authors and does not necessarily represent the official views of the National Institutes of Health.
Paper previously presented in part at: Annual Meeting of the American Society of Neuroradiology and the Foundation of the ASNR Symposium, April 25–30, 2015; Chicago, Illinois.
References
- 1. Bien CG, Widman G, Urbach H, et al. The natural history of Rasmussen's encephalitis. Brain 2002;125:1751–59 10.1093/brain/awf176 [DOI] [PubMed] [Google Scholar]
- 2. Bauer J, Elger CE, Hans VH, et al. Astrocytes are a specific immunological target in Rasmussen's encephalitis. Ann Neurol 2007;62:67–80 10.1002/ana.21148 [DOI] [PubMed] [Google Scholar]
- 3. Varadkar S, Bien CG, Kruse CA, et al. Rasmussen's encephalitis: clinical features, pathobiology, and treatment advances. Lancet Neurol 2014;13:195–205 10.1016/S1474-4422(13)70260-6 [DOI] [PMC free article] [PubMed] [Google Scholar]
- 4. Larionov S, König R, Urbach H, et al. MRI brain volumetry in Rasmussen encephalitis: the fate of affected and “unaffected” hemispheres. Neurology 2005;64:885–87 10.1212/01.WNL.0000152895.23010.52 [DOI] [PubMed] [Google Scholar]
- 5. Wagner J, Schoene-Bake JC, Bien CG, et al. Automated 3D MRI volumetry reveals regional atrophy differences in Rasmussen encephalitis. Epilepsia 2012;53:613–21 10.1111/j.1528-1167.2011.03396.x [DOI] [PubMed] [Google Scholar]
- 6. Joshi AA, Shattuck DW, Leahy RM. A method for automated cortical surface registration and labeling. Biomed Image Regist Proc 2012;7359:180–89 10.1007/978-3-642-31340-0_19 [DOI] [PMC free article] [PubMed] [Google Scholar]
- 7. Shattuck DW, Leahy RM. BrainSuite: an automated cortical surface identification tool. Med Image Anal 2002;6:129–42 10.1016/S1361-8415(02)00054-3 [DOI] [PubMed] [Google Scholar]
- 8. Pantazis D, Joshi A, Jiang J, et al. Comparison of landmark-based and automatic methods for cortical surface registration. Neuroimage 2010;49:2479–93 10.1016/j.neuroimage.2009.09.027 [DOI] [PMC free article] [PubMed] [Google Scholar]
- 9. Benjamini Y, Hochberg Y. Controlling the false discovery rate: a practical and powerful approach to multiple testing. J R Stat Soc Series B Methodol 1995;57:289–300 [Google Scholar]
- 10. Whittemore AS. Logistic regression of family data from case-control studies. Biometrika 1995;82:57–67 10.1093/biomet/82.1.57 [DOI] [Google Scholar]
- 11. Bhatjiwale MG, Polkey C, Cox TC, et al. Rasmussen's encephalitis: neuroimaging findings in 21 patients with a closer look at the basal ganglia. Pediatr Neurosurg 1998;29:142–48 10.1159/000028709 [DOI] [PubMed] [Google Scholar]
- 12. Chiapparini L, Granata T, Farina L, et al. Diagnostic imaging in 13 cases of Rasmussen's encephalitis: can early MRI suggest the diagnosis? Neuroradiology 2003;45:171–83 [DOI] [PubMed] [Google Scholar]
- 13. Rajesh B, Kesavadas C, Ashalatha R, et al. Putaminal involvement in Rasmussen encephalitis. Pediatr Radiol 2006;36:816–22 10.1007/s00247-006-0176-4 [DOI] [PubMed] [Google Scholar]
- 14. Cauley KA, Burbank HN, Filippi CG. Diffusion tensor imaging and tractography of Rasmussen encephalitis. Pediatr Radiol 2009;39:727–30 10.1007/s00247-009-1261-2 [DOI] [PubMed] [Google Scholar]
- 15. Pardo CA, Vining EP, Guo L, et al. The pathology of Rasmussen syndrome: stages of cortical involvement and neuropathological studies in 45 hemispherectomies. Epilepsia 2004;45:516–26 10.1111/j.0013-9580.2004.33103.x [DOI] [PubMed] [Google Scholar]
- 16. Chinchilla D, Dulac O, Robain O, et al. Reappraisal of Rasmussen's syndrome with special emphasis on treatment with high doses of steroids. J Neurol Neurosurg Psychiatry 1994;57:1325–33 10.1136/jnnp.57.11.1325 [DOI] [PMC free article] [PubMed] [Google Scholar]
- 17. Tobias SM, Robitaille Y, Hickey WF, et al. Bilateral Rasmussen encephalitis: postmortem documentation in a five-year-old. Epilepsia 2003;44:127–30 10.1046/j.1528-1157.2003.36602.x [DOI] [PubMed] [Google Scholar]
- 18. Oguni H, Andermann F, Rasmussen TB. The syndrome of chronic encephalitis and epilepsy: a study based on the MNI series of 48 cases. Adv Neurol 1992;57:419–33 [PubMed] [Google Scholar]
Associated Data
This section collects any data citations, data availability statements, or supplementary materials included in this article.


