Abstract
The periodically arranged thin filaments within the striated myofibrils of skeletal and cardiac muscle have precisely regulated lengths, which can change in response to developmental adaptations, pathophysiological states, and genetic perturbations. We have developed a user-friendly, open-source ImageJ plugin that provides a graphical user interface (GUI) for super-resolution measurement of thin filament lengths by applying Distributed Deconvolution (DDecon) analysis to periodic line scans collected from fluorescence images. In the workflow presented here, we demonstrate thin filament length measurement using a phalloidin-stained cryosection of mouse skeletal muscle. The DDecon plugin is also capable of measuring distances of any periodically localized fluorescent signal from the Z- or M-line, as well as distances between successive Z- or M-lines, providing a broadly applicable tool for quantitative analysis of muscle cytoarchitecture. These functionalities can also be used to analyze periodic fluorescence signals in nonmuscle cells.
Keywords: line scan, myofibril, periodic repeat, sarcomere, striated muscle
INTRODUCTION
The striated myofibrils of skeletal and cardiac muscle represent a striking example of long-range cytoskeletal organization. Striated myofibrils consist of periodic rows of sarcomeres, which are semicrystalline arrays of interdigitating actin (thin) and myosin (thick) filaments that slide past one another to produce contractile force upon Ca2+ activation. The ability of a sarcomere to produce force can be described by its sarcomere length-tension relationship, which demonstrates that force generation is proportional to the extent of thin and thick filament overlap at a given sarcomere length (Rassier et al., 1999, Gokhin & Fowler, 2013). Hence, thin and thick filament lengths are critical intrinsic structural parameters that directly influence the contractile properties of striated muscle. While thick filament lengths are uniform across all striated muscles examined (~1.65 µm), thin filament lengths have been observed to vary widely, ranging from ~0.95 µm up to 1.40 µm, depending on muscle fiber types (Castillo et al., 2009, Gokhin et al., 2012, Gokhin et al., 2010), postnatal development and aging (Gokhin et al., 2014a), and the presence or absence of a congenital myopathy (e.g., Duchenne muscular dystrophy and subsets of nemaline myopathy) (Gokhin et al., 2014b, Ochala et al., 2012, Ottenheijm et al., 2009, Yuen et al., 2014). Thin filament lengths can also be directly modified via experimental perturbations of thin filament-associated proteins that influence actin subunit dynamics and stability (e.g., nebulin, tropomodulin, and leiomodin) (Bang et al., 2006, Littlefield et al., 2001, Witt et al., 2006, Gregorio et al., 1995, Sussman et al., 1998, Ottenheijm et al., 2013, Li et al., 2015, Gokhin et al., 2015, Pappas et al., 2015). A recent report suggests that thin filament length may also vary with sarcomere length in cardiac muscle cells (Kolb et al., 2016).
Accurate measurements of thin filament lengths are critical for understanding the cellular and molecular basis of the diversity of thin filament lengths observed in striated muscle cells, and how muscle-specific thin filament lengths determine the diverse intrinsic force generation potentials (sarcomere length-tension relationships) of different muscles. Classically, morphometric analysis of transmission electron microscopy (TEM) images has been utilized for thin filament length measurement (Walker & Schrodt, 1974, Robinson & Winegrad, 1979, Lieber et al., 1994, Traeger & Goldstein, 1983), but TEM is labor-intensive, prone to shrinkage artifacts during tissue processing, and precludes identification and localization of specific protein targets. More recently, fluorescence microscopy has been utilized to analyze periodic myofibril fluorescence signals, first performed with subjective “point-and-click” methods (Ringkob et al., 2004) but also with automated analytical tools. One such tool is Distributed Deconvolution (DDecon), a mathematical technique developed by Littlefield and Fowler, which decomposes (deconvolves) an experimental myofibril fluorescence profile (line-scan) into a Gaussian point-spread function based on the diffractive properties of light and an idealized thin filament model profile derived from well-characterized sarcomere symmetry and protein architecture (Littlefield & Fowler, 2002). DDecon has been successfully deployed to measure thin filament lengths in both cardiac and skeletal muscle in a range of experimental studies, providing super-resolution spatial precision (<50 nm for cardiac myofibrils and <20 nm for skeletal myofibrils) (Castillo et al., 2009, Gokhin et al., 2014a, Gokhin et al., 2012, Gokhin et al., 2010, Gokhin et al., 2014b, Littlefield & Fowler, 2002, Bang et al., 2006, Pappas et al., 2015).
Our laboratory has developed a user-friendly, open-source graphical user interface (GUI) for rapid determination of thin filament lengths using DDecon analysis of fluorescence images. The DDecon GUI presented here is available as an ImageJ plugin (available for public download at http://www.scripps.edu/fowler/) and has broad applicability; indeed, it can be applied to cardiac and skeletal muscle, tissue sections and isolated myofibrils, and epifluorescence and confocal images. In the workflow presented here, we demonstrate measurement of thin filament lengths in cryosections of phalloidin-stained skeletal muscle. We encourage the use of fluorescent phalloidin derivatives to measure thin filament lengths, because phalloidin is a widely used and commercially available F-actin probe that binds uniformly and with high affinity and specificity along the entirety of the thin filaments in relaxed and detergent-permeabilized or glycerol-skinned muscles (Ao & Lehrer, 1995, Zhukarev et al., 1997), and thin filament length can be directly calculated as half the breadth of a phalloidin-stained thin filament array (Littlefield & Fowler, 2002). DDecon also can determine the exact distance of any periodically localized protein marker from the Z- or M-line, as well as distances between successive Z- or M-lines, provided that appropriate antibodies or fluorescent constructs are available. For example, precise thin filament lengths can be measured as half the distance between pointed ends on each side of a tropomodulin-labeled thin filament array (Castillo et al., 2009, Gokhin et al., 2014a, Gokhin et al., 2012, Gokhin et al., 2010, Gokhin et al., 2015, Gokhin et al., 2014b, Littlefield et al., 2001, Littlefield & Fowler, 2002). Finally, the analytical capabilities of DDecon can be leveraged to enable accurate localization of novel sarcomeric components for elucidation of muscle cytoarchitecture, as well as periodically localized proteins in nonmuscle cells.
WORKFLOW
Sample preparation: relaxation
Muscle tissue samples should be appropriately processed prior to fluorescence imaging and DDecon analysis. First, muscles should be adequately relaxed to release actomyosin crossbridge interactions, thereby improving penetration of antibodies and fluorescent stains. Relaxation can be achieved by incubating muscles in a relaxing buffer, which contains a chelating agent (e.g., EGTA) that sequesters endogenous Ca2+ and takes the muscle out of rigor. A typical relaxing buffer is 100 mM NaCl, 2 mM KCl, 2 mM MgCl2, 6 mM K3PO4, 1 mM EGTA, 0.1% glucose, pH 7.0, which we have used to relax mouse hindlimb muscles for cryosectioning or preparation of isolated myofibrils (Gokhin et al., 2014a, Gokhin et al., 2010, Gokhin et al., 2015, Gokhin et al., 2014b), or 100 mM KCl, 5 mM MgCl2, 5 mM EGTA, 10 mM imidazole, 5 mM ATP, pH 7.0, which we have used to relax human shoulder muscle biopsies for cryosectioning (Gokhin et al., 2012). Note that imidazole buffers are preferred over phosphate buffers if muscle tissue specimens are also being used in contractility experiments where free Ca2+ must be precisely controlled (Ochala et al., 2012). Depending on the thickness of the muscle sample, relaxation may have to be performed overnight to allow complete penetration of the chelating agent into the sample and time to deplete the endogenous Ca2+ stores from the sarcoplasmic reticulum. To minimize proteolytic degradation of the sample during relaxation, protease inhibitor cocktail should be added to the relaxing buffer immediately before use, and relaxation should be performed on ice. Relaxation should be performed prior to and during stretching (see below).
Sample preparation: stretching
Muscles should be adequately stretched during relaxation, and prior to fixation, permeabilization, and subsequent processing. At neutral or contracted sarcomere lengths, the oppositely polarized thin filaments from adjacent thin filament arrays are in close proximity or are overlapping. When overlapping thin filament arrays are phalloidin-stained and examined by fluorescence microscopy, the resulting F-actin signal appears continuous and non-striated, which renders accurate DDecon analysis of thin filament lengths impossible. Stretching the muscle sample during relaxation and prior to fixation eliminates this confounding problem. Stretching also has the benefit of separating thin filament pointed end-associated proteins (e.g., tropomodulin) from opposite half-sarcomeres that appear as a single stripe at neutral or contracted sarcomere lengths but can be resolved into two stripes when the thin filament arrays are fully separated (Littlefield & Fowler, 2002, Fowler et al., 1993). In practice, mouse hindlimb muscles can be easily stretched in situ by immobilization at an extreme joint angle. For example, tibialis anterior (TA) and extensor digitorum longus (EDL) muscles can be stretched by immobilization at maximal ankle plantarflexion, while soleus and gastrocnemius muscles can be stretched by immobilization at maximal ankle dorsiflexion (Gokhin et al., 2014a, Gokhin et al., 2010, Gokhin et al., 2015, Gokhin et al., 2014b). Ex vivo rat psoas major muscle can be stretched by tying the muscle to a 5cc syringe plunger in a stretched configuration (Fowler et al., 1993). Ex vivo human muscle biopsies can be stretched by carefully cutting them into longitudinally oriented strips, followed by securing the strips onto thin wooden dowels in a stretched configuration using surgical sutures (Gokhin et al., 2012). Stretched and immobilized muscles can then be immersed in relaxing buffer (see above). Novel stretching protocols may need to be developed on a case-by-case basis.
Sample preparation: fluorescence staining
After relaxation and stretching, muscles can be paraformaldehyde-fixed in a stretched configuration, cryoprotected, and OCT-embedded, followed by cutting of frozen cryosections and immunostaining and/or phalloidin staining, as we have described previously (Gokhin et al., 2014a, Gokhin et al., 2012, Gokhin et al., 2010, Gokhin et al., 2015, Gokhin et al., 2014b, Ochala et al., 2012). Alternatively, muscles can be homogenized to isolate myofibrils, which are then adsorbed to coverslips and subjected to immunostaining and/or phalloidin staining, as described previously (Castillo et al., 2009, Gokhin et al., 2014b, Ochala et al., 2014).
Imaging
Fluorescence images of muscle samples that will be subjected to DDecon analysis should be collected using a conventional, diffraction-limited fluorescence imaging modality. Most commonly, DDecon has been applied to confocal images of muscle cryosections, because confocal imaging excludes out-of-focus fluorescence to optimize image quality (Gokhin et al., 2010). Epifluorescence imaging is appropriate for thin samples (e.g., isolated myofibrils), wherein out-of-focus fluorescence is minimized (Littlefield & Fowler, 2002). Regardless of the imaging modality used, the image magnification (both objective lens and digital zoom) should be recorded, in order to convert distances in pixels into distances in µm after performing DDecon analysis. Note that DDecon analysis is inappropriate for single-molecule fluorescence imaging (e.g., PALM and STORM), as DDecon relies on averaging signals from many fluorescent molecules to identify their location using a Gaussian point-spread function convolved with a model profile based on sarcomere structure (Littlefield & Fowler, 2002) (Table 1). The strengths and limitations of the diverse cellular fluorescence imaging modalities currently available have been reviewed elsewhere (Toomre & Bewersdorf, 2010, Schermelleh et al., 2010).
Table 1.
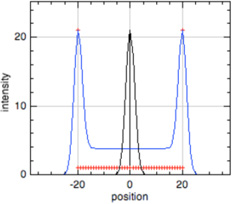
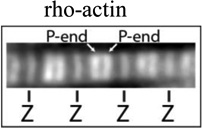
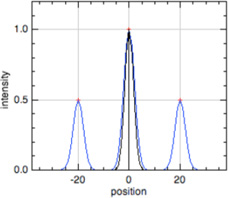
Sample model profiles for DDecon-based fitting and length measurement.
| Model profile | Myofibril staining example* |
Protein(s) whose localization can be modeled |
Sample model profile diagram** |
Output(s) |
|---|---|---|---|---|
| Z-line | 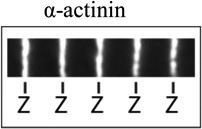 |
α-Actinin, cypher/ZASP, muscle LIM protein/MLP, telethonin/Tcap, myopalladin, desmin, titin N-terminus, nebulin C-terminus (and others) |
 |
Sarcomere length |
| Phalloidin | 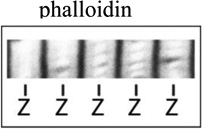 |
F-actin | 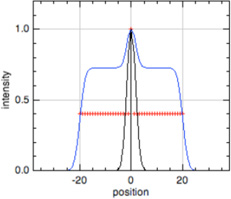 |
Thin filament length, sarcomere length*** |
| P-end | 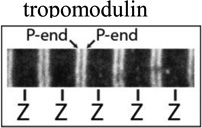 |
Tropomodulin, leiomodin, nebulin N-terminus (and possibly others) |
 |
Thin filament length, proximal segment length****, sarcomere length*** |
| Early Labeled Actin |
 |
Fluorescently labeled actin incorporating into myofibrils |
 |
Pointed end vs. Z-line incorporation, thin filament length, sarcomere length*** |
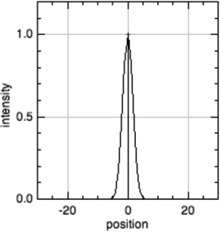
Images illustrating myofibril fluorescence staining for, from the top, α-actinin at Z-lines, phalloidin binding along thin filaments, tropomodulin at pointed ends (P-end), and rhodamine-actin incroproratoin at pointed ends and Z-lines. α-Actinin and tropomodulin1 were imaged by immunostaining, and F-actin by fluorescent phalloidin staining, of myofibrils in mouse skeletal muscle cryosections as in (Gokhin et al., 2010). Rhodamine-labeled actin (rho-actin) was microinjected into living chick cardiac myocytes and myofibrils imaged after 30 min to 1hour, as in (Littlefield et al., 2001)‥
In all model profiles, red crosshairs indicate coordinates whose abscissas are used for length and distance calculations, based on the model profile parameters (focus, thin filament length, uniform fluorescence, or pointed-end fluorescence).
Phalloidin, P-end, and Early Labeled Actin model profiles (blue traces) show a superimposed Z-line profile (black traces) to unambiguously identify the center of the thin filament array, where the Z-line is located, for sarcomere length measurement (Littlefield & Fowler, 2002, Littlefield et al., 2001). For sarcomere length calculations using these profiles, the Z-line is defined as halfway between the ends of the thin filament array.
The proximal segment is the nebulin-stabilized region of the thin filament, extending from the Z-line to the nebulin N-terminus (Gokhin & Fowler, 2013).
File types
DDecon analysis can be performed on any ImageJ-compatible file type, including .tif, .jpg, .gif, .bmp, and .png images. We especially recommend use of .tif images, which provide an excellent balance of good image resolution and file size minimization. DDecon should only be performed on a single-channel image, so multichannel fluorescence images should be separated into single-channel, greyscale image files before importing into DDecon.
Installation
The DDecon plugin operates in ImageJ (version 1.43 or higher); the most current version of ImageJ is available for free public download at http://imagej.nih.gov/ij/, and is also available through the ImageJ menu (Help → Update ImageJ…). We recommend that ImageJ be configured for optimal performance on your system; both available memory and the number of central processing units can be set in the ImageJ menu (Edit → Options → Memory & Threads). Files containing the DDecon plugin and the DDecon User Manual (.zip format) are available for free public download at http://www.scripps.edu/fowler/, and the User Manual is also included as Supplemental Data. To install the plugin, unzip the DDecon.zip file, move the DDecon_.jar file and derby.jar files to the “plugins” folder under the ImageJ installation directory, and, if necessary, restart ImageJ.
Launch screen and assignment of line scans to images
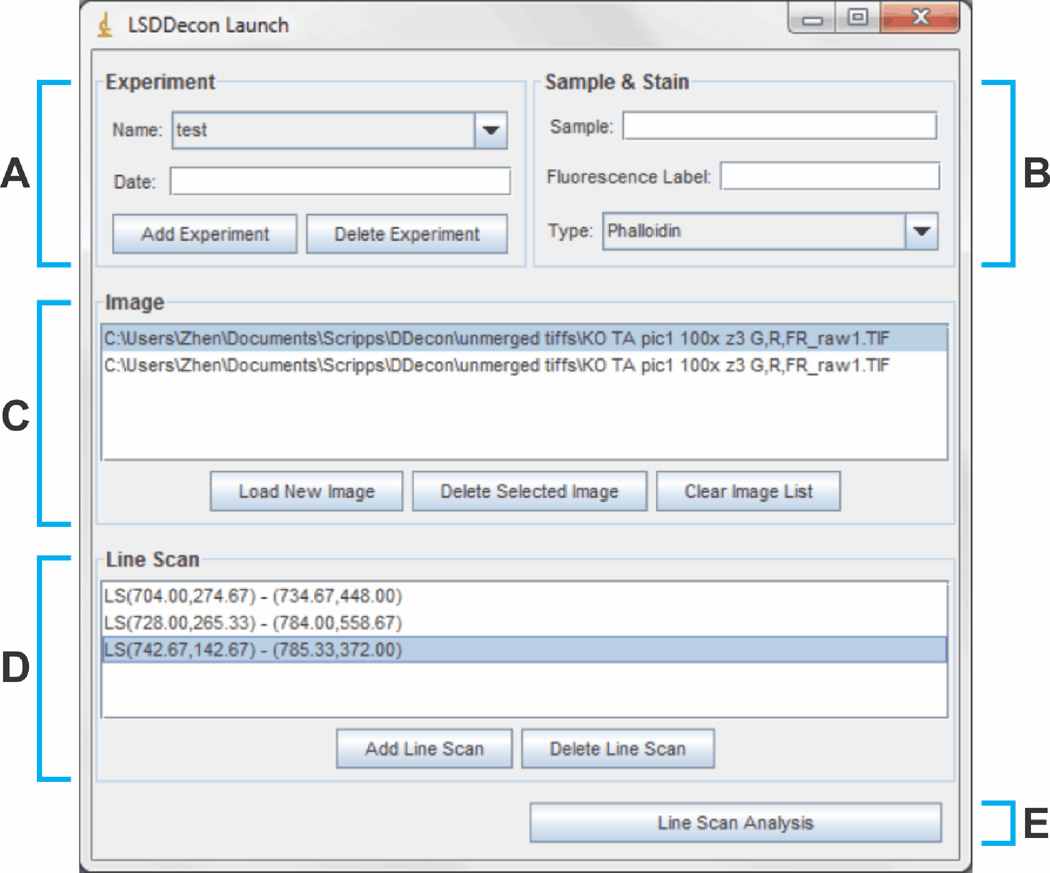
DDecon can be launched through the ImageJ menu (Plugins → DDecon → Launch). The Launch screen (Fig. 1) displays how DDecon utilizes a hierarchical organization for image file management. The highest entry in DDecon’s file management scheme is the “Experiment” category (Fig. 1A). Each experiment is associated with a biological sample, fluorescent stain, and model profile associated with the fluorescent stain (Fig. 1B; Table 1). The appropriate model profiles are selected via a pull-down menu tab labeled “Type” (Fig. 1B), which contains selections for “Z-line”, “Phalloidin”, “P-end” or “Early Labeled Actin” profiles (Table 1). (The “Phalloidin” profile for measuring thin filament lengths as half the breadth of a phalloidin-stained thin filament array is illustrated here and in the following workflow.) Within each experiment, the user can import ImageJ-compatible images of the biological sample stained with the appropriate fluorescent stain (Fig. 1C).
Figure 1. Launch screen.
(A) The “Experiment” panel allows the user to name, date, add, or remove experiments. An experiment consists of a set of image files with their associated line scans and DDecon outputs. All active experiments will appear in the “Name” dropdown menu. Experiments will remain active in the “Name” dropdown menu, unless they are selected and deleted. (B) The “Sample & Stain” panel allows the user to name experimental samples, indicate fluorescent labels, and indicate the type of model profile associated with the fluorescent label, selected from the “Type” dropdown menu (for choices of model profiles, see Table 1). (C) The “Image” panel allows the user to add or remove fluorescence images associated with a given experiment. (D) The “Line Scan” panel allows the user to add or remove line scans associated with a given image. (E) The “Line Scan Analysis” button allows the user to proceed to the Line Scan screen (Fig. 3) to refine line scan selection and perform background correction.
After images are imported, the user draws line scans directly on the images. Within each image, the user can create and select an unlimited number of associated line scans (Fig. 1D), although the exact number of line scans collected per image is up to the user’s discretion and will depend on the number of myofibrils contained within the image. (For example, an image of a muscle tissue cryosection will contain more myofibrils than an image of dispersed isolated myofibrils.) It is essential that line scans be drawn directly on the images, from M-line to M-line, thereby crossing over multiple thin filament arrays (Fig. 2). The number of thin filament arrays traversed by a single line scan is up to the user’s discretion, but 3–6 thin filament arrays is commonplace. Note that a line scan, collected along the longitudinal axis of the muscle fiber, is insensitive to the degree of myofibril misalignment along the transverse axis of the muscle fiber. Each line scan is analyzed one at a time, by selecting (highlighting) the line scan, and then pressing the “Line Scan Analysis” button to continue (Fig. 1E).
Figure 2. Sample image of phalloidin-stained mouse skeletal muscle and corresponding line scan trajectory.
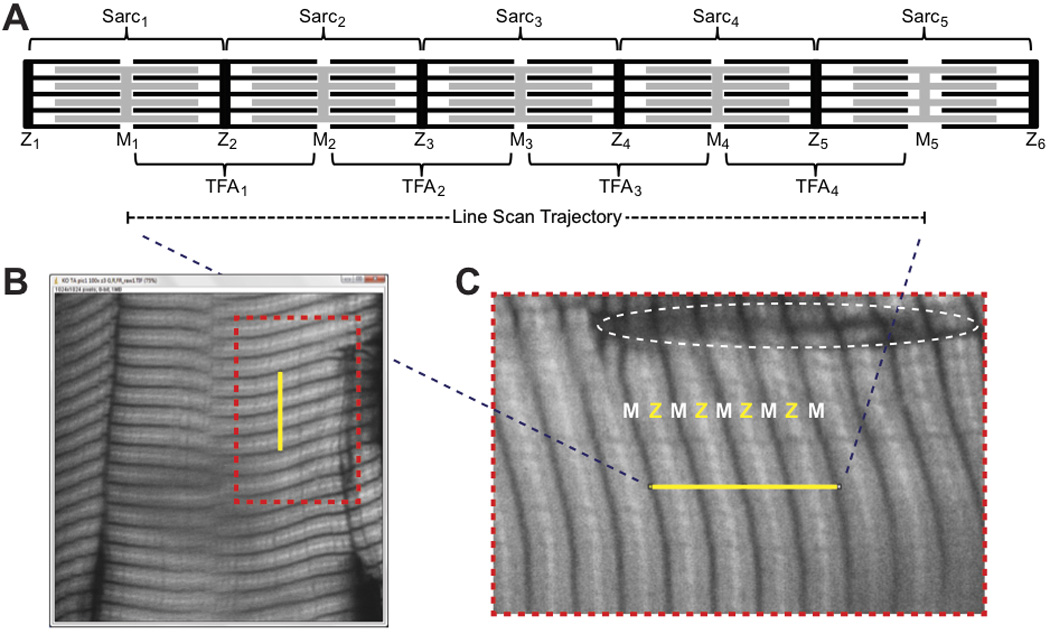
(A) Schematic of striated myofibril organization. Sarcomeres, consisting of interdigitating thin filaments (black) and thick filaments (grey) extend from one Z-line to the next and can vary in length with the degree of stretch (e.g., see sarcomere at far right). Thick filaments are symmetric around the M-line in each sarcomere, while thin filament arrays extend with opposite polarity outward from individual Z-lines and do not change length with stretch. For DDecon analysis of thin filament lengths, line scan trajectories should be drawn from M-line to M-line, traversing multiple thin filament arrays. (B) A 12-µm-thick cryosection of mouse tibialis anterior muscle was stained with rhodamine-phalloidin, and a single optical section was collected on a Bio-Rad Radiance 2100 confocal microscope using a Nikon 100× oil objective (NA 1.4) and digital zoom of 3. The yellow line (denoting a line scan position) was drawn across four thin filament arrays, from M-line to M-line. (C) Zoomed-in view of the region in (B) demarcated by the orange dotted lines, showing correspondence between F-actin-free regions of phalloidin-stained skeletal muscle (H-zones) that coincide with the locations of the M-lines in the center of the thick filaments at the ends of the line scan trajectory. Dotted oval indicates a region of tissue damage with poor staining quality that should not be used to collect line scans. Z, Z-line; M, M-line; Sarc, sarcomere; TFA, thin filament array.
Line scan analysis
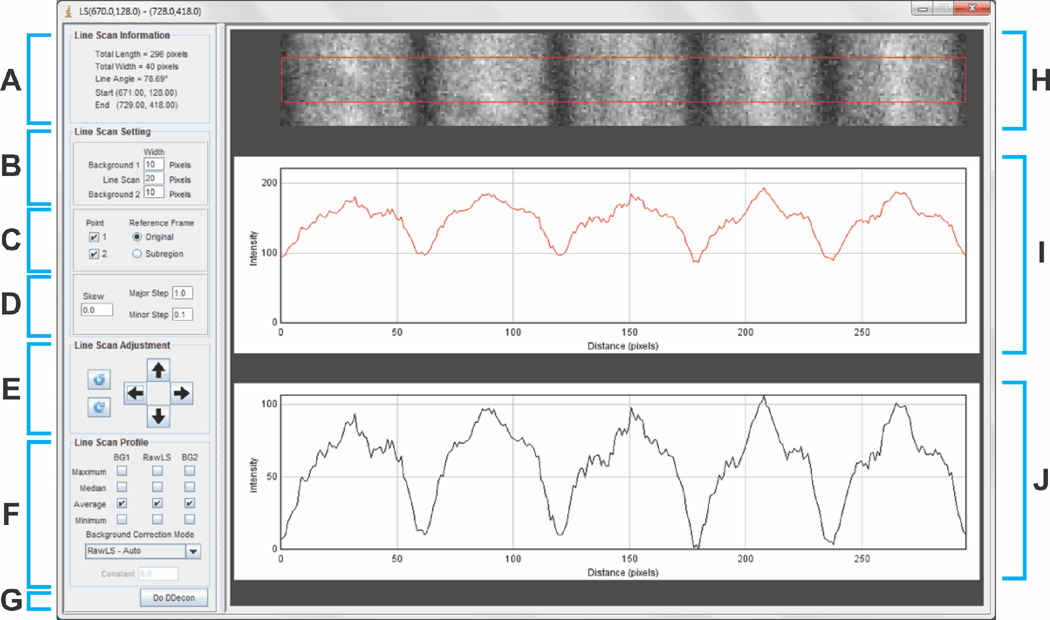
To analyze a line scan, click the “Line Scan Analysis” button on the Launch screen, which will bring the user to the Line Scan screen (Fig. 3). The purpose of this screen is to make fine adjustments to the line scan and subtract nonspecific background fluorescence. The top panel depicts a rectangular region of the fluorescence image containing the myofibril region comprising the line scan selected in the Launch screen, as well as adjacent rectangular regions (which can be used for background correction when imaging isolated myofibrils) (Fig. 3A,H). The user can refine the length, angular orientation, and position of the line scan region using an array of fine adjustment tools (Fig. 3B–E), which are described in detail in the User Manual in the Supplemental Data. Background correction can be specified using an automated algorithm or as the maximum, minimum, median, or average value of the fluorescent intensity of an adjacent region containing no myofibrils (Fig. 3F), with the overall goal of setting the minimum non-background signal intensity of the line scan as close to 0 as possible. The image of the region used for the line scan, adjacent regions (Fig. 3H), and both the uncorrected (Fig. 3I) and background-corrected (Fig. 3J) line scan fluorescence intensity profiles can be directly observed in the Line Scan screen (Fig. 3H–J). Note that excessive background-correction can erode the signal-to-noise ratio of the line scan data. While there is no minimum signal-to-noise ratio required for DDecon analysis, care should be taken to avoid overly aggressive background subtraction, as explained in depth in the User Manual. When the background-corrected line scan is optimized to the user’s specifications, press the “Do DDecon” button to continue (Fig. 3G).
Figure 3. Line Scan screen.
(A) The “Line Scan Information” panel provides metadata about the selected line scan, including length and width of the bounded area surrounding the line scan in which fluorescence intensity is integrated, angle of the line with respect to the reference frame of the image, and start and end coordinates. (B-D) The “Line Scan Setting” panel allows the user to refine the line scan. (B) Adjustment of line scan width as well as width of adjacent regions used for background correction (only used when imaging isolated myofibrils; note that adjacent regions are not suitable for background subtraction in cryosections since they contain the adjacent myofibrils in the tissue). (C) Fixation of start- and endpoints with respect to the original reference frame or the reference frame of the line scan when using the “Line Scan Adjustment” panel. (D) Data parameters for angular skew and major and minor steps for making adjustments to the line scan when using the “Line Scan Adjustment” panel. (E) The “Line Scan Adjustment” panel allows the user to move the line scan up, down, left, and right, as well as rotate the line scan clockwise or counterclockwise. This is useful when the myofibril image is not perfectly horizontally aligned, and is not in the middle of the image in the vertical dimension. (F) The “Line Scan Profile” panel allows selection of background-correction algorithm. Automated background correction, which is based on the average of the local minima along the line scan, is the default selection, and is optimal for line scans of myofibrils from muscle cryosections (as shown here in H). However, when imaging isolated myofibrils, background correction can also be performed based on subtraction of the maximum, minimum, median, or average value of the fluorescence intensity of one or both adjacent regions parallel to the individual myofibril (not shown). (G) The “Do DDecon” button allows the user to proceed to the “DDecon Analysis” screen and perform model fitting. (H) Image region of a myofibril in a cryosection from which fluorescence intensity is integrated (bounded by red box) to create a fluorescence intensity profile of the line scan. Regions above and below the red box are adjacent rectangular regions used for background correction (only used when imaging isolated myofibrils). (I-J) Line scan fluorescence intensity profiles (I) before or (J) after background correction.
Model fitting
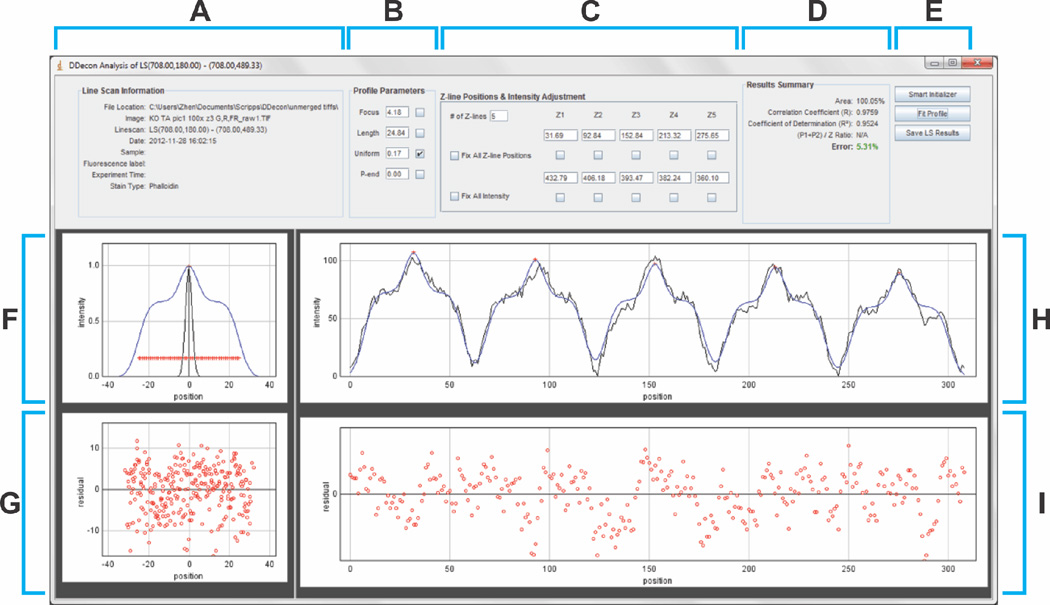
To perform DDecon analysis on a background-corrected line scan, click the “Do DDecon” button on the Line Scan screen, which will bring the user to the DDecon Analysis screen (Fig. 4). The purpose of this screen is to fit model thin filament profiles—based on the distribution of actual structural components of sarcomeres (Table 1)—to the background-corrected experimental line scan data. Line scan metadata and the associated model profile (referred to as “Stain Type”) are shown at the upper-left of this screen (Fig. 4A; Table 1).
Figure 4. DDecon Analysis screen.
(A) The “Line Scan Information” panel provides metadata about the selected line scan, including file name and location, line scan start- and endpoints, and other information entered in the Launch screen. (B) The “Profile Parameters” panel allows adjustment of the focus, thin filament length, uniform fluorescence, and pointed-end fluorescence of the model profile. (C) The “Z-line Positions & Intensity Adjustment” panel allows adjustment of the number, position, and fluorescence intensity of the center of each model profile (Z-line), corresponding to the number of thin filament arrays traversed by the line scan. (D) The “Results Summary” panel shows statistics describing the goodness-of-fit of the model profile to the experimental data. Most commonly reported statistics include the correlation coefficient (R), coefficient of determination (R2), and percent error. (E) The “Smart Initializer” automatically generates an initial guess for the model fit, the “Fit Profile” button performs the iterative fitting procedure, and the “Save LS Results” button saves the results of the fitting procedure to a tab-delimited text file. (F) Plot of a single model profile representing a computed fluorescence intensity profile for a Z line probe (black line) and a computed fluorescence intensity profile for a probe, such as phalloidin, that labels the entire length of the thin filament in (blue line) (see Table 1 for available model profiles). Red crosshairs indicate coordinates whose abscissas are used for length calculations. (G) Residual plot depicting all model profiles vs. best-fit fluorescence intensity differences for all the thin filament arrays across a line scan, superimposed on one another. (H) Line scan fluorescence intensity profile (black) with best-fit of model profiles (blue) for 5 thin filament arrays. (I) Residual plot depicting model profile vs. best-fit fluorescence intensity differences for the 5 thin filament arrays across the line scan.
To generate an initial guess for the model fit, the user can manually adjust the model profile parameters (focus, thin filament length, uniform fluorescence, or pointed-end fluorescence of the model profile; Fig. 4B), as well as the number of repeats of the model profile and relative intensity of the center of each repeat (i.e., Z-lines; Fig. 4C). These model profile parameters for thin filament architecture were originally described by Littlefield & Fowler (Littlefield & Fowler, 2002) and are further elaborated in the User Manual in the Supplemental Data. Moreover, the value of any parameter can be fixed by checking the adjacent checkbox. Each model profile can be moved by clicking and dragging the red crosshairs (shown in Fig. 4H) such that the model profile coincides with the line scan as much as possible. Adjustments to the model profile are updated in real time and are depicted in the graphs below (Fig. 4F,H).
Statistics reflecting the accuracy of the model fit to the line scan are also updated in real time and are reported as the correlation coefficient (R), coefficient of determination (R2), and percent error (Fig. 4D). In general, percent errors for fitting line scans of phalloidin staining are <5%, with correspondingly low residuals, while percent errors for fitting line scans of immunostaining are typically in the range of ~5–10%, with somewhat larger residuals (also see Discussion). The accuracy of the model fit can also be assessed from residual plots, which display the difference between the line scan and the model fit as a function of position (Fig. 4G,I). If the y-coordinates data points on the residual plot are randomly dispersed, then the user can conclude that the model fit is appropriate to the line scan data; otherwise, systematic discrepancies are present. We have also developed a “Smart Initializer” tool to automatically generate an initial guess for the model fit (Fig. 4E), but utilization of this feature is up to the user’s discretion. This tool is useful for reducing the number of iterations required to achieve the best fit when analyzing line scans from samples with excellent sample preservation and robust signal-to-noise fluorescence signals.
After the initial guess for the model fit has been attained, press the “Fit Profile” button to initiate iterative model fitting (Fig. 4E). The plugin will perform iterative DDecon analysis until an optimal fit is generated, converging to a fit that minimizes the percent error and maximizes the correlation coefficient and coefficient of determination. The number of iterations will vary depending on the accuracy of the initial guess. Line scan metadata, optimal fit parameters, and associated statistics can be saved to a tab-delimited text file by pressing the “Save LS Results” button. (The complete outputs of the tab-delimited text file, along with sample data, are listed for one line scan of a phalloidin-stained myofibril in Table 2.) Data from multiple line scans can be saved to a single text file, creating a database of all line scans associated with an experimental sample. Tab-delimited text files generated by the DDecon plugin can be imported into Microsoft Excel (or an equivalent program) for data reduction and subsequent analysis. Thin filament lengths can be converted from pixels into µm using the appropriate conversion factor for the image.
Table 2.
Sample outputs exported from a DDecon fit of a background-corrected line scan collected from phalloidin-stained skeletal muscle
| Parameter | Value |
|---|---|
| Date & Time | 4/21/2016 3:00:28 PM |
| Profile | Phalloidin |
| File Name | sample.tif |
| Line Scan Name | LS(462,436) - (706,520) |
| Experiment | demo |
| Focus* | 4.193710078 |
| Length** | 24.85130961 |
| Uniform | 0.434746994 |
| P-end | 0 |
| # of Z-lines*** | 4 |
| Area | 100.1246393 |
| Corr. Coeff. | 0.989345189 |
| R-sq | 0.978803903 |
| (P1+P2)/Z Ratio | N/A |
| Error | 4.100704314 |
| Avg. Z-Z Dist. | 64.00194931 |
| Z2-Z1* | 64.53602617 |
| Z3-Z2* | 63.6828949 |
| Z4-Z3* | 63.78692685 |
| Z5-Z4 | - |
| Z6-Z5 | - |
| Z7-Z6 | - |
| Z8-Z7 | - |
| Z9-Z8 | - |
| Z10-Z9 | - |
| Z11-Z10 | - |
The “Focus” value reflects the breadth of the Gaussian spread of light and, in turn, the curvature of the fitted profile.
The “Length” value is the length of a single thin filament, in pixels.
For a line scan that traverses n Z-lines (in this case n=4), n-1 Z-Z distances will be reported (in this case 3).
All lengths and distances are in pixels. Values can be converted from pixels into µm using an appropriate conversion factor based on the image magnification.
DISCUSSION
DDecon is an efficient and objective technique to achieve super-resolution precision when analyzing the spatial features of periodic fluorescence signals, such as the breadths of individual striations and spacings between successive striations in striated myofibrils. The workflow described above demonstrates how to measure thin filament length as half the breadth of a phalloidin-stained thin filament array—an approach that is convenient due to the widespread commercial availability of fluorescent phalloidin derivatives. However, the DDecon plugin also enables measurement of thin filament length as the half the distance between pointed-end tropomodulin striations measured across the Z-line (“P-end” profile; Table 1) (Castillo et al., 2009, Gokhin et al., 2012, Gokhin et al., 2010, Gokhin et al., 2015, Gokhin et al., 2014b). Thin filament lengths determined from tropomodulin striations are likely more accurate than lengths determined from phalloidin staining, since the fluorescence peak position of a tropomodulin striation with respect to the Z-line is independent of the extent of stretch. Conversely, the fluorescence intensity of the F-actin-free “trough” in the H-zone of phalloidin-stained muscle can vary considerably with stretch, with greater apparent background signal due to increased overlap of fluorescent signals from each half-sarcomere. Greater background intensity leads to decreased half-maximal fluorescence intensity of the phalloidin model profile used for length determination (Table 1), emphasizing the importance of using stretched muscle preparations or myofibrils for DDecon analyses. Despite the limitations of DDecon analysis of phalloidin-stained muscle, DDecon is still superior to conventional “point-and-click” methods, which are unreliable for accurately locating the half-maximal fluorescence intensity of phalloidin signal decay at the periphery of a phalloidin-stained thin filament array.
The multitude of model profiles in the DDecon plugin enables accurate measurement of positions of diverse structural features in striated muscle. For example, in addition to measuring thin filament lengths based on distances of tropomodulin from Z lines, the “P-end” profile can also be applied to determine distances from the Z line of other protein elements at or near the pointed ends, such as leiomodin-3 (Lmod3) and the N-terminus of nebulin (Gokhin et al., 2015). DDecon also contains a model profile for measuring sarcomere length as the distance between successive α-actinin striations (“Z-line” profile; Table 1), which can then be applied to numerous other Z-line protein elements, such as cypher/ZASP, muscle LIM protein/MLP, telethonin/Tcap, myopalladin, desmin, the N-terminus of titin, and the C-terminus of nebulin (Clark et al., 2002). An additional profile is available for measuring thin filament length, sarcomere length, and pointed- vs. barbed-end intensity of exogenous, fluorescent-labeled actin incorporating into myofibrils (“Early Labeled Actin” profile; Table 1) (Littlefield et al., 2001). Finally, while DDecon was developed to analyze the cytoarchitecture of striated muscle, the algorithm is applicable to any fluorescence image with a periodic fluorescence signal. For example, the “Z-line” profile could be used to measure the average distances between cell boundaries along different axes in an epithelial sheet during morphogenesis (Lecuit, 2005, Zallen & Blankenship, 2008), and to determine the thickness of the hexagonally packed cortical fiber cells in the ocular lens, which are stacked into regular columns with periodic spacing between successive broad sides (Kuszak et al., 2004). Dimensions of other biological structures with stereotypic cytoarchitecture—such as actomyosin bundles and intestinal microvilli—could also be analyzed with DDecon.
Unlike conventional “point-and-click” methods, DDecon enables objective quantification of distances and lengths while minimizing user bias. However, several caveats should be considered when using DDecon: (1) Accuracy of distances and lengths determined by DDecon depends on the quality of the image and position of the line-scan. Inadequate tissue relaxation or stretching prior to microscopy, insufficient blocking of nonspecific sites, inadequate penetration or off-target binding of primary antibodies, image acquisition errors/artifacts, and inaccurate selection of image regions for line-scan analysis will all compromise the accuracy of the results (i.e., the axiom of “garbage in, garbage out”). (2) The accuracy of a DDecon-based model fit, as determined by the goodness-of-fit statistics (see Workflow), should always be confirmed before using the resulting data. DDecon’s iterative fitting algorithm will still converge to a fit even if the data are noisy or the initial guess is poor; however, this fit will be erroneous and characterized by poor goodness-of-fit statistics. With fluorescent phalloidin staining, percent errors of <5% with correspondingly low residuals can be readily achieved due to the excellent specificity and affinity of phalloidin-F-actin binding. With immunostaining, “good” percent errors are somewhat higher (~5–10%), with corresponding larger residuals, due to nonspecific background signals and off-target antibody binding. (3) Heavy sampling is recommended to achieve the statistical power required to detect subtle changes in thin filament length (e.g., using sample size of >50 line scans for mouse muscle and >100 line scans for human muscle). Observed changes in thin filament length due to experimental perturbations, developmental alterations, or disease states tend to be subtle (10–25%) (Bang et al., 2006, Gokhin et al., 2015, Ochala et al., 2012, Ottenheijm et al., 2009, Pappas et al., 2015, Witt et al., 2006, Yuen et al., 2014), and rigorous sampling of myofibrils within and across experimental samples is required to detect subtle differences that achieve statistical significance. Detecting even subtler length changes (<5%) may require a single-molecule, non-diffraction-limited imaging approach.
Supplementary Material
Acknowledgments
We gratefully acknowledge Zhen Ren for updating and refining the DDecon interface, Roberta Nowak for assistance with preparation of figures, and the members of the Fowler laboratory for helpful editing of this manuscript. This work was supported by NIH/NIAMS grant K99-AR066534 (to D.S.G.), NIH/NHLBI grant R01-HL083464 (to V.M.F.), and NIH/NIAMS grant P30-AR061303 to the Imaging Core of the San Diego Skeletal Muscle Research Center (to V.M.F.).
REFERENCES
- Ao X, Lehrer SS. Phalloidin unzips nebulin from thin filaments in skeletal myofibrils. J Cell Sci. 1995;108(Pt 11):3397–3403. doi: 10.1242/jcs.108.11.3397. [DOI] [PubMed] [Google Scholar]
- Bang ML, Li X, Littlefield R, Bremner S, Thor A, Knowlton KU, Lieber RL, Chen J. Nebulin-deficient mice exhibit shorter thin filament lengths and reduced contractile function in skeletal muscle. J Cell Biol. 2006;173:905–916. doi: 10.1083/jcb.200603119. [DOI] [PMC free article] [PubMed] [Google Scholar]
- Castillo A, Nowak R, Littlefield KP, Fowler VM, Littlefield RS. A nebulin ruler does not dictate thin filament lengths. Biophys J. 2009;96:1856–1865. doi: 10.1016/j.bpj.2008.10.053. [DOI] [PMC free article] [PubMed] [Google Scholar]
- Clark KA, McElhinny AS, Beckerle MC, Gregorio CC. Striated muscle cytoarchitecture: an intricate web of form and function. Annu Rev Cell Dev Biol. 2002;18:637–706. doi: 10.1146/annurev.cellbio.18.012502.105840. [DOI] [PubMed] [Google Scholar]
- Fowler VM, Sussmann MA, Miller PG, Flucher BE, Daniels MP. Tropomodulin is associated with the free (pointed) ends of the thin filaments in rat skeletal muscle. J Cell Biol. 1993;120:411–420. doi: 10.1083/jcb.120.2.411. [DOI] [PMC free article] [PubMed] [Google Scholar]
- Gokhin DS, Dubuc EA, Lian KQ, Peters LL, Fowler VM. Alterations in thin filament length during postnatal skeletal muscle development and aging in mice. Front Physiol. 2014a;5:375. doi: 10.3389/fphys.2014.00375. [DOI] [PMC free article] [PubMed] [Google Scholar]
- Gokhin DS, Fowler VM. A two-segment model for thin filament architecture in skeletal muscle. Nat Rev Mol Cell Biol. 2013;14:113–119. doi: 10.1038/nrm3510. [DOI] [PMC free article] [PubMed] [Google Scholar]
- Gokhin DS, Kim NE, Lewis SA, Hoenecke HR, D'Lima DD, Fowler VM. Thin-filament length correlates with fiber type in human skeletal muscle. Am J Physiol Cell Physiol. 2012;302:C555–C565. doi: 10.1152/ajpcell.00299.2011. [DOI] [PMC free article] [PubMed] [Google Scholar]
- Gokhin DS, Lewis RA, McKeown CR, Nowak RB, Kim NE, Littlefield RS, Lieber RL, Fowler VM. Tropomodulin isoforms regulate thin filament pointed-end capping and skeletal muscle physiology. J Cell Biol. 2010;189:95–109. doi: 10.1083/jcb.201001125. [DOI] [PMC free article] [PubMed] [Google Scholar]
- Gokhin DS, Ochala J, Domenighetti AA, Fowler VM. Tropomodulin1 directly controls thin filament length in both wild-type and tropomodulin4-deficient skeletal muscle. Development. 2015;142:4351–4362. doi: 10.1242/dev.129171. [DOI] [PMC free article] [PubMed] [Google Scholar]
- Gokhin DS, Tierney MT, Sui Z, Sacco A, Fowler VM. Calpain-mediated proteolysis of tropomodulin isoforms leads to thin filament elongation in dystrophic skeletal muscle. Mol Biol Cell. 2014b;25:852–865. doi: 10.1091/mbc.E13-10-0608. [DOI] [PMC free article] [PubMed] [Google Scholar]
- Gregorio CC, Weber A, Bondad M, Pennise CR, Fowler VM. Requirement of pointed-end capping by tropomodulin to maintain actin filament length in embryonic chick cardiac myocytes. Nature. 1995;377:83–86. doi: 10.1038/377083a0. [DOI] [PubMed] [Google Scholar]
- Kolb J, Li F, Methawasin M, Adler M, Escobar YN, Nedrud J, Pappas CT, Harris SP, Granzier H. Thin filament length in the cardiac sarcomere varies with sarcomere length but is independent of titin and nebulin. J Mol Cell Cardiol. 2016 doi: 10.1016/j.yjmcc.2016.04.013. in press. [DOI] [PMC free article] [PubMed] [Google Scholar]
- Kuszak JR, Zoltoski RK, Sivertson C. Fibre cell organization in crystalline lenses. Exp Eye Res. 2004;78:673–687. doi: 10.1016/j.exer.2003.09.016. [DOI] [PubMed] [Google Scholar]
- Lecuit T. Adhesion remodeling underlying tissue morphogenesis. Trends Cell Biol. 2005;15:34–42. doi: 10.1016/j.tcb.2004.11.007. [DOI] [PubMed] [Google Scholar]
- Li F, Buck D, De Winter J, Kolb J, Meng H, Birch C, Slater R, Escobar YN, Smith JE, 3rd, Yang L, Konhilas J, Lawlor MW, Ottenheijm C, Granzier HL. Nebulin deficiency in adult muscle causes sarcomere defects and muscle-type-dependent changes in trophicity: novel insights in nemaline myopathy. Hum Mol Genet. 2015;24:5219–5233. doi: 10.1093/hmg/ddv243. [DOI] [PMC free article] [PubMed] [Google Scholar]
- Lieber RL, Loren GJ, Friden J. In vivo measurement of human wrist extensor muscle sarcomere length changes. J Neurophysiol. 1994;71:874–881. doi: 10.1152/jn.1994.71.3.874. [DOI] [PubMed] [Google Scholar]
- Littlefield R, Almenar-Queralt A, Fowler VM. Actin dynamics at pointed ends regulates thin filament length in striated muscle. Nat Cell Biol. 2001;3:544–551. doi: 10.1038/35078517. [DOI] [PubMed] [Google Scholar]
- Littlefield R, Fowler VM. Measurement of thin filament lengths by distributed deconvolution analysis of fluorescence images. Biophys J. 2002;82:2548–2564. doi: 10.1016/S0006-3495(02)75598-7. [DOI] [PMC free article] [PubMed] [Google Scholar]
- Ochala J, Gokhin DS, Iwamoto H, Fowler VM. Pointed-end capping by tropomodulin modulates actomyosin crossbridge formation in skeletal muscle fibers. FASEB J. 2014;28:408–415. doi: 10.1096/fj.13-239640. [DOI] [PMC free article] [PubMed] [Google Scholar]
- Ochala J, Gokhin DS, Pénisson-Besnier I, Quijano-Roy S, Monnier N, Lunardi J, Romero NB, Fowler VM. Congenital myopathy-causing tropomyosin mutations induce thin filament dysfunction via distinct physiological mechanisms. Hum Mol Genet. 2012;21:4473–4485. doi: 10.1093/hmg/dds289. [DOI] [PMC free article] [PubMed] [Google Scholar]
- Ottenheijm CA, Buck D, de Winter JM, Ferrara C, Piroddi N, Tesi C, Jasper JR, Malik FI, Meng H, Stienen GJ, Beggs AH, Labeit S, Poggesi C, Lawlor MW, Granzier H. Deleting exon 55 from the nebulin gene induces severe muscle weakness in a mouse model for nemaline myopathy. Brain. 2013;136:1718–1731. doi: 10.1093/brain/awt113. [DOI] [PMC free article] [PubMed] [Google Scholar]
- Ottenheijm CA, Witt CC, Stienen GJ, Labeit S, Beggs AH, Granzier H. Thin filament length dysregulation contributes to muscle weakness in nemaline myopathy patients with nebulin deficiency. Hum Mol Genet. 2009;18:2359–2369. doi: 10.1093/hmg/ddp168. [DOI] [PMC free article] [PubMed] [Google Scholar]
- Pappas CT, Mayfield RM, Henderson C, Jamilpour N, Cover C, Hernandez Z, Hutchinson KR, Chu M, Nam KH, Valdez JM, Wong PK, Granzier HL, Gregorio CC. Knockout of Lmod2 results in shorter thin filaments followed by dilated cardiomyopathy and juvenile lethality. Proc Natl Acad Sci U S A. 2015;112:13573–13578. doi: 10.1073/pnas.1508273112. [DOI] [PMC free article] [PubMed] [Google Scholar]
- Rassier DE, MacIntosh BR, Herzog W. Length dependence of active force production in skeletal muscle. J Appl Physiol (1985) 1999;86:1445–1457. doi: 10.1152/jappl.1999.86.5.1445. [DOI] [PubMed] [Google Scholar]
- Ringkob TP, Swartz DR, Greaser ML. Light microscopy and image analysis of thin filament lengths utilizing dual probes on beef, chicken, and rabbit myofibrils. J Anim Sci. 2004;82:1445–1453. doi: 10.2527/2004.8251445x. [DOI] [PubMed] [Google Scholar]
- Robinson TF, Winegrad S. The measurement and dynamic implications of thin filament lengths in heart muscle. J Physiol. 1979;286:607–619. doi: 10.1113/jphysiol.1979.sp012640. [DOI] [PMC free article] [PubMed] [Google Scholar]
- Schermelleh L, Heintzmann R, Leonhardt H. A guide to super-resolution fluorescence microscopy. J Cell Biol. 2010;190:165–175. doi: 10.1083/jcb.201002018. [DOI] [PMC free article] [PubMed] [Google Scholar]
- Sussman MA, Baque S, Uhm CS, Daniels MP, Price RL, Simpson D, Terracio L, Kedes L. Altered expression of tropomodulin in cardiomyocytes disrupts the sarcomeric structure of myofibrils. Circ Res. 1998;82:94–105. doi: 10.1161/01.res.82.1.94. [DOI] [PubMed] [Google Scholar]
- Toomre D, Bewersdorf J. A new wave of cellular imaging. Annu Rev Cell Dev Biol. 2010;26:285–314. doi: 10.1146/annurev-cellbio-100109-104048. [DOI] [PubMed] [Google Scholar]
- Traeger L, Goldstein MA. Thin filaments are not of uniform length in rat skeletal muscle. J Cell Biol. 1983;96:100–103. doi: 10.1083/jcb.96.1.100. [DOI] [PMC free article] [PubMed] [Google Scholar]
- Walker SM, Schrodt GR. I segment lengths and thin filament periods in skeletal muscle fibers of the Rhesus monkey and the human. Anat Rec. 1974;178:63–81. doi: 10.1002/ar.1091780107. [DOI] [PubMed] [Google Scholar]
- Witt CC, Burkart C, Labeit D, McNabb M, Wu Y, Granzier H, Labeit S. Nebulin regulates thin filament length, contractility, and Z-disk structure in vivo. EMBO J. 2006;25:3843–3855. doi: 10.1038/sj.emboj.7601242. [DOI] [PMC free article] [PubMed] [Google Scholar]
- Yuen M, Sandaradura SA, Dowling JJ, Kostyukova AS, Moroz N, Quinlan KG, Lehtokari VL, Ravenscroft G, Todd EJ, Ceyhan-Birsoy O, Gokhin DS, Maluenda J, Lek M, Nolent F, Pappas CT, Novak SM, D'Amico A, Malfatti E, Thomas BP, Gabriel SB, Gupta N, Daly MJ, Ilkovski B, Houweling PJ, Davidson AE, Swanson LC, Brownstein CA, Gupta VA, Medne L, Shannon P, Martin N, Bick DP, Flisberg A, Holmberg E, Van den Bergh P, Lapunzina P, Waddell LB, Sloboda DD, Bertini E, Chitayat D, Telfer WR, Laquerriere A, Gregorio CC, Ottenheijm CA, Bonnemann CG, Pelin K, Beggs AH, Hayashi YK, Romero NB, Laing NG, Nishino I, Wallgren-Pettersson C, Melki J, Fowler VM, MacArthur DG, North KN, Clarke NF. Leiomodin-3 dysfunction results in thin filament disorganization and nemaline myopathy. J Clin Invest. 2014;124:4693–4708. doi: 10.1172/JCI75199. [DOI] [PMC free article] [PubMed] [Google Scholar]
- Zallen JA, Blankenship JT. Multicellular dynamics during epithelial elongation. Semin Cell Dev Biol. 2008;19:263–270. doi: 10.1016/j.semcdb.2008.01.005. [DOI] [PMC free article] [PubMed] [Google Scholar]
- Zhukarev V, Sanger JM, Sanger JW, Goldman YE, Shuman H. Distribution and orientation of rhodamine-phalloidin bound to thin filaments in skeletal and cardiac myofibrils. Cell Motil Cytoskeleton. 1997;37:363–377. doi: 10.1002/(SICI)1097-0169(1997)37:4<363::AID-CM7>3.0.CO;2-5. [DOI] [PubMed] [Google Scholar]
Associated Data
This section collects any data citations, data availability statements, or supplementary materials included in this article.


