

Abstract
We report the Simons Genome Diversity Project (SGDP) dataset: high quality genomes from 300 individuals from 142 diverse populations. These genomes include at least 5.8 million base pairs that are not present in the human reference genome. Our analysis reveals key features of the landscape of human genome variation, including that the rate of accumulation of mutations has accelerated by about 5% in non-Africans compared to Africans since divergence. We show that the ancestors of some pairs of present-day human populations were substantially separated by 100,000 years ago, well before the archaeologically attested onset of behavioral modernity. We also demonstrate that indigenous Australians, New Guineans and Andamanese do not derive substantial ancestry from an early dispersal of modern humans; instead, their modern human ancestry is consistent with coming from the same source as that in other non-Africans.
To obtain a complete picture of human diversity, it is necessary to sequence the genomes of many individuals from diverse locations. To date, the largest whole-genome sequencing survey, the 1000 Genomes Project, analyzed 26 populations of European, East Asian, South Asian, American, and sub-Saharan African ancestry1. However, this and most other sequencing studies have focused on demographically large populations. Such studies tend to ignore smaller populations that are also important for understanding human diversity. In addition, many of these studies have sequenced genomes to only 4–6-fold coverage. Here, we report the Simons Genome Diversity Project (SGDP): deep genome sequences of 300 individuals from 142 populations chosen to span much of human genetic, linguistic, and cultural variation (Supplementary Data Table 1).
Data set and catalog of novel variants
We sequenced the samples to an average coverage of 43-fold (range 34–83 fold) at Illumina Ltd.; almost all samples (278) were prepared using the same PCR-free library preparation2. We aligned reads to the human reference genome hs37d5/hg19 using BWA-MEM (BWA-0.7.12)3 (Supplementary Information section 1). We genotyped each sample separately using the Genome Analysis Toolkit (GATK)4, with a modification to eliminate bias toward genotypes matching the reference (Supplementary Information section 1). We developed a filtering procedure that generates a sample-specific mask. At “filter level 1” which we recommend for most analyses, we retain an average of 2.13 Gb of sequence per sample and identify 34.4 million single nucleotide polymorphisms (SNPs) and 2.1 million insertion/deletion polymorphisms (indels) (Supplementary Information section 2). We have made the GATK-processed data available in a file small enough to download by FTP, along with software to analyze these data (Supplementary Information section 3). The SGDP dataset highlights the incompleteness of current catalogs of human variation, with the fraction of heterozygous positions not discovered by the 1000 Genomes Project being 11% in the KhoeSan and 5% in New Guineans and Australians (Extended Data Fig. 1; Supplementary Data Table 1). We used FermiKit5 to map short reads against each other, store the assemblies in a compressed form that retains all the information required for polymorphism discovery and analysis, and identified SNPs by comparing against the human reference. We find that FermiKit has comparable sensitivity and specificity to GATK for SNP discovery and genotyping, and is more accurate for indels (Supplementary Information section 4). FermiKit also identified 5.8 Mb of contigs that are present in the SGDP but absent in the human reference genome presumably because they are deleted there; these contigs which we have made publicly available can be used as “decoys” to improve read mapping (Supplementary Information section 5). Finally, we called copy number variants6 and used lobSTR7,8 to genotype 1.6 million short tandem repeats (STRs) (Supplementary Information section 6). The high quality of the STR genotypes (r2=0.92 to capillary sequencing calls) is evident from their accurate reconstruction of population relationships, even for difficult-to-genotype mononucleotide repeats (Extended Data Fig. 2).
The structure of human genetic diversity
To obtain an overview of population relationships, we carried out ADMIXTURE9 (Extended Data Fig. 3) and principal component analysis10 (Extended Data Fig. 4a). We also built neighbor-joining trees based on pairwise divergence per nucleotide (Fig. 1a) and FST (Extended Data Fig. 4b) whose topologies are consistent with previous findings that the deepest splits among human populations are among Africans. We computed heterozygosity – the proportion of diallelic genotypes per base pair – and recapitulate previous findings that the highest genetic diversity is found in sub-Saharan Africa and that there is a much lower ratio of X-to-autosome diversity in non-Africans than in Africans (Fig. 1b)11. A surprise is that African “Pygmy” hunter-gatherers have reduced X-to-autosome diversity ratios relative to all other sub-Saharan Africans. This pattern remains even after we remove the third of chromosome X known to be subject to the strongest natural selection, suggesting that the finding is driven by demographic history rather than by natural selection (Supplementary Information section 7). It has been suggested that the reduced X-to-autosome heterozygosity ratio in non-Africans is due to ongoing male-driven admixture11,12. Male non-Pygmy admixture into Pygmies is well-documented13,14, so this process could explain these findings.
Figure 1. Genetic variation in the SGDP.

A: Neighbor-joining tree of relationships based on pairwise divergence. B: Plot of autosomal heterozygosity against the X-to-autosome heterozygosity ratio, showing the reduction in this ratio in non-Africans and Pygmies. C: Estimate of Neanderthal ancestry with a heatmap scale of 0–3%. D: Estimate of Denisovan ancestry with a heatmap scale of 0–0.5% to bring out subtle differences in mainland Eurasia (Oceanian groups with as much as 5% Denisovan ancestry are saturated in bright red).
Comparisons of ancient to present-day human genomes have shown that all non-Africans today possess Neanderthal ancestry15 with more in eastern non-Africans16,17, and that Australo-Melanesians and to a lesser extent other eastern non-Africans possess Denisovan ancestry18–20. However, these studies only analyzed genomes from a handful of populations. We computed statistics informative about Neanderthal and Denisovan ancestry and provide a fine-scale view of these ancestry distributions worldwide (Fig. 1c,d; Supp. Data Table 1; Supplementary Information section 8). We do not detect any population with a higher proportion of Neanderthal ancestry than is present in East Asians. However, we do find suggestive evidence of an excess of Denisovan ancestry in some South Asians compared to other Eurasians. This signal may not have been detected before because earlier surveys of archaic introgression largely excluded South Asians (Fig. 1d; Supp. Data Table 1).
The time course of human population separation
We studied demographic history by leveraging the fact that variation across the genome in divergent sites per base pair can be used to reconstruct population size changes and separations. We used the Pairwise Sequential Markovian Coalescent (PSMC)21 to reconstruct population size changes ,and the multiple sequentially Markovian coalescent22 (MSMC) to study the time course of population separations. We infer that the population ancestral to all present day humans began to develop substructure at least two hundred thousand years ago (kya), which is most apparent when comparing the ancestors of some present-day African hunter-gatherers (southern African KhoeSan and central African Mbuti Pygmies) and other populations (Fig. 2a). However, it is also clear that this substructure developed slowly, as all pairs of present-day populations including African hunter-gatherer share a substantial subset of their ancestors as recently as a hundred thousand years ago23–26. Quoting the time at which MSMC infers that more than 50% (25–75%) of lineages for a pair of populations are descended from the same ancestral population, we estimate that non-Africans separated substantially from KhoeSan 131 (82–173) kya and almost as anciently from the Mbuti around 112 (67–171) kya. Within Africa (Fig. 2a–b), we infer that the Yoruba separated substantially from the KhoeSan 87 (58–120) kya; from the Mbuti 56 (32–85) kya; and from the Dinka 19 (9–25) kya. We estimate a relatively rapid 21 (21–36) kya separation of northern and southern KhoeSan24,27 potentially reflecting isolation since the last glacial maximum; and 38 (27–44) kya separation between western (Biaka) and eastern (Mbuti) Pygmies, confirming very old substructure between these two central African hunter gatherer groups28. Outside Africa, the most ancient structure dates to around 50 kya (Fig. 2c) during or shortly after the deepest part of the shared non-African bottleneck 40–60 kya, consistent with the archaeological evidence of the dispersal of modern humans into Eurasia during this period. We are not confident about the estimates of the date of separation of Australians, New Guineans and Andamanese from other populations because we find that these inferences change depending on the computational method we use for phasing, likely due to these populations not being represented in the 1000 Genomes haploid genome reference panel (Supplementary Information section 9). We caution that the date estimates also do not take into account uncertainty about the true value of the human mutation rate, which could plausibly be 30% higher or lower than the point estimate we use29.
Figure 2. Cross-coalescence rates and effective population sizes for selected population pairs.

A–C: Cross-coalescence rates as a function of time in thousands of years ago (kya) estimated using MSMC, with four haplotypes per pair. In each subfigure legend, we give the point estimate of the date at which 25%, 50% and 75% of lineages in the pair of populations have coalesced into a common ancestral population. We generated these plots using data phased with the 1000 Genomes reference panel (method PS1 described in supplementary information section 9), but only show pairs of populations for which the cross-coalescence rates are relatively insensitive to the phasing approach. A: Selected African cross-coalescence rates. B: Central African rainforest hunter-gatherer cross-coalescence rates. C: Ancient non-African cross coalescence rates. D–F: Effective population sizes inferred using PSMC, using one diploid genome per population, for the same populations that we used in A–C.
Early modern human dispersals contributed little to non-African populations
There is intense debate about whether present-day Australians, New Guineans and Asian “Negrito” populations are descended from the same source population as mainland Eurasians, or whether they also derive some ancestry from an early, independent dispersal of modern humans into Asia30–32. To explore this scenario rigorously, we fit an admixture graph33—a phylogenetic tree incorporating mixture events—to the allele frequency correlations among Neanderthals, Denisovans, Upper Paleolithic Europeans, East Asians, New Guineans, Australians, and Andamanese. We obtain a good fit to the data if we include known Neanderthal and Denisovan introgression and model all modern human ancestry in New Guineans, Australians and Andamanese as part of an eastern clade together with mainland East Asians (Supplementary Information section 11; Fig. 3). Furthermore, when we manually introduce a deeply diverging modern human lineage contributing ancestry to Australians, New Guineans, and Andamanese (or when we repeat the analysis in a model without Andamanese), no position or proportion of the deep lineage improves the fit. If this putative source population branched off the main lineage leading to non-Africans more than about 10–20 ky prior to the separation of European and East Asian ancestors, we obtain an upper bound of a few percent for the possible contribution to Australians and New Guineans (Fig. 3 inset; Supplementary Information section 11). These results are at odds with an inference of substantial early dispersal ancestry in a previous analysis of an Australian genome32; however, that study used a less complete model that, notably, did not include the known Denisovan admixture into Australo-Melanesians18. The findings for Australians are also unlikely to be due to some unusual feature of the individuals we sequenced, as when we compared three different Australian samples for which there is published genome-wide data, they are all consistent with descending from a common homogeneous population since separation from New Guineans (Supplementary Information section 10). These results are not in conflict with skeletal and archaeological evidence of an early modern human presence outside of Africa30,34, as early migrations could have occurred but not contributed substantially to present-day populations. The possibility of populations that once flourished but did not contribute substantially to living groups is especially plausible now that ancient DNA from the ~45 kya Ust’-Ishim29 and the ~40 kya Oase 1 individuals35 has documented directly their existence.
Figure 3. Present-day populations have negligible ancestry from an early dispersal of modern humans out of Africa.

Best-fitting admixture graph model of relationships among Australians, New Guineans, Andamanese and other diverse populations. Present-day populations are shown in blue, ancient samples in red, and select inferred ancestral nodes in green. Dotted lines indicate admixture events, all of which involve archaic humans. All f-statistic relationships are accurately fit to within 2.1 standard errors. (Inset) Results of adding putative early dispersal admixture to the graph model for different assumptions about when the early lineage split off. We specify the split time in terms of the genetic drift above the "Non-African" node, with 0.01 units of drift representing on the order of ten thousand years. The (approximate) model likelihood is maximized with zero early dispersal ancestry, and no more than a few percent is consistent with the data.
More mutation accumulation in non-Africans than in Africans
The SGDP data provide an opportunity to compare the rates at which mutations have accumulated across populations. We restricted our analyses to samples for which our genotypes are likely to be most reliable (this included restricting to samples which were all processed in the same way), and we used the highest level of filtering (“level 9”) (Supplementary Information section 7). We pooled samples by region to increase power, and for all pairs of regions, computed the expected number of positions where, if we picked a random chromosome from both, region A would mismatch chimpanzee and region B would be identical to chimpanzee (or vice versa). If the rate of accumulation of mutation has been the same since the two populations diverged, these numbers are expected to be equal36. However, when we compute the ratio of mutations on one lineage or the other since separation, we find a subtle (average of 0.5%) but significant excess of mutations in non-Africans relative to sub-Saharan Africans (3.3<|Z|<9.4 standard errors from zero; Extended Data Table 1). Because any difference must reflect events since non-African / African population divergence which is a less than a tenth of average genetic divergence (Fig. 2a), this implies a greater difference in mutation accumulation rates since population divergence (~5%). We were concerned that these results might be biased by the fact that the human genome reference sequence is more closely related to non-Africans than to Africans, or by higher levels of heterozygosity in Africans, as both these issues could make detection of divergent sites in Africans more difficult. However, we replicated the findings after remapping to chimpanzee, which is equally distant to all present populations, and after restricting analyses to the X chromosome in males (males only have a single X chromosome, and so this procedure avoids bias due to different error rates in detecting heterozygous genotypes in populations with different rates of heterozygosity) (Extended Data Fig. 5). These observations are most likely to be explained by acceleration in the rate of mutation accumulation in non-Africans, since the same signal appears in comparisons to sub-Saharan Africans related in different ways to non-Africans (Extended Data Table 1). It is known that the rate of CCT>CTT mutations differs across human populations. However, this particular mutation class was found to be enriched relative to Africans in Europeans but not in East Asians, and thus cannot explain our signal37. One of several possible explanations for these findings is a decrease in the generation interval in non-Africans compared to Africans since separation38.
No evidence for species-wide sweeps since the origin of anatomically modern humans
We finally used the SGDP dataset to address the hypothesis that the widespread appearance of modern human behavior in the archaeological record after ~50 kya was driven by one or a few changes in neurological genes that swept through the population shortly before this time39. We first applied the 3P-CLR method40 to search for locations in the genome with low allele frequency differentiation between KhoeSan and other modern humans, combined with high differentiation between modern and archaic (Neanderthal and Denisovan) humans, as might be expected from a selective sweep in the ancestors of all modern humans (Supplementary Information section 12) (Extended Data Figure 6). We found no strong outlier signals, although a caveat is that our scan has imperfect power and we could not apply it to filtered sections of the genome. We also applied the PSMC method21 to estimate the average time since the most recent common ancestor (TMRCA) of individuals’ two chromosomes in the genomic regions within the largest 3P-CLR peaks (38 peaks corresponding the top 0.1%). In none of the regions did we find that the great majority of all pairs of modern humans are inferred to share a common ancestor <100 kya, as would be expected for a sweep just prior to ~50 kya years ago (Supplementary Data Table 2).
As a second approach to scanning for species-wide selective sweeps, we applied the PSMC to infer TMRCA for SGDP samples across the entire genome. This analysis found no regions where the great majority of pairs of human genomes are inferred to share a common ancestor <100 kya (the largest fraction seen anywhere in the genome is 68%; Extended Data Fig. 7).
Taken together, these results do not rule out the possibility that genetic changes played a meaningful role in the changes in human behaviors after 50 kya; for example, changing selection can produce shifts in the frequencies of pre-existing mutations to bring a population to a new and advantageous set-point for a phenotype as occurred in the case of height differences between northern and southern Europeans41. For polygenic selection, however, genetics is not the creative force, but instead is responding to selection pressures imposed by new environmental conditions or lifestyles. Thus, our results provide evidence against a model in which one or a few mutations were responsible for the rapid developments in human behavior in the last 50 kya. Instead, changes in lifestyles due to cultural innovation or exposure to new environments are likely to have been the ultimate driving forces behind the rapid transformations in human behavior that became evident after 50 ky42,43.
Extended Data
Extended Data Figure 1. Heatmap of fraction of heterozygous sites missed in the 1000 Genomes Project.

For each sample, we examine all heterozygous sites passing filter level 1, and compute the fraction included as known polymorphisms in the 1000 Genomes Project.
Extended Data Figure 2. Worldwide variation in human short tandem repeats.

A: Mean STR length is reported as the average of the length difference (in base pairs) from the GRCh37 reference for each genotype. Bubble area scales with the number of calls compared at each point. B: and C: show the first two principal components after performing principal component analysis on tetranucleotide and homopolymer genotypes, respectively. Colors represent the region of origin of each sample. D: Pairwise FST values between populations computed using only SNPs vs. using combined SNP+STR loci. E: Block jackknife standard errors for the SNP vs. SNP+STR FST analysis. The red dashed lines give the best-fit line, described by the formula in red. The black dashed line denotes the diagonal.
Extended Data Figure 3. ADMIXTURE analysis.

We carried out unsupervised ADMIXTURE 1.239,44 analysis over the 300 SGDP individuals in 20 replicates with randomly chosen initial seeds, varying the number of ancestral populations between K=2 and K=12 and using default 5-fold cross-validation (--cv flag). We used genotypes of at least filter level 1, and restricted analysis to sites where at least two individuals carried the variant allele (as singleton variants are non-informative for population clustering). After further filtering sites with at least 99% completeness and performing linkage-disequilibrium based pruning in PLINK 1.945,46 with parameters (--indep-pairwise 1000 100 0.2), a total of 482,515 single nucleotide polymorphisms remained. This figure shows the highest likelihood replicate for each value of K. We found that log likelihood monotonically increases with K, while the value K=5 minimizes cross-validation error (not shown). The solution at K=5 corresponds to major continental groups (Sub-Saharan Africans, Oceanians, East Asians, Native Americans, and West Eurasians), but we show the full range of K here as they illustrate finer-scale population structure that may be useful to users of the data.
Extended Data Figure 4. Principal component analysis and neighbor joining tree.

A: Principal component analysis. B: Neighbor-joining tree based on FST values for all populations with at least two samples.
Extended Data Figure 5. Fewer accumulated mutations in Africans than in non-Africans confirmed by mapping to chimpanzee.

We compute a statistic D(Population A, Population B, Chimp), measuring the difference in the rate of matching to chimpanzee in Population A compared to Population B. The evidence of mismatching to chimpanzee is seen when we restrict to the male X chromosome to eliminate possible effects due to differences in heterozygosity across populations, and map to the chimpanzee genome which is phylogenetically symmetrically related to all present-day humans. We find that in 78 randomly chosen Population A = African and Population B = non-African pairs of males, transversion substitutions show no consistent skew from zero, but transition substitutions do.
Extended Data Figure 6. 3P-CLR scan for positive selection.

The red line denotes the 99.9% quantile cutoff. The genes in the top 5 regions are labeled. A: Scan for selection on the San terminal branch. B: Scan for selection on the non-San terminal branch. C: Scan for selection on the ancestral modern human branch.
Extended Data Figure 7. Scan for genomic locations where the great majority of present-day humans share a recent common ancestor.
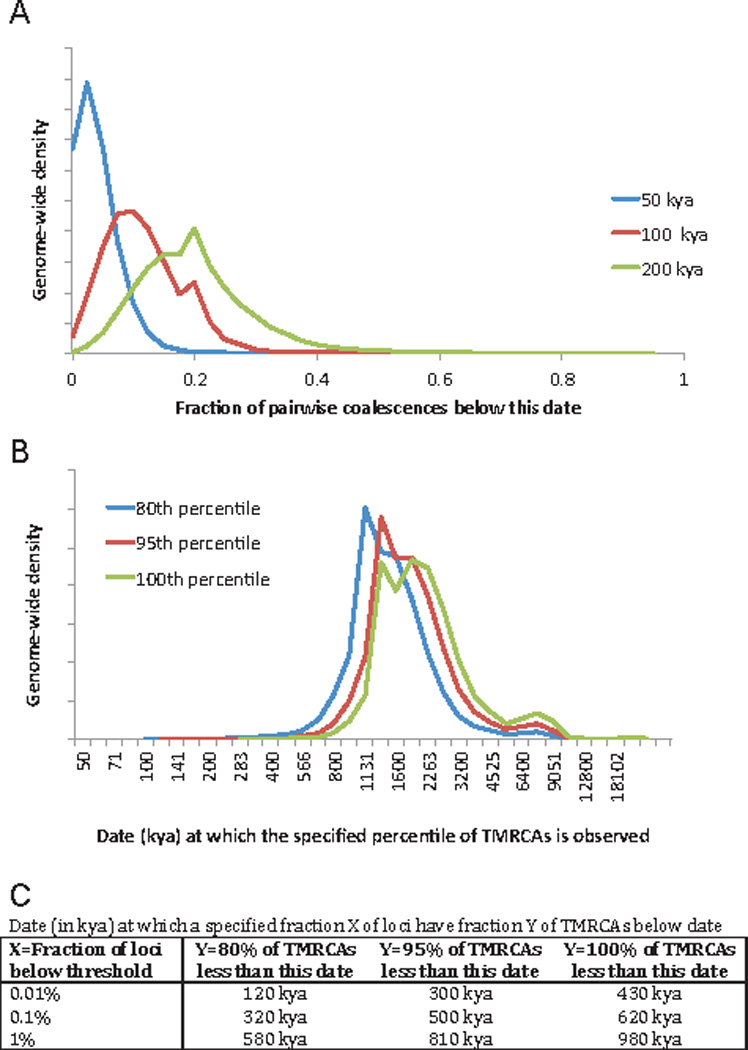
We carried out PSMC analysis on 40 pairs of haploid genomes chosen to sample some of the most deeply divergent present-day human lineages. We recorded the time since the most recent common ancestor (TMRCA) at each position, and rescaled to obtain an estimate of absolute time (Supplementary Information section 12). A: Distribution across the genome of the fraction of TMRCAs below specified date cutoffs. For the 100 kya cutoff, the maximum fraction observed anywhere in the genome is 68%. B: Distribution across the genome of the date T at which specified fractions of sample pairs are inferred to have a TMRCA less than T. C: Percentile points of the cumulative distribution function of B.
Extended Data Table 1.
Fewer accumulated mutations in Africans than in non-Africans.
| All autosomes |
All X chromosome |
Lowest B quintile |
Highest B quintile |
||||||
|---|---|---|---|---|---|---|---|---|---|
| Population A | Population B | D×100 | Z | D×100 | Z | D×100 | Z | D×100 | Z |
| Khoesan | Oceania | −0.35 | −8.2 | −0.70 | −2.7 | −0.68 | −6.4 | −0.14 | −1.7 |
| Africa | America | −0.33 | −9.4 | −0.73 | −2.8 | −0.65 | −7.3 | −0.18 | −2.6 |
| Khoesan | WestEurasia | −0.30 | −7.5 | −0.68 | −3.1 | −0.63 | −6.3 | −0.17 | −2.1 |
| Africa | Oceania | −0.29 | −8.5 | −0.66 | −3.2 | −0.55 | −6.6 | −0.07 | −1.0 |
| Africa | WestEurasia | −0.25 | −8.5 | −0.66 | −3.1 | −0.49 | −6.4 | −0.11 | −1.8 |
| Khoesan | SouthAsia | −0.24 | −6.0 | −0.56 | −2.7 | −0.61 | −6.3 | −0.11 | −1.4 |
| Africa | EastAsia | −0.20 | −6.6 | −0.65 | −2.5 | −0.42 | −5.2 | −0.10 | −1.5 |
| Africa | CentralAsiaSiberia | −0.20 | −6.2 | −0.55 | −2.2 | −0.48 | −6.3 | −0.05 | −0.7 |
| Pygmy | WestEurasia | −0.19 | −4.8 | −0.46 | −1.4 | −0.43 | −4.6 | −0.04 | −0.5 |
| Africa | SouthAsia | −0.18 | −6.4 | −0.50 | −2.0 | −0.46 | −6.3 | −0.03 | −0.5 |
| CentralAsiaSiberia | Oceania | −0.13 | −3.9 | −0.15 | −0.6 | −0.09 | −1.1 | −0.03 | −0.4 |
| Pygmy | SouthAsia | −0.13 | −3.3 | −0.38 | −1.1 | −0.38 | −4.2 | 0.02 | 0.2 |
| EastAsia | Oceania | −0.13 | −4.1 | 0.00 | 0.0 | −0.17 | −2.1 | 0.04 | 0.6 |
| Khoesan | Pygmy | −0.10 | −2.6 | −0.14 | −0.4 | −0.16 | −1.6 | −0.12 | −1.5 |
| SouthAsia | WestEurasia | −0.08 | −4.3 | −0.20 | −1.2 | −0.05 | −1.0 | −0.10 | −2.7 |
| CentralAsiaSiberia | WestEurasia | −0.06 | −2.2 | −0.16 | −0.8 | −0.01 | −0.2 | −0.09 | −1.6 |
| EastAsia | WestEurasia | −0.06 | −2.1 | −0.00 | −0.0 | −0.08 | −1.0 | −0.02 | −0.3 |
| CentralAsiaSiberia | EastAsia | −0.00 | −0.2 | −0.18 | −1.1 | 0.07 | 1.2 | −0.08 | −1.8 |
| Africa | Pygmy | −0.00 | −0.1 | −0.06 | −0.2 | 0.03 | 0.4 | −0.06 | −0.8 |
| EastAsia | SouthAsia | 0.02 | 0.7 | 0.22 | 1.7 | −0.04 | −0.7 | 0.08 | 1.7 |
| CentralAsiaSiberia | SouthAsia | 0.02 | 0.7 | 0.05 | 0.3 | 0.02 | 0.4 | −0.00 | −0.0 |
| America | Oceania | 0.03 | 0.9 | 0.11 | 0.4 | 0.10 | 1.1 | 0.13 | 1.7 |
| Oceania | WestEurasia | 0.08 | 2.3 | −0.03 | −0.1 | 0.10 | 1.1 | −0.04 | −0.6 |
| Africa | Khoesan | 0.10 | 2.9 | 0.17 | 0.7 | 0.23 | 2.6 | 0.07 | 1.0 |
| America | WestEurasia | 0.11 | 3.6 | 0.11 | 0.4 | 0.19 | 2.2 | 0.08 | 1.3 |
| CentralAsiaSiberia | Pygmy | 0.14 | 3.4 | 0.32 | 0.9 | 0.43 | 4.5 | −0.04 | −0.4 |
| Oceania | SouthAsia | 0.14 | 4.8 | 0.22 | 0.9 | 0.13 | 1.7 | 0.04 | 0.7 |
| EastAsia | Pygmy | 0.15 | 3.6 | 0.49 | 1.4 | 0.37 | 3.9 | 0.04 | 0.5 |
| America | EastAsia | 0.18 | 5.9 | 0.09 | 0.3 | 0.28 | 3.6 | 0.11 | 1.8 |
| America | CentralAsiaSiberia | 0.18 | 6.2 | 0.34 | 1.7 | 0.23 | 2.9 | 0.18 | 3.1 |
| America | SouthAsia | 0.18 | 6.4 | 0.34 | 1.5 | 0.22 | 3.0 | 0.18 | 3.1 |
| Oceania | Pygmy | 0.24 | 5.4 | 0.46 | 1.3 | 0.45 | 4.6 | 0.02 | 0.2 |
| CentralAsiaSiberia | Khoesan | 0.25 | 6.0 | 0.57 | 2.9 | 0.64 | 6.3 | 0.09 | 1.1 |
| EastAsia | Khoesan | 0.25 | 6.2 | 0.68 | 3.2 | 0.59 | 5.9 | 0.14 | 1.7 |
| America | Pygmy | 0.26 | 5.9 | 0.58 | 1.6 | 0.58 | 5.7 | 0.09 | 1.0 |
| America | Khoesan | 0.37 | 8.7 | 0.76 | 3.3 | 0.77 | 7.3 | 0.22 | 2.5 |
We compute a statistic D(Population A, Population B, Chimp), measuring the difference in the rate of matching to chimpanzee in Population A compared to Population B. For all the autosomes, we observe highly significant signals (3.3<|Z|<9.4) of excess mismatching to chimpanzee in non-Africans compared to Africans, using a standard error from a Block Jackknife. We highlight |D|>0.002 in blue, and |Z|>3 in yellow. The deviations from zero are greatest in subsets of the genome where the time since two populations split comprises a relatively larger fraction of the total genetic divergence time between the populations; this is the direction expected from a mutation accumulation change since divergence. Compared to all the autosomes as a baseline, a least squares fit indicate that the deviations are 2.2-times higher on chromosome X, 2.0 times higher in the quintile of lowest B-statistic (closest to functionally important regions), and 0.43 times as high in the quintile of lowest B-statistic (furthest from functional regions).
Supplementary Material
Acknowledgments
We thank the volunteers who donated samples. We thank Hélène Blanche, Nicole Boivin, Howard Cann (deceased), Evan Eichler, Hank Greely, Michael Petraglia, Kay Prüfer, Alan Rogers, Matthias Steinrücken, Udo Stenzel and Peter Sudmant for comments, critiques, discussions, or advice on assembling samples. The sequencing was funded by the Simons Foundation (SFARI 280376) and the U.S. National Science Foundation (BCS-1032255). I.M. was supported by a Long Term Fellowship grant LT001095/2014 from the Human Frontier Science program. P.S. was supported by the Wenner-Gren foundation and the Swedish Research Council (VR grant 2014-453). T.W and M.G were supported by an NIJ grant 2014-DN-BX-K089. Y.E. was supported by a Career Award at the Scientific Interface from the Burroughs Wellcome Fund and by NIJ grant 2014-DN-BX-K089. T.K. was supported by ERC Starting Investigator grant FP7 - 261213. R.S. received support from Russian Foundation for Basic Research (#15-04-02543). S.D. received support from Russian Foundation for Basic Research (#16-34-00599). R.K., E.K., and S.L. were supported by the Russian Foundation for Basic Research (11-04-00725-a). E.B. was supported by the Russian Scientific Fund (16-14-10354) and by the Russian Foundation for Basic Research (16-06-00303). O.B. was supported by the Russian Foundation for Basic Research (16-06-00364). D.M.B., H.S., E.M., R.V., and M.M. were supported by Institutional Research Funding from the Estonian Research Council IUT24-1 and by the European Regional Development Fund (European Union) through the Centre of Excellence in Genomics to Estonian Biocentre and University of Tartu. D.C. was supported by the Spanish MINECO grant CGL-44351-P. L.B.J. and W.S.W were supported by NIH grant GM59290. S.A.T. was supported by NIH grants 5DP1ES022577 05, 1R01DK104339-01, and 1R01GM113657-01. C.T.S. was supported by The Wellcome Trust grant 098051. C.M.B. was supported by NSF grants 0924726 and 1153911. K.T was supported by CSIR Network Project grant (GENESIS: BSC0121). J.P.S. and Y.S.S. were supported in part by an NIH grant R01-GM094402, and a Packard Fellowship for Science and Engineering. G.R. J.K and S.P. were funded by the Max Planck Society. N.P. and D.R. were supported by NIH grant GM100233 and D.R. is a Howard Hughes Medical Institute investigator.
Footnotes
Author information and data access: Raw data for 277 genomes are available through the EBI European Nucleotide Archive under accession numbers PRJEB9586 and ERP010710. For the remaining 23 genomes, the informed consent documentation is not consistent with fully public data release; data for these genomes can be accessed through a password protected link by researchers who send S.M. and D.R. a signed letter containing the following language: “With regards to the non-public samples from the Simons Genome Diversity Project, I agree that: (a) I will not secondarily distribute the data to anyone, (b) I will not post it publicly, (c) I will make no attempt to connect the genetic data to personal identifiers for the samples, (d) I will not use the data for any commercial purposes.” The identifiers for these 23 genomes are BR_Kashmiri_Pandit-1, BR_Kharia-1, BR_Kurumba-1, BR_Mala-1, BR_Onge-1, BR_Onge-2, S_Igbo-1, S_Igbo-2, S_Kongo-2, S_Lemande-1, S_Lemande-2, S_Chipewyan-1, S_Chipewyan-2, S_Cree-1, S_Cree-2, S_Nahua-1, S_Nahua-2, T_Sherpa-2, T_Tibetan-1, T_Tibetan-2 and T_Sherpa-1, and are designated by code “Y” in the seventh column of Supplementary Data Table 1. Compact versions of the SGDP dataset and software for accessing it are available at (http://genetics.med.harvard.edu/reichlab/Reich_Lab/Datasets.html).
The authors declare competing financial interests. Ugur Hodoglugil is employed by NextBio, a division of Illumina Ltd.
Readers are welcome to comment on the online version of the paper.
Author contributions: S.M., Y.E., Y.S.S., S.P., J.K., N.P. and D.R. supervised the study. S.N., N.R., C.G., G.P., F.B., G.D., I.G.R., A.R.J., P.D., D.M.B., C.M.B., C.C., T.H., A.M.-E., O.L.P., E.B., O.B., S.K.-Y., H.S., D.T., L.Y., C.T.-S., Y.X., M.S.A., A.R.-L., C.B., A.D.R., C.J., E.B.S., E.M., J.P., R.V., B.M.H., U.H., R.W.M., A.S., G.S., J.T.S.W., R.K., E.K., S.L., G.A., D.C., M.H., T.K., W.K., C.W., D.L., M.B., L.B.J., S.A.T., W.S.W., M.M., S.D., R.S., L.S., K.T. and D.R. assembled samples. S.M., H.L., M.L., I.M., M.G., F.R., J.P.S. M.Z., N.C., A.T., P.S., I.L., S.S., Q.F., G.R., Y.S., N.P. and D.R. performed analyses. S.M., H.L., M.L., I.M., M.G., F.R., M.Z., N.P. and D.R. wrote the manuscript with help from all co-authors.
References
- 1.Genomes Project C, et al. An integrated map of genetic variation from 1,092 human genomes. Nature. 2012;491:56–65. doi: 10.1038/nature11632. [DOI] [PMC free article] [PubMed] [Google Scholar]
- 2. https://support.illumina.com/content/dam/illumina-marketing/documents/services/FastTrackServices_Methods_Tech_Note.pdf.
- 3.Li H, Durbin R. Fast and accurate long-read alignment with Burrows-Wheeler transform. Bioinformatics. 2010;26:589–595. doi: 10.1093/bioinformatics/btp698. [DOI] [PMC free article] [PubMed] [Google Scholar]
- 4.McKenna A, et al. The Genome Analysis Toolkit: a MapReduce framework for analyzing next-generation DNA sequencing data. Genome research. 2010;20:1297–1303. doi: 10.1101/gr.107524.110. [DOI] [PMC free article] [PubMed] [Google Scholar]
- 5. http://arxiv.org/abs/1504.06574.
- 6.Sudmant PH, et al. Global diversity, population stratification, and selection of human copy number variation. Science. 2015 doi: 10.1126/science.aab3761. [DOI] [PMC free article] [PubMed] [Google Scholar]
- 7.Gymrek M, Erlich Y. Profiling short tandem repeats from short reads. Methods Mol Biol. 2013;1038:113–135. doi: 10.1007/978-1-62703-514-9_7. [DOI] [PubMed] [Google Scholar]
- 8.Gymrek M, Golan D, Rosset S, Erlich Y. lobSTR: A short tandem repeat profiler for personal genomes. Genome research. 2012;22:1154–1162. doi: 10.1101/gr.135780.111. [DOI] [PMC free article] [PubMed] [Google Scholar]
- 9.Alexander DH, Novembre J, Lange K. Fast model-based estimation of ancestry in unrelated individuals. Genome research. 2009;19:1655–1664. doi: 10.1101/gr.094052.109. [DOI] [PMC free article] [PubMed] [Google Scholar]
- 10.Patterson N, Price AL, Reich D. Population structure and eigenanalysis. PLoS genetics. 2006;2:e190. doi: 10.1371/journal.pgen.0020190. [DOI] [PMC free article] [PubMed] [Google Scholar]
- 11.Keinan A, Mullikin JC, Patterson N, Reich D. Accelerated genetic drift on chromosome X during the human dispersal out of Africa. Nature genetics. 2009;41:66–70. doi: 10.1038/ng.303. [DOI] [PMC free article] [PubMed] [Google Scholar]
- 12.Keinan A, Reich D. Can a sex-biased human demography account for the reduced effective population size of chromosome X in non-Africans? Molecular biology and evolution. 2010;27:2312–2321. doi: 10.1093/molbev/msq117. [DOI] [PMC free article] [PubMed] [Google Scholar]
- 13.Verdu P, et al. Sociocultural behavior, sex-biased admixture, and effective population sizes in Central African Pygmies and non-Pygmies. Molecular biology and evolution. 2013;30:918–937. doi: 10.1093/molbev/mss328. [DOI] [PMC free article] [PubMed] [Google Scholar]
- 14.Joiris DV. THE FRAMEWORK OF CENTRAL AFRICAN HUNTER-GATHERERS AND NEIGHBOURING SOCIETIES. African Study Monographs. 2003;(Suppl.28):57–79. x. [Google Scholar]
- 15.Green RE, et al. A draft sequence of the Neandertal genome. Science. 2010;328:710–722. doi: 10.1126/science.1188021. [DOI] [PMC free article] [PubMed] [Google Scholar]
- 16.Meyer M, et al. A High-Coverage Genome Sequence from an Archaic Denisovan Individual. Science. 2012 doi: 10.1126/science.1224344. [DOI] [PMC free article] [PubMed] [Google Scholar]
- 17.Wall JD, et al. Higher levels of neanderthal ancestry in East Asians than in Europeans. Genetics. 2013;194:199–209. doi: 10.1534/genetics.112.148213. [DOI] [PMC free article] [PubMed] [Google Scholar]
- 18.Reich D, et al. Genetic history of an archaic hominin group from Denisova Cave in Siberia. Nature. 2010;468:1053–1060. doi: 10.1038/nature09710. [DOI] [PMC free article] [PubMed] [Google Scholar]
- 19.Prufer K, et al. The complete genome sequence of a Neanderthal from the Altai Mountains. Nature. 2014;505:43–49. doi: 10.1038/nature12886. [DOI] [PMC free article] [PubMed] [Google Scholar]
- 20.Skoglund P, Jakobsson M. Archaic human ancestry in East Asia. Proceedings of the National Academy of Sciences of the United States of America. 2011;108:18301–18306. doi: 10.1073/pnas.1108181108. [DOI] [PMC free article] [PubMed] [Google Scholar]
- 21.Li H, Durbin R. Inference of human population history from individual whole-genome sequences. Nature. 2011;475:493–496. doi: 10.1038/nature10231. [DOI] [PMC free article] [PubMed] [Google Scholar]
- 22.Schiffels S, Durbin R. Inferring human population size and separation history from multiple genome sequences. Nature genetics. 2014;46:919–925. doi: 10.1038/ng.3015. [DOI] [PMC free article] [PubMed] [Google Scholar]
- 23.Gronau I, Hubisz MJ, Gulko B, Danko CG, Siepel A. Bayesian inference of ancient human demography from individual genome sequences. Nature genetics. 2011;43:1031–1034. doi: 10.1038/ng.937. [DOI] [PMC free article] [PubMed] [Google Scholar]
- 24.Schlebusch CM, et al. Genomic variation in seven Khoe-San groups reveals adaptation and complex African history. Science. 2012;338:374–379. doi: 10.1126/science.1227721. [DOI] [PMC free article] [PubMed] [Google Scholar]
- 25.Veeramah KR, et al. An early divergence of KhoeSan ancestors from those of other modern humans is supported by an ABC-based analysis of autosomal resequencing data. Molecular biology and evolution. 2012;29:617–630. doi: 10.1093/molbev/msr212. [DOI] [PMC free article] [PubMed] [Google Scholar]
- 26.Labuda D, Zietkiewicz E, Yotova V. Archaic lineages in the history of modern humans. Genetics. 2000;156:799–808. doi: 10.1093/genetics/156.2.799. [DOI] [PMC free article] [PubMed] [Google Scholar]
- 27.Pickrell JK, et al. The genetic prehistory of southern Africa. Nature communications. 2012;3:1143. doi: 10.1038/ncomms2140. [DOI] [PMC free article] [PubMed] [Google Scholar]
- 28.Patin E, et al. Inferring the demographic history of African farmers and pygmy hunter-gatherers using a multilocus resequencing data set. PLoS genetics. 2009;5:e1000448. doi: 10.1371/journal.pgen.1000448. [DOI] [PMC free article] [PubMed] [Google Scholar]
- 29.Fu Q, et al. Genome sequence of a 45,000-year-old modern human from western Siberia. Nature. 2014;514:445–449. doi: 10.1038/nature13810. [DOI] [PMC free article] [PubMed] [Google Scholar]
- 30.Groucutt HS, et al. Rethinking the dispersal of Homo sapiens out of Africa. Evol Anthropol. 2015;24:149–164. doi: 10.1002/evan.21455. [DOI] [PMC free article] [PubMed] [Google Scholar]
- 31.Reyes-Centeno H, Hubbe M, Hanihara T, Stringer C, Harvati K. Testing modern human out-of-Africa dispersal models and implications for modern human origins. Journal of human evolution. 2015 doi: 10.1016/j.jhevol.2015.06.008. [DOI] [PubMed] [Google Scholar]
- 32.Rasmussen M, et al. An Aboriginal Australian genome reveals separate human dispersals into Asia. Science. 2011;334:94–98. doi: 10.1126/science.1211177. [DOI] [PMC free article] [PubMed] [Google Scholar]
- 33.Patterson NJ, et al. Ancient Admixture in Human History. Genetics. 2012 doi: 10.1534/genetics.112.145037. [DOI] [PMC free article] [PubMed] [Google Scholar]
- 34.Liu W, et al. The earliest unequivocally modern humans in southern China. Nature. 2015;526:696–699. doi: 10.1038/nature15696. [DOI] [PubMed] [Google Scholar]
- 35.Fu Q, et al. An early modern human from Romania with a recent Neanderthal ancestor. Nature. 2015 doi: 10.1038/nature14558. [DOI] [PMC free article] [PubMed] [Google Scholar]
- 36.Do R, et al. No evidence that selection has been less effective at removing deleterious mutations in Europeans than in Africans. Nature genetics. 2015;47:126–131. doi: 10.1038/ng.3186. [DOI] [PMC free article] [PubMed] [Google Scholar]
- 37.Harris K. Evidence for recent, population-specific evolution of the human mutation rate. Proceedings of the National Academy of Sciences of the United States of America. 2015;112:3439–3444. doi: 10.1073/pnas.1418652112. [DOI] [PMC free article] [PubMed] [Google Scholar]
- 38.Segurel L, Wyman MJ, Przeworski M. Determinants of mutation rate variation in the human germline. Annu Rev Genomics Hum Genet. 2014;15:47–70. doi: 10.1146/annurev-genom-031714-125740. [DOI] [PubMed] [Google Scholar]
- 39.Klein RG, Edgar B. The dawn of human culture. Wiley; 2002. [Google Scholar]
- 40.Racimo F. Testing for Ancient Selection Using Cross-population Allele Frequency Differentiation. Genetics. 2015 doi: 10.1534/genetics.115.178095. [DOI] [PMC free article] [PubMed] [Google Scholar]
- 41.Turchin MC, et al. Evidence of widespread selection on standing variation in Europe at height-associated SNPs. Nature genetics. 2012;44:1015–1019. doi: 10.1038/ng.2368. [DOI] [PMC free article] [PubMed] [Google Scholar]
- 42.McBrearty S, Brooks AS. The revolution that wasn't: a new interpretation of the origin of modern human behavior. Journal of human evolution. 2000;39:453–563. doi: 10.1006/jhev.2000.0435. [DOI] [PubMed] [Google Scholar]
- 43.Renfrew C. Prehistory : the making of the human mind. Modern library paperback edn. Modern Library; 2009. [Google Scholar]
- 44.Alexander DH, Lange K. Enhancements to the ADMIXTURE algorithm for individual ancestry estimation. BMC bioinformatics. 2011;12:246. doi: 10.1186/1471-2105-12-246. [DOI] [PMC free article] [PubMed] [Google Scholar]
- 45.Chang C, et al. Second-generation PLINK: rising to the challenge of larger and richer datasets. GigaScience. 2015;4:7. doi: 10.1186/s13742-015-0047-8. [DOI] [PMC free article] [PubMed] [Google Scholar]
- 46.Purcell S, et al. PLINK: a tool set for whole-genome association and population-based linkage analyses. American journal of human genetics. 2007;81:559–575. doi: 10.1086/519795. [DOI] [PMC free article] [PubMed] [Google Scholar]
Associated Data
This section collects any data citations, data availability statements, or supplementary materials included in this article.