SUMMARY
Melanoma is the deadliest form of commonly encountered skin cancers because of its rapid progression towards metastasis1,2. Although metabolic reprogramming is tightly associated with tumor progression, whether metabolic regulatory circuits affect metastatic processes is poorly understood. PGC1α is a transcriptional coactivator that promotes mitochondrial biogenesis, protects against oxidative stress3, and reprograms melanoma metabolism to influence drug sensitivity and survival4,5. Here, we provide data to indicate that PGC1α suppresses melanoma metastasis, acting through a pathway distinct from its bioenergetic functions. Elevated PGC1α expression inversely correlates with vertical growth in human melanomas. PGC1α silencing makes nonmetastatic melanoma cells highly invasive and conversely, PGC1α reconstitution suppresses metastasis. Within populations of melanoma cells, there is a marked heterogeneity in PGC1α levels, which predicts their inherent high or low metastatic capacity. Mechanistically, PGC1α directly increases transcription of ID2, which in turn binds to and inactivates the transcription factor TCF4. Inactive TCF4 causes downregulation of metastasis-related genes including integrins that are known to influence invasion and metastasis6–8. Inhibition of BRAFV600E using vemurafenib9, independently of its cytostatic effects, suppresses metastasis by acting on the PGC1α-ID2-TCF4-integrin axis. Taken together, our findings reveal that PGC1α maintains mitochondrial energetic metabolism and suppresses metastasis through direct regulation of parallel acting transcriptional programs. Consequently, components of these circuits define new therapeutic opportunities that may help curb melanoma metastasis.
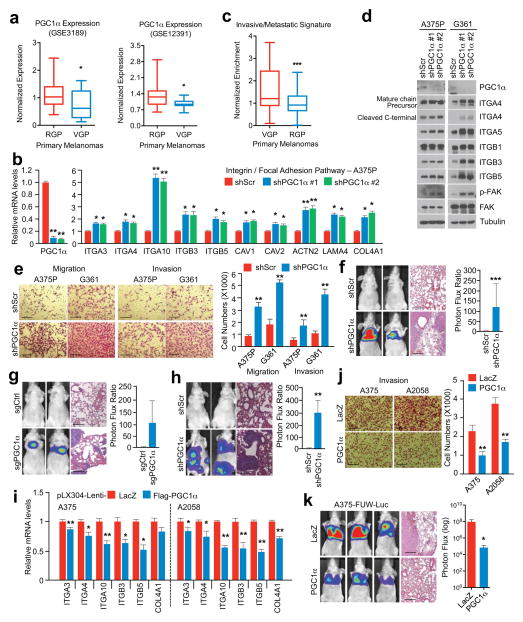
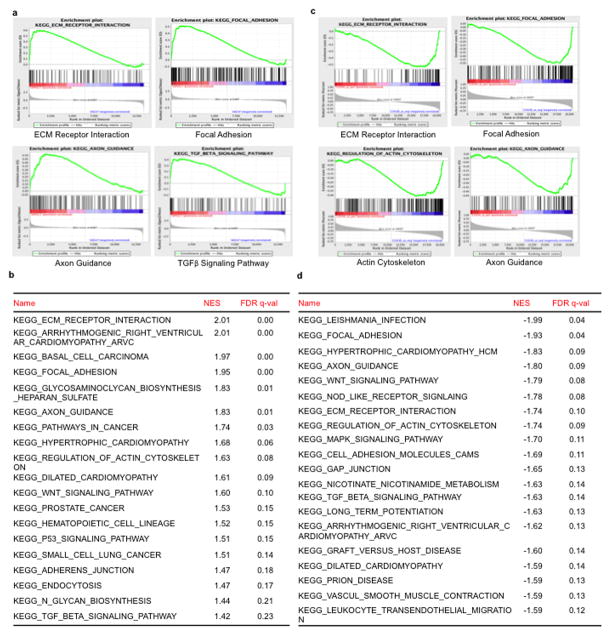
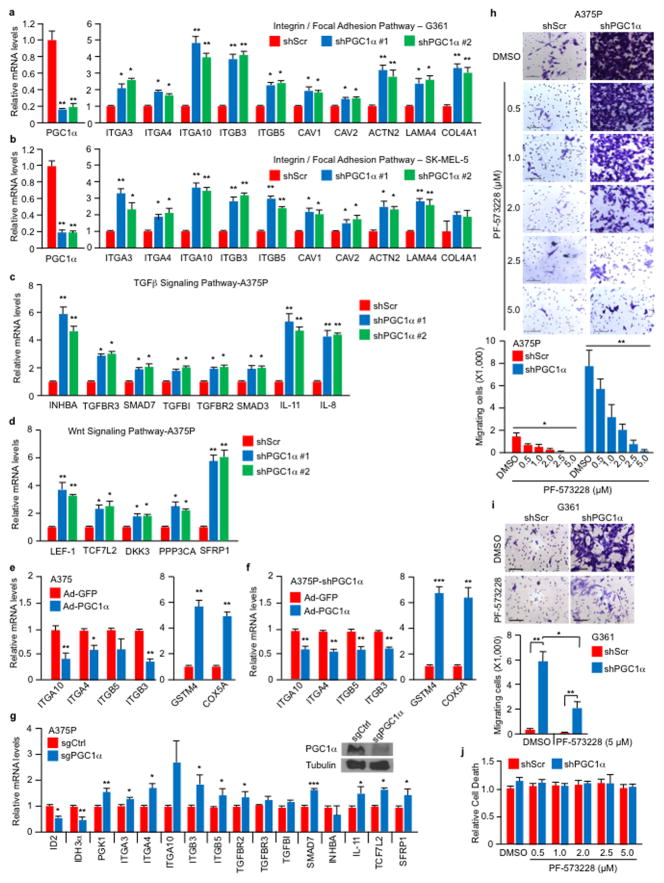
Whereas the landscape of genetic alterations and multiple driver mutations have been discovered in melanoma10,11, less is understood about the genes driving metastasis2. Nevertheless, it is thought that efficient metastasis requires the malignant cell to balance proliferation with invasion and migration12,13. We recently found that elevated expression of the metabolic integrator and transcriptional coactivator peroxisome proliferator-activated receptor-gamma coactivator-1α (PGC1α or PPARGC1A) defines a subset of melanomas wherein it promotes mitochondrial metabolism, protects against oxidative stress, and enhances survival4,5. Although high PGC1α expression is associated with worse prognosis in metastatic melanomas4,5, reduced levels coincide with invasive/vertical growth in primary specimens (Fig. 1a). Therefore, we investigated the effects of PGC1α in invasion and metastasis. Gene set enrichment analysis (GSEA) of expression data (GSE36879)4 upon PGC1α knockdown in the non-metastatic melanoma cell line A375P revealed a coordinated upregulation of genes implicated in metastasis, including genes that control focal adhesion or extracellular matrix (ECM) interactions, integrins and components of the transforming growth factor-β (TGFβ) and Wnt signaling (Extended Data Fig. 1a, b)14–17. In addition, PGC1α expression showed an inverse correlation with gene sets involved in melanoma metastasis (Extended Data Fig. 1c, d). Upregulation of pro-metastatic genes following PGC1α suppression was confirmed by qPCR in PGC1α-positive melanoma cell lines (Fig. 1b, Extended Data Fig. 2a–d). Conversely, the increase in integrin transcripts was reverted upon ectopic PGC1α expression (Extended Data Fig. 2e, f). Targeting PGC1α using the CRISPR/Cas9 system led to similar gene expression changes (Extended Data Fig. 2g).
Figure 1. PGC1α suppresses melanoma cell migration, invasion and metastasis.
a, PGC1α expression is decreased in vertical growing (VGP) compared to radial growing (RGP) human primary melanomas. b, PGC1α knockdown increases integrin transcripts in PGC1α-positive melanoma cells. c, Expression of the PGC1α-regulated invasive/metastatic signature genes in human primary melanomas. d, PGC1α knockdown increases integrin signaling in PGC1α-positive melanoma cells. e–g, PGC1α knockdown by shRNA (f, n=7 mice/group) or CRISPR/Cas9 (g, n=3 mice/group) increases A375P cells migration/invasion (e) and metastasis (f–g). h. PGC1α knockdown elevates metastasis of subcutaneous MeWo melanoma (n=3 mice/group). i–k, Restoration of PGC1α suppresses integrin expression (i), invasion (j) and metastasis (k, n=4 mice/group) of PGC1α-negative melanoma cells. Images in e–h, j and k represent one picture captured, with scale bar representing 200 microns. Values in a and c represent median ± relative deviation within indicated dataset; values in b, e, i and j show mean ± SD of independent biological triplicates; values in f, g, h and k represent mean ± SD of indicated amount of mice; *p < 0.05, **p < 0.01 and ***p < 0.005 by Student’s t-test in all the panels except d.
Consistent with lower PGC1α expression during vertical growth and acquisition of the metastatic phenotype, the PGC1α-suppressed invasive and metastatic gene signature was associated with worse primary melanoma survival (Fig. 1c). Changes in integrin expression upon PGC1α depletion were accompanied by activation of the downstream kinase focal adhesion kinase (FAK)18 (Fig. 1d), and increases in migration and invasion (Fig. 1e). FAK inhibition blocked the enhanced migration induced by PGC1α depletion (Extended Data Fig. 2h–j). Remarkably, PGC1α silencing by either shRNA (Fig. 1f, Extended Data Fig. 3a, b) or CRISPR/Cas9 (Fig. 1g) converted these low-invasive, PGC1α-positive cells into highly metastatic entities as assessed by tail-vein injection experiments. To fully recapitulate the metastatic process in vivo, we used MeWo cells in an orthotropic metastasis model19 and found that, again, PGC1α suppression caused the subcutaneously implanted tumors to generate systemic disease (Fig. 1h). Conversely, reconstitution of PGC1α in the PGC1α-negative cells A375 and A2058 decreased integrin expression (Fig. 1i, Extended Data Fig. 3c, d) and compromised their invasiveness in vitro and in vivo (Fig. 1j, k). Together, these results indicate that PGC1α inhibits a pro-metastatic program in melanoma cells resulting in the suppression of invasion and metastasis.
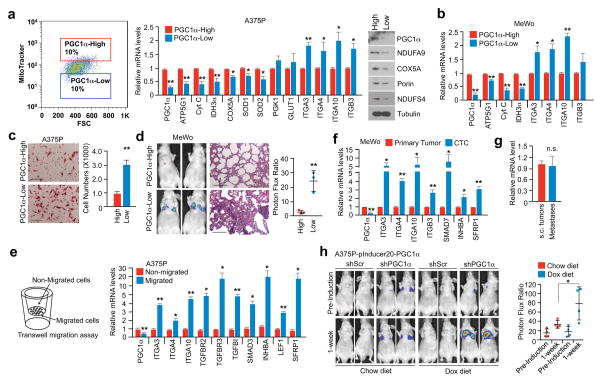
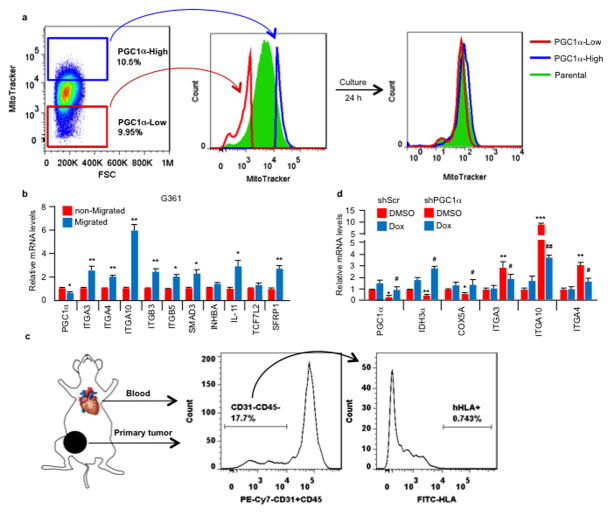
Melanomas are highly heterogeneous and might switch between a proliferative and an invasive/metastatic phenotype13. Using MitoTracker to label mitochondria and FACS analysis, we found that melanoma cell lines with heightened PGC1α expression displayed heterogeneous mitochondrial mass (Fig. 2a), which was dynamically regulated (Extended Data Fig. 4a), and hence could implicate alternate mitochondrial biogenesis and PGC1α function during phenotype switching. The sorted mitochondria-high (mito/PGC1α-high) population expressed significantly higher PGC1α and mitochondrial components, as well as lower integrins compared to the mitochondria-low (mito/PGC1α-low) population (Fig. 2a, b). The PGC1α-low population showed enhanced migration in vitro and metastasis in vivo (Fig. 2c, d). Compared to the non-migrating population, melanoma cells that had migrated through the trans-well membrane expressed lower amounts of PGC1α and higher pro-metastatic transcripts (Fig. 2e, Extended Data Fig. 4b). To strengthen the link between PGC1α and metabolic heterogeneity with metastatic spread, we isolated circulating tumor cells (CTCs) from the blood of mice bearing subcutaneous PGC1α-positive MeWo tumors (Extended Data Fig. 4c). Notably, these CTCs exhibited lower levels of PGC1α, but elevated integrins compared to the primary tumors (Fig 2f). However, in the corresponding lung metastases, which had formed from CTCs, PGC1α transcripts increased to similar levels as in the primary tumors (Fig. 2g). Demonstrating that increases in PGC1α in established metastases confer growth advantages similar to primary melanomas4,20, restoration of PGC1α in lung metastases derived from PGC1α knockdown cells enhanced tumor progression (Fig. 2h, Extended Data Fig. 4d). In aggregate, these results indicate that melanoma cells display heterogeneous levels of PGC1α and mitochondria. The mito/PGC1α-low population expresses a pro-metastatic gene program, while the mito/PGC1α-high population drives a proliferation phenotype.
Figure 2. The heterogeneity of PGC1α expression in melanoma defines the metastatic capacity of individual cells.
a, Mitochondrial mass in PGC1α-positive A375P cells correlates with PGC1α expression. b, The mito/PGC1α-low population of the PGC1α-positive MeWo cells displays higher integrin expression. c–d. The mito/PGC1α-low population is more migratory (c) and metastatic (d, n=3 mice/group). Images represent three pictures captured with scale bar representing 100 microns (c) or 200 microns (d). e. Within the same cell line, migratory cells express lower PGC1α but higher prometastatic genes than non-migrated cells. f. Circulating tumor cells (CTCs) express less PGC1α but higher pro-metastatic genes than primary tumor cells. g. Relative expression of PGC1α in subcutaneous MeWo melanomas and lung metastases. h. Doxycycline-based PGC1α restoration in established lung metastases promotes tumor growth (n=3–4 mice/group). Quantification of tumors with shPGC1α before and after doxycycline induction is shown. Values in a, b, c, e, f and g represent mean ± SD of independent biological triplicates; values in d and h represent mean ± SD of indicated amount of mice; *p < 0.05 and **p < 0.01 by Student’s t-test in all panels.
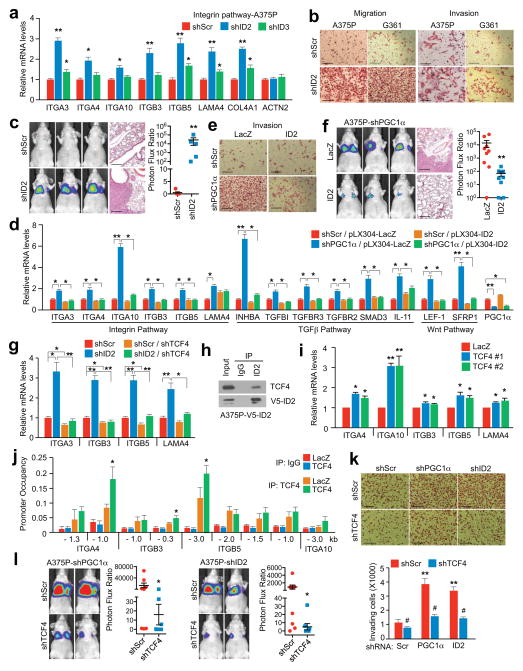
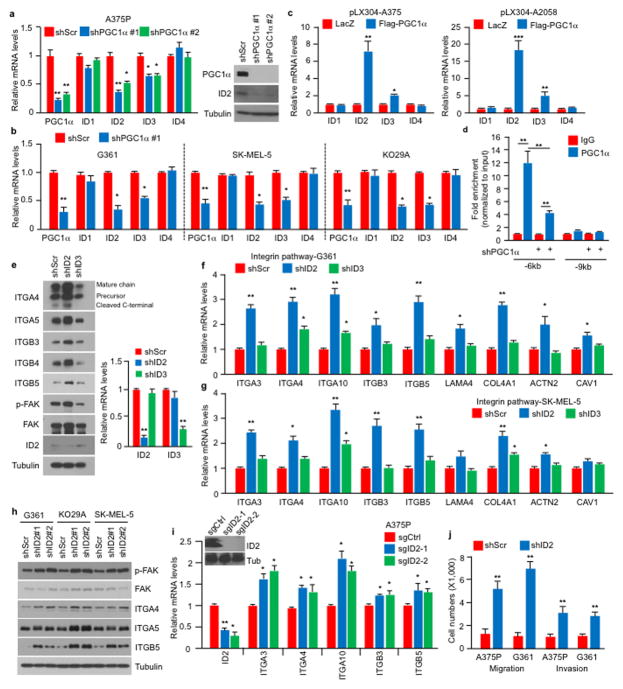
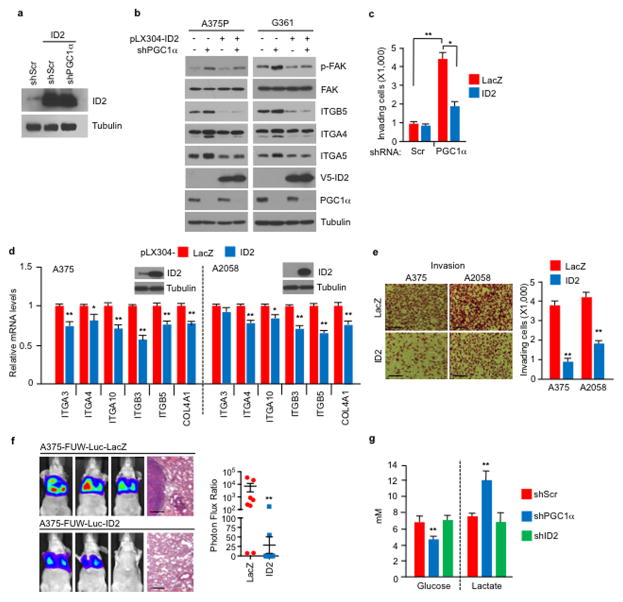
To assess the mechanisms by which PGC1α suppresses this pro-metastatic program, we surveyed genes upregulated upon PGC1α suppression for potential negative transcriptional regulators. We identified two Inhibitor of DNA binding (ID) proteins—ID2 and ID3, among the top differentially expressed genes. Levels of ID2 and ID3, but not ID1 or ID4, were reduced in melanoma cells upon PGC1α knockdown and increased by PGC1α (Extended Data Fig. 5a–c). Chromatin immunoprecipitation (ChIP) revealed that PGC1α was bound at the ID2 promoter, suggesting direct transcriptional regulation (Extended Data Fig. 5d). Next, we depleted ID2 and ID3 in PGC1α-positive melanoma cells and found that suppression of ID2, but not ID3, increased integrin expression and downstream signaling (Fig. 3a, Extended Data Fig. 5e–i). Similar to PGC1α knockdown, ID2 depletion also strongly promoted migration, invasion and lung metastasis (Fig. 3b, c, Extended Data Fig. 5j). To test whether ID2 mediates the repressive effect of PGC1α, we ectopically expressed ID2 in PGC1α-depleted cells (Extended Data Fig. 6a). ID2 expression suppressed the induction of the prometastatic programs, invasion and metastasis enforced by PGC1α depletion (Fig. 3d–f, Extended Data Fig. 6b, c). Similar results were observed when ID2 was ectopically expressed in PGC1α-negative melanoma cells (Extended Data Fig. 6d–f). However, depletion of ID2, in contrast to PGC1α, did not alter glucose metabolism (Extended Data Fig. 6g). Taken together, these data indicate that the ID2 inhibitor is a downstream target of PGC1α suppressing pro-metastatic transcriptional programs without affecting PGC1α metabolic function.
Figure 3. PGC1α transcriptionally activates ID2 to suppress TCF4 activity and the pro-metastatic program.
a–c, ID2 knockdown in A375P cells increases integrin expression (a), migration/invasion (b) and metastasis (c, n=5 mice/group). d–f, Ectopic expression of ID2 attenuates PGC1α depletion-mediated activation of integrin, TGFβ and Wnt pathways (d) and induction of invasion (e) and metastasis (f, n=9 mice/group). g, TCF4 is required for the induction of integrins by ID2 inhibition. h, ID2 interacts with TCF4 in A375P cells. i–j, Ectopic expression of TCF4 increases integrin mRNAs (i) through directly binding to promoters of integrin genes (j) in A375P cells. k–l, TCF4 depletion represses invasion (k) and metastasis (l, n=8 mice/group) induced by PGC1α or ID2 knockdown in A375P cells. Images in b, c, e, f and k represent one picture captured with scale bar representing 200 microns; specifically, scale bars in b, A375P invasion, represent 100 microns. Values in a, d, g, i, j and k represent mean ± SD of independent biological triplicates representative of three experiments; values in c, f and l represent mean ± SEM of indicated amount of mice; in a, c, d, f, g, i, j, k and l, *p < 0.05, **p < 0.01 and ***p < 0.005 by Student’s t-test.
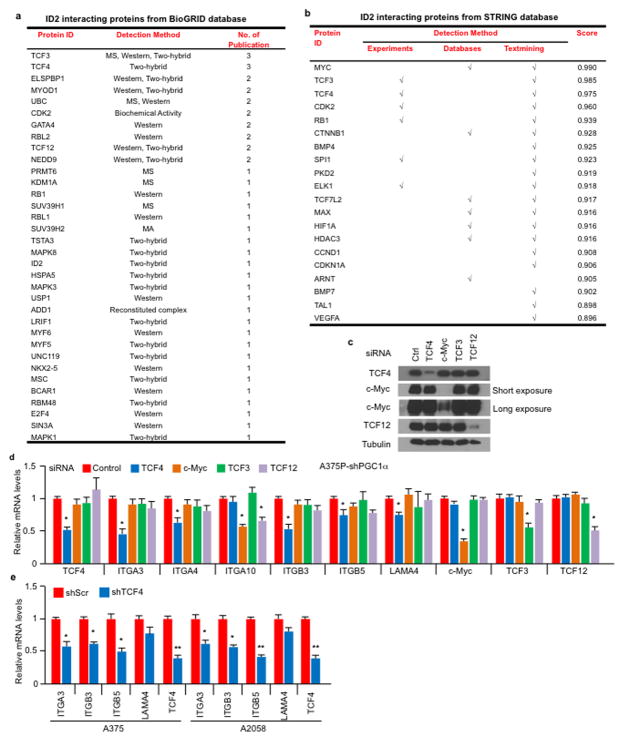
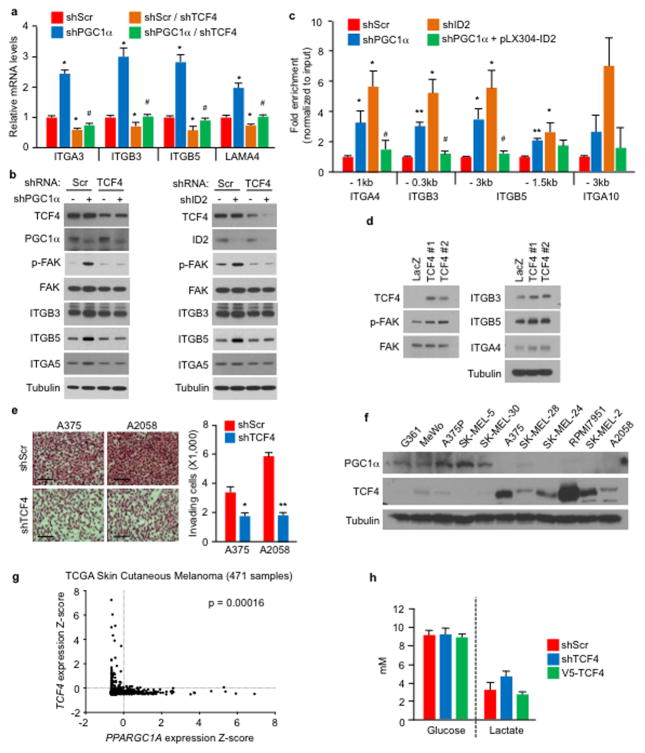
ID2 functions as a transcriptional inhibitor through direct heterodimerization with basic helix-loop-helix (bHLH) factors, blocking binding to promoters21–23. To find bHLH factor(s) that could regulate integrin expression and metastasis driven by PGC1α suppression, we surveyed two different protein-protein interaction databases. BioGRID24 displayed 34 unique ID2 interactors including the bHLH transcription factors TCF3, TCF4, MyoD and TCF12 (Extended Data Fig. 7a). STRING25 revealed three bHLH transcription factors (MYC, TCF3, TCF4) in the top 10 predicted partners (Extended Data Fig. 7b). Among these factors, only suppression of TCF4 (Transcription factor 4) was able to consistently decrease integrin expression in both A375P-shPGC1α and PGC1α-negative cells (Extended Data Fig. 7c–e). Knockdown of TCF4 prevented the induction of integrins and FAK phosphorylation upon PGC1α or ID2 suppression (Fig. 3g, Extended Data Fig. 8a, b). Co-immunoprecipitation showed that TCF4 binds to ID2 in A375P cells (Fig. 3h). Consistent with this interaction, while the recruitment of TCF4 to promoters of integrins was increased upon PGC1α or ID2 knockdown, ectopic expression of ID2 blunted TCF4 recruitment (Extended Data Fig. 8c). Ectopic expression of TCF4 was sufficient to induce integrin expression and signaling (Fig. 3i, Extended Data Fig. 8d), concordant with TCF4 recruitment to their promoters (Fig. 3j). TCF4 knockdown abrogated the enhanced migration and metastasis of cells with PGC1α or ID2 suppression (Fig. 3k, l), and in PGC1α-negative cells (Extended Data Fig. 8e). Notably, expression of PGC1α and TCF4 in cell lines and tumors was mutually exclusive (Extended Data Fig. 8f, g), further supporting the opposite link between PGC1α and TCF4. Similar to ID2, manipulation of TCF4 levels did not alter cellular metabolism (Extended Data Fig. 8h), indicating that PGC1α’s effects on metastasis is separable from its metabolic functions. Collectively, TCF4 is required for the pro-metastatic transcriptional program upon PGC1α suppression leading to increased invasion and metastasis.
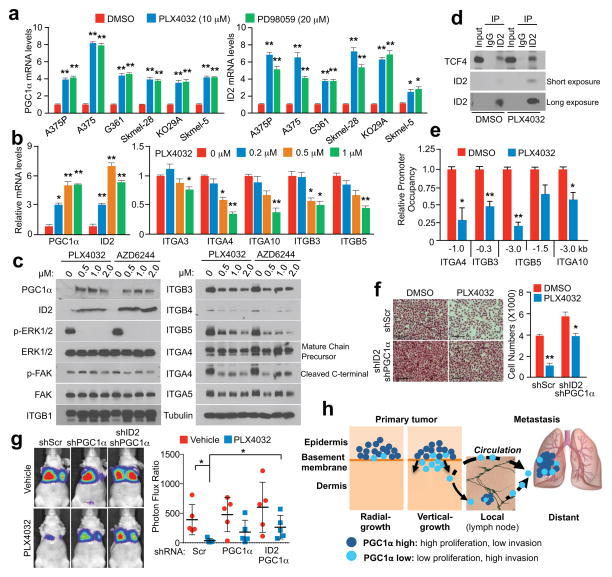
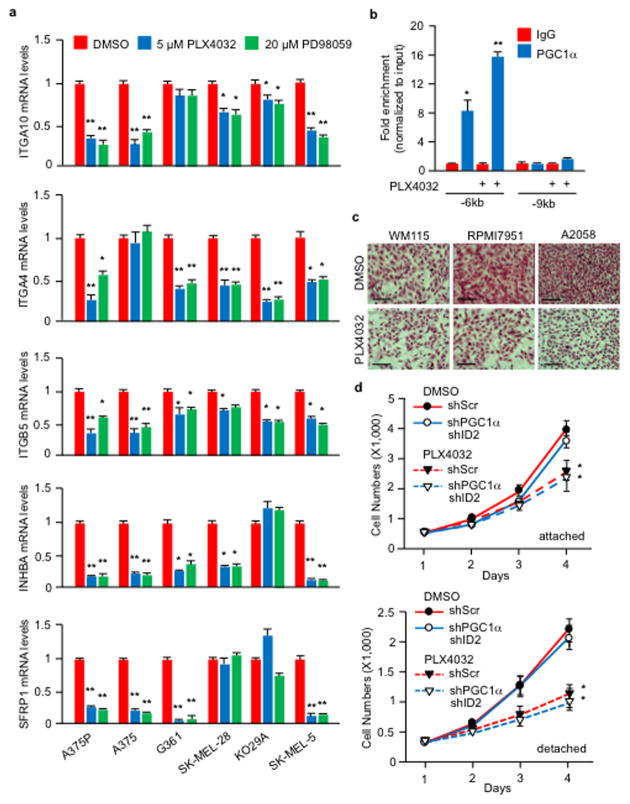
PLX4032, a BRAFV600E inhibitor, has been shown to increase PGC1α expression in melanoma cells harboring this mutation5,9,26. Based on our results described here, PLX4032 could inhibit metastasis by acting on the PGC1α transcriptional axis. Treatment of BRAFV600E melanoma cells with PLX4032 or MEK inhibitors highly induced PGC1α and ID2 expression (Fig. 4a), and reduced levels of most integrins tested (Fig. 4b, c, Extended Data Fig. 9a). Consistently, PLX4032 increased the recruitment of PGC1α to the ID2 promoter (Extended Data Fig. 9b) and strongly induced the interaction between ID2 and TCF4 (Fig. 4d), decreasing TCF4 promoter occupancy at four integrin genes (Fig. 4e). Despite FAK activation, measured as phospho-Y397-FAK levels, was slightly inhibited upon MAPK blockage (Fig. 4c), PLX4032 was able to repress melanoma invasion in vitro and metastasis in vivo, which was largely reversed by PGC1α or ID2 depletion (Fig. 4f, g, Extended Data Fig. 9c). Within the time frame of the in vitro assay (24 hours), PLX4032 did not decrease cell growth (Extended Data Fig. 9d), and the dose of PLX4032 used in mice (1 mg/kg) was lower than the dose used to induce tumor regression27. Taken together, these data indicate that PLX4032 can suppress invasion and metastasis, independently of its cytotoxic effects. PLX4032-induced metastasis inhibition is mediated, at least in part, through transcriptional activation of PGC1α.
Figure 4. BRAFV600E inhibitor, PLX4032, inhibits melanoma metastasis by suppressing integrin signaling through PGC1α and ID2.
a–c, Inhibitors of BRAFV600E (PLX4032) and MEK1/2 (PD98059 or AZD6244) increase PGC1α and ID2 expression (a, b) and repress integrin expression and signaling (b, c). Cells were treated with indicated concentration of inhibitors for 6 h (a, b) or 24 h (c). d–e, PLX4032 increases the interaction between ID2 and TCF4 (d) and decreases the occupancy of TCF4 at the promoters of integrin genes (e). f–g, PGC1α and ID2 are required for PLX4032-mediated inhibition of invasion and metastasis. For in vitro assays (f), A375 cells were incubated with 1 μM PLX4032 for 10 h, and images represent one picture captured per membrane with scale bar representing 200 microns. For in vivo assays (g, n=5 mice/group), PLX4032 (1 mg/kg, i.p. daily) was given for one week following cell implantation, and metastasis was analyzed three weeks post-treatment. One representative mouse image for each group is shown. h. Melanoma cells are heterogeneous, containing PGC1α-high and -low subpopulations. Values in a, b, e and f represent mean ± SD of independent biological triplicates; values in g represent mean ± SD of indicated amount of mice; *p < 0.05 and **p < 0.01 by Student’s t-test in a, b, e, f and g.
Our results overall indicate that the metabolic transcriptional coactivator PGC1α is an apical regulator of melanoma progression through protection against oxidative stress which confers survival and proliferative advantages4,5,20, and suppression of cell motility, cell-cell interaction, adhesion and invasion that promotes metastatic drive. Strikingly, PGC1α expression inversely correlates with invasive growth in local disease; while in metastatic melanomas, it associates with worse outcomes. Although PGC1α defines a subset of melanomas with specific characteristics, its heterogeneous expression within tumors allows different proliferative or invasive abilities (Fig. 4h). We argue that the heterogeneity of PGC1α levels within melanomas reflects a dualistic nature of PGC1α function—promoting growth and survival of tumors, while suppressing metastatic spread. This heterogeneity might be important during melanoma progression through PGC1α changes in response to different signals including nutrients, and switching between survival/proliferation and invasion/metastasis. From a therapeutic standpoint, independent of the cytotoxic/cytostatic effects, our results extend the clinical benefits of the BRAFV600E-targeted drugs to impact metastasis. For melanoma treatment, BRAFV600E-inhibitors may have heightened therapeutic benefits if applied at an earlier stage by inducing PGC1α and reducing metastatic propensity. Moreover, selection of cells with lower PGC1α may promote metastasis, such as within BRAFV600E inhibitor-treated RAS-mutant melanomas or BRAFV600E inhibitor-resistant melanomas28, as these samples reactivate ERK/MEK signaling and reduce PGC1α expression. Finally, targeting the components downstream of PGC1α that drive metastasis could provide new therapeutic opportunities for melanoma and other malignancies such as prostate cancer29.
METHODS
Reagents and antibodies
PLX4032, PD98059, AZD6244 and PF-573228 were purchased from Selleck Chemicals. The siRNAs against TCF4 (sc-61657), c-Myc (sc-29226), TCF3 (sc-36618) or TCF12 (sc-35552) were purchased from Santa Cruz Biotechnology. Antibodies against ITGA4, ITGA5, ITGB1, ITGB3, ITGB4, ITGB5, FAK, c-Myc, TCF12, and Porin were purchased from Cell Signaling Technology; p-FAK (Y397) antibodies were from Cell Signaling and Thermo Fisher Scientific, ID2 antibodies were from Cell Signaling, Santa Cruz Biotechnology and Thermo Fisher; V5, HMB45, COX5A, NDUFS4 and NDUFA9 antibodies were from Abcam; TCF4 antibodies were from Abnova and Santa Cruz; and PGC1α antibodies were from Santa Cruz and Millipore.
GSEA analysis
The GSEA software v2.0 (http://www.broadinstitute.org/gsea)30 was used to perform the GSEA analysis. In all the analysis, the KEGG gene sets were used. The values of the 219195_at probe (corresponding to PPARGC1A) were used as phenotype. For the analysis of the CCLE dataset, the gene expression data was downloaded from the CCLE portal (wwww.broadinstitute.org/CCLE) and the data from 61 melanoma cell lines was used for the analysis. The GSEA default parameters were used with the exception that Pearson correlation was computed to rank the genes for the analysis of the CCLE data and permutation was changed to gene set for the analysis of the GSE36879 dataset.
Expression Dataset Analysis
Published datasets GSE318931 and GSE1239132 with associated pathological stages for each sample as Invasive/Vertical or Superficial/Radial were analyzed for relative deviation from median-normalized PGC1α intensities (linear) within each dataset (significance based on 2-sample, 2-sided t-test statistics). To examine the enrichment of the PGC1α-regulated metastasis/invasion signature genes (ITGA3, ITGA4, ITGA10, ITGB3, ITGB5, CAV1, CAV2, ACTN2, LAMA4A, COL4A1, INHBA, TGFBI, TGFBR3, TGFBR2, SMAD3, SMAD7, IL8, IL11, LEF1, TCF7L2, DKK3, PPP3CA and SFRP1), we performed ssGSEA projections33 to yield a percentile-based Normalized Enrichment Score within each of GSE3189 and GSE12391, which were used to combine the datasets (2-sample, 2-sided t-test statistics). The association between primary melanoma survival and PGC1α-regulated metastasis/invasion signature was based on ssGSEA for signature closeness within GSE57715 and calculation of log-rank survival.
For the analysis of PGC1α and TCF4 gene expression, data obtained from the TCGA skin cutaneous melanoma dataset34 consisting of 471 samples with RNAseq data was downloaded from the cBioPortal35,36 (www.cbioportal.org). Data were represented as Z-scores of RNAseq V2 RSM. The dotted lines denote Z-scores of 0. Samples were classified as expressing if Z-score >0 and a mutually exclusivity report from the cBioPortal was generated.
Generation of lentiviral vectors
pDONR223-LacZ entry control vector was purchased from Addgene (25893) and pLX304-LacZ control vector was generated using LR clonase II (Invitrogen). V5 tagged pLX304-ID2 and -TCF4 vectors were kindly provided from Marc Vidal Lab at Dana-Farber Cancer Institute. Luciferase-expressing FUW-Luc was kindly provided by Andrew Kung (Dana-Farber Cancer Institute) and pMSCV-Luciferase-hygro plasmid was purchased from Addgene. Full-length PGC1α was amplified by KOD polymerase (F: GCTTGGGACATGTGCAGCGAA and R: TTACCTGCGCAAGCTTCTCTGAGC), and then PCR product was ligated into pDONR223 by BP reaction. PGC1α expressing destination vectors (pLX304 for constitutive expression and pInducer2037 for doxycycline-inducible expression) were generated by LR reaction with entry vector (pDONR223-PGC1α).
Cell culture, siRNA transfection, shRNA transduction and CRISPR generation
Melanoma cells were obtained from ATCC and their authentication was confirmed by either DNA fingerprinting with small tandem repeat (STR) profiling or in-house PCR testing of melanoma marker genes and BRAF mutation status. Mycoplasma contamination was tested negative in house with the PCR Mycoplasma Detection Kit (Lonza). Melanoma cells were cultured in high glucose DMEM containing 10% FBS. For detachment culture conditions, cells were plated on plates coated with poly-2-hydroxy methacrylate (poly-HEMA). Lentiviruses encoding shRNAs or cDNAs were produced in HEK293T cells with packaging vectors (pMD2G and psPAX2) using Polyfect (Qiagen). Lentiviruses particles were collected 48 h after post-transfection and used to infect melanoma cells in the presence of 8 μg/ml polybrene, and infected cells were selected with 2 μg/ml of puromycin or 7 μg/ml blasticidin for 4 days prior to experiments. siRNA transfection was performed using Lipofectamine 2000 (Invitrogen) according to the manufacturer’s instructions. Guide-RNAs were cloned into pLX-sgRNA (Addgene #50662 for PGC1α) or lentiCRISPR (Addgene #49535 for ID2). Cells were subsequently infected with lentiviruses encoding Cas9 (pCW-Cas9, Addgene #50661) and sgRNAs followed by selection with blasticidin and puromycin as described above, and 1 μg/mL of doxycycline for 7 days.
Western Blot
Cells were lysed in a buffer containing 1% IGEPAL, 150 mM NaCl, 20 mM HEPES (pH7.9), 10 mM NaF, 0.1 mM EDTA, 1 mM sodium orthovanadate and 1X protease inhibitor cocktail. Protein concentration was quantified using BCA protein concentration assay kit (Pierce). Cell lysates were electrophoresed on SDS-polyacrylamide gels and transferred to Immobilon-P membrane (Millipore). Membranes were incubated with primary antibodies in 5% bovine serum albumin containing 0.05% Tween-20 overnight at 4°C. The membrane was then incubated with HRP-conjugated secondary antibody for 1 h at room temperature, and visualized using an ECL Prime (GE Healthcare).
Quantitative real time-PCR
Total RNA was isolated with Trizol (Invitrogen) by Direct-zol RNA MiniPrep kit (Zymo Research), and 2 μg of total RNA was used for cDNA synthesis using high capacity cDNA reverse transcription kit (Applied Biosystems). qPCR was carried out using SYBR Green PCR Master Mix (Applied Biosystems). Experimental Ct values were normalized to 36B4 where not otherwise indicated, and relative mRNA expression was calculated. Sequences for all the primers are provided in the Supplementary Information.
For PGC1α overexpression by adenovirus, A375P-shPGC1α and A375 cells were infected with adenoviruses expressing GFP or Flag-PGC1α for 36 h, followed by qPCR. PGC1α targets such as GSTM4 and COX5A were used as positive controls. For inhibitor treatment, cells were incubated with indicated concentrations of inhibitors for 6 h and mRNAs were analyzed by qPCR. For the RNA from migratory and non-migratory cells, migration of the A375P and G361 cells was initiated as described below. The non-migratory cells in suspension in the upper chambers were collected by centrifugation and resuspension in lysis buffer from the Cells-to-cDNA II kit (Invitrogen). The migratory cells were collected by directly applying the lysis buffer to the membrane, following the wash and clearing of the non-migratory cells in the upper chambers. 18S rRNA was used as internal control. For cells from paraffin-embedded tissue sections, Pinpoint™ Slide RNA Isolation System II (Zymo Research) was used to extract RNAs.
Cell Sorting
Cells with different mitochondrial contents were sorted based on the labeling of MitoTracker Green (Invitrogen). Briefly, MitoTracker Green was spiked in the medium of 100% confluent melanoma cells at the final concentration of 75 μM, and incubated with the cells for 20 min, followed by FACS sorting at DFCI Flow Cytometry Core. The top 10% cell population with the highest mitochondrial contents (mito/PGC1α-high) and the bottom 10% cell population with the lowest mitochondrial contents (mito/PGC1α-low) were harvested for qPCR, Western blot, migration assay (1×10⁵/well for overnight) and metastasis assay.
For the circulating tumor cells, whole blood of the tumor-bearing mice was collected by cardiac perfusion with PBS containing 0.5 mM EDTA. After red blood cell lysis, the pelleted cells were stained with anti-mouse CD31 and CD45, along with anti-human HLA (eBioscience, as depicted in Extended Data Fig. 4c). The CD31−CD45−hHLA+ cells were directly sorted into RNAprotect Cell Reagent (Qiagen), and then converted into cDNA using the Cells-to-cDNA II kit. The primary tumors were subjected to enzymatic digestion for single cell suspension and FACS sorting to make them equivalent controls. qPCR was performed with SYBR Green, following the unbiased, target-specific preamplification of cDNA using SsoAdvanced PreAmp Supermix (BioRad). Experimental Ct values were normalized to 18s rRNA, and relative mRNA expression was calculated.
Glucose consumption and lactate production assays
Lactate and glucose assay kits (BioVision Research Products) were used to measure extracellular lactate and glucose, following manufacturer’s instructions. Briefly, equal number of cells were seeded in 6-well plates and cultured in Phenol Red-free DMEM for 24 h or 36 h. Cultured medium was then mixed with the reaction solution. Lactate and glucose levels were measured at 450 nm and 570 nm, respectively, using a FLUO star Omega plate reader. Values were normalized to cell number.
In vivo metastasis assays
Melanoma cell lines were lifted by 0.5 mM EDTA in PBS and washed with 1X PBS. For the intravenous injection, a total of 3 × 10⁵ (A375) or 1 × 10⁶ (G361 and MeWo) or 2 × 10⁶ (A375P and FACS-sorted MeWo) cells in 0.2 mL of DMEM were injected into the tail vein of 6-week-old male nude mice. No randomization or blind techniques were applied in this study. To assess the degree of tumor formation in the lung, bioluminescence imaging of living mice were performed on a Xenogen IVIS-50TM imaging systems equipped with an isoflurane (1~3%) anesthesia system and a temperature controlled platform19, three weeks (G361 and MeWo) or four weeks (A375 and A375P) post injection. For the doxycycline induction experiment, upon detection of lung metastasis following tail vein implantation, PGC1α expression was induced by feeding mice with chow or doxycycline-containing diet (200 g/kg, Harlan Laboratories) for one week. For the orthotopic metastasis model, 1 × 10⁶ cells were injected subcutaneously into one side of the 6-week-old male NOD/SCID mouse, with two injections per animal, followed by surgical tumor removal when the subcutaneous tumors reached the size of 2 mm in diameter. Metastasis was monitored by in vivo imaging at 8–10 weeks post surgery. After the measurement of bioluminescence, animals were sacrificed and the lungs were harvested. Collected lung tissues were fixed in 10% buffered formalin solution (Sigma-Aldrich) overnight. Fixed tissues were stained with hematoxylin and eosin (H&E) or antibodies against p-FAK-Y397 (Invitrogen) or HMB45 (Abcam), and one image per sample was shown as representative of one or three pictures captured, as indicated specifically in corresponding figure legend. Scale bar represents 200 microns unless otherwise indicated. All procedures were conducted in accordance with the guidelines of the Beth Israel Deaconess Medical Center Institutional Animal Care and Use Committee, and none of the tumors exceeded the size limit dictated by the IACUC guidelines.
In vitro migration and invasion assays
For cell migration assays, transwell chambers were purchased from Corning Life Science. Generally, A375P (5×10³) or G361 (4×10³) cells in 0.1 mL of FBS-free medium were seeded into the upper chamber and incubated for 6 h if not otherwise indicated. For invasion assays, A375P (5×10³), A375 (3×10³), G361 (4×10³), A2058 (3×10³), RPMI7951 (5×10³) or WM115 (4×10³) cells in 0.1 mL of FBS-free medium were seeded into the upper chamber of an 8 μM matrigel coated chamber (BD Bioscience) and incubated for 16 h if not otherwise indicated. Specifically, for the migration and invasion assays on sorted cells (Fig. 2c) or A375P cells with ID2 knockdown (Fig. 3b), 1×10⁵ cells were seeded and incubated for 24 h. Cells that had migrated and invaded through the matrigel were then fixed and stained with H&E if not otherwise indicated. The membrane attached with migrated and invaded cells was placed on a glass slide and total cell numbers from three or four random fields under 20–40X magnifications were quantified with an Olympus IX51 or a Nikon 80i Upright microscope, by counting cells on 20–50% of one field area and extrapolated to 100% of the field17.
Specifically, for the experiments with FAK inhibitor, shScr or shPGC1α stably expressing cells (A375P 1×10⁵/well, G361 2.5×10⁴/well) were cultured in transwell chambers with either DMSO or indicated concentration of PF-573228, followed by staining with Crystal Violet and quantification after migration for 24 h. For the experiments with PLX4032, cells were incubated with DMSO or 1 μM PLX4032 for 10 h in matrigel-coated transwell chambers, followed by quantification.
Co-immunoprecipitation and chromatin immunoprecipitation assays
Nuclear lysates were incubated with specific antibodies overnight at 4°C, followed by precipitation with protein G Dynabeads (Invitrogen) at 4°C for 2 h. For Figure 3h, nuclear lysates from V5-ID2 stably-expressing A375P cells were subjected to co-IP with 1 μg ID2 antibody (C-20, Santa Cruz Biotechnology), followed by Western blot with TCF4 (M03, Abnova) and ID2 (4E12G5, Thermo Scientific); for Figure 4d, 10 mg of nuclear lysates from A375P cells treated with DMSO or 1 μM PLX4032 for 16 h were subjected to co-IP with 4 μg ID2 antibody (C-20). ChIP was performed with the MilliPore ChIP Kit with slight modification. Following sonication, nuclear lysates were precleared with protein A/GDynabeads (Invirogen) for 1 h. Equal amounts of precleared lysates were incubated with IgG or gene specific antibodies (PGC1α 4C1.C from Millipore, or PGC1α H-300, and TCF4 K-15 from Santa Cruz Biotechnology) overnight, followed by precipitation with protein A/G-Dynabeads for 2 h. qPCR with SYBR Green was performed to quantify the promoter occupancy. For Figure 4e, A375P cells stably expressing V5-TCF4 were cultured with PLX4032 at 5 μM for 16 hours and followed by ChIP and qPCR.
Cell growth and survival assays
ToxiLight™ Non-destructive Cytotoxicity BioAssay Kit (Lonza) was used to quantify the cytotoxic effects of indicated compounds according to the manufacturer’s instruction. The measurement of dead cells in DMSO group was set as 1, and was used to normalize other treatment groups (Extended Data Figure 2j). For the cell growth assay with PLX4032 (Extended Data Figure 9d), cells were cultured with DMSO or PLX4032 for indicated time under either attachment or detachment conditions, followed by cell counting with hemocytometer. For detachment culture conditions, cells were plated on tissue culture plates coated with poly-2-hydroxy methacrylate (poly-HEMA).
Statistics
All statistics are described in figure legends. In general, for two experimental comparisons, a two-tailed unpaired Student’s t-test was used unless otherwise indicated. For multiple comparisons, one-way ANOVAs were applied. When cells were used for experiments, three replicates per treatment were chosen as an initial sample size. All n values defined in the legends refer to biological replicates. If technical failures such as tail-vein injection failure or inadequate intraperitoneal injection occurred before collection, those samples were excluded from the final analysis. Statistical significance is represented by asterisks corresponding to *p < 0.05, **p < 0.01 and ***p < 0.005.
Extended Data
Extended Data Figure 1. GSEA analysis of PGC1α expression in melanoma cell lines.
a–b, Representative GSEA plots (a) and list of gene sets (b) enriched in A375P cells upon PGC1α knockdown from dataset GSE36879, with the significance defined by q<0.25. c–d, Plots (c) and list of (d) the top gene sets whose expression is negatively correlated with PGC1α in 61 melanoma cell lines from CCLE, with the significance defined by q<0.15.
Extended Data Figure 2. PGC1α depletion activates integrin, TGFβ and Wnt pathways.
a–d, PGC1α knockdown increases expression of integrin genes (a–b), as well as genes in the TGFβ (c) and Wnt (d) pathways. e–f, Ectopic expression of PGC1α by adenoviruses inhibits integrin gene expression. g, CRISPR-mediated PGC1α depletion increases gene expression linked to integrin, TGFβ and Wnt pathways in A375P cells. Depletion of PGC1α was confirmed by immunoblotting. h–i. FAK inhibition blunted the increased migration induced by PGC1α depletion. A375P (h) and G361 (i) cells were subjected to 24 h transwell migration assay in the presence of DMSO or various doses of FAK inhibitor PF-573228. Images represent three pictures captured with scale bar representing 100 microns. j. The cytotoxic effects of FAK inhibitor on A375P melanoma cells were comparable between the various doses used in the migration assay within the 24 h time frame. The relative level of dead cells in culture supernatant was quantified by ToxiLight Bioassay. Values in all panels represent mean ± SD of independent biological triplicates; *p < 0.05, **p < 0.01 and ***p<0.001 by Student’s t-test in all panels.
Extended Data Figure 3. PGC1α suppresses metastasis in melanoma cells.
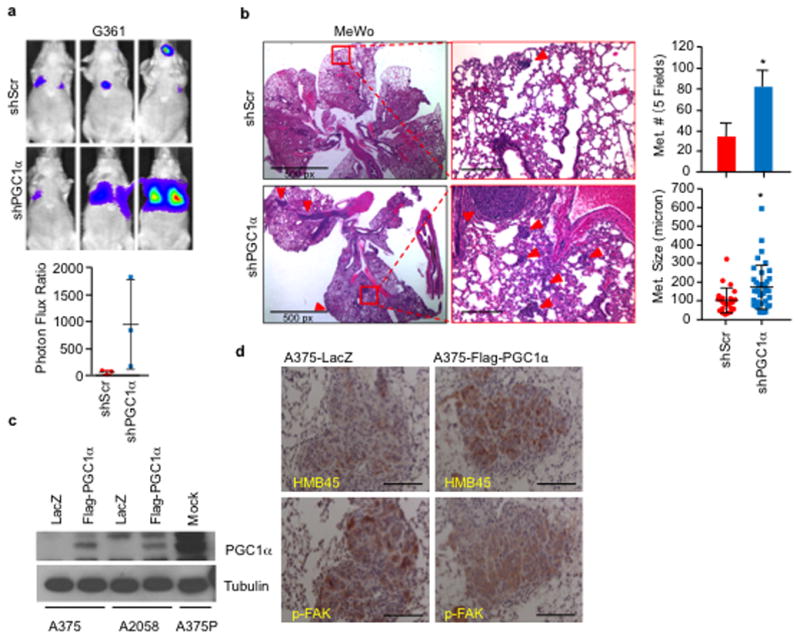
a–b, Knockdown of PGC1α increases the metastatic capacity of PGC1α-positive G361 (a, n=3 mice/group) and MeWo (b, n=3 mice/group) cells. Quantification of the number and size of lung metastatic nodules is shown. Metastatic size was quantified by measuring the longest diameter of each nodule. Values represent mean ± SD, *p < 0.05 by Student’s t-test. Images in b represent one picture captured per H&E slide; scale bar represents 200 microns if not otherwise indicated. c, Ectopic expression level of PGC1α in the PGC1α-negative A375 and A2058 lines. d, Restoration of PGC1α suppresses integrin signaling, as indicated by p-FAK (Y397), in A375-derived lung metastatic nodules. Melanoma diagnostic marker HMB45 was used to distinguish the tumor nodules from the lung tissues. Images represent three pictures captured per slide with scale bar representing 100 microns.
Extended Data Figure 4. Melanoma cells contain heterogeneous levels of mitochondria and PGC1α.
a. The mitochondrial content in melanoma cells is dynamically regulated. After 24 h in culture, the sorted mito-high and -low A375P subpopulations re-establish normal mitochondrial content distribution. b, Within the PGC1α-positive G361 line, the cells with higher migratory ability express lower PGC1α but elevated the pro-metastatic genes. Values represent mean ± SD of triplicates; *p < 0.05 and **p < 0.01 by Student’s t-test. c. Isolation of circulating tumor cells (CTCs) from tumor-bearing mouse. 2-month post-injection, the subcutaneous MeWo tumors become detectable, whole blood was collected by cardiac perfusion, followed by FACS based on surface protein staining, with mouse CD31 and CD45 to exclude endothelial cells and lymphocytes and human HLAabc to purify human tumor cells. The primary subcutaneous tumors were enzymatically digested into single cell suspension and subjected to the same sorting strategy. d. Gene expression in A375P melanoma cells after PGC1α induction. Values represent mean ± SD of independent biological triplicates; *p<0.05, **p<0.01 and ***p<0.001 versus shScr/DMSO; #p<0.05 and ##p<0.01 versus shPGC1α/DMSO by Student’s t-test.
Extended Data Figure 5. ID2, but not ID3, is downstream of PGC1α in the suppression of the pro-metastatic program.
a–b, PGC1α knockdown inhibits ID2 expression in PGC1α-positive cells. c, Ectopic expression of PGC1α increases ID2 levels in PGC1α-negative cells. d, PGC1α occupies the ID2 promoter region in A375P cells. e–g, Inhibition of ID2, but not ID3, increases expression and activation of integrin signaling in melanoma cell lines. h–i, Inhibition of ID2 by either shRNA or CRISPR/Cas9 increases expression of integrins. j, Quantification of in vitro migration and invasion induced by ID2 knockdown as shown in Figure 3b. Values in all panels except h represent mean ± SD of independent biological triplicates; *p < 0.05, **p < 0.01 and ***p<0.001 by Student’s t-test in all panels except h.
Extended Data Figure 6. Enforced expression of ID2 suppresses metastasis.
a, Ectopic expression of ID2 in A375P cells is higher than its endogenous level. b, Ectopic expression of ID2 attenuates integrin proteins and FAK (Y397) phosphorylation induced by PGC1α depletion. c, Quantification of invading cells as shown in Figure 3e. d–f, Ectopic expression of ID2 suppresses integrin gene expression (d), invasion in vitro (e) and metastasis in vivo (f, n=8 mice/group). Images in e and f represent one picture captured; scale bar represents 200 microns. g, ID2 does not affect cellular metabolism. Values in c, d, e and g represent mean ± SD of independent biological triplicates; values in f represent mean ± SEM of the 8 mice; *p < 0.05 and **p < 0.01 by Student’s t-test in c, d, e, f and g.
Extended Data Figure 7. TCF4 is a putative ID2 partner in the regulation of integrin genes.
a–b, List of the top ID2-interacting proteins from BioGRID (a) and STRING (b) databases. c, Knockdown efficiency of individual bHLH transcriptional factors by siRNAs in A375P cells was tested by immunoblotting. d, Inhibition of TCF4 attenuates PGC1α knockdown-mediated integrin induction in A375P cells. e, TCF4 knockdown suppresses gene expression linked to integrin signaling. Values in d and e represent mean ± SD of independent biological triplicates; *p < 0.05 and **p < 0.01 by Student’s t-test in d and e.
Extended Data Figure 8.
a, TCF4 is required for PGC1α depletion-mediated induction of integrin genes in A375P cells. b, Ectopic expression of ID2 blocks the binding of TCF4 to integrin promoters in A375P cells. V5-TCF4 stably overexpressing A375P cells with indicated genetic manipulations were subjected to ChIP and qPCR. Values in a and b represent mean ± SD of independent biological triplicates; *p < 0.05 and **p < 0.01 versus shScr; #p<0.05 versus shPGC1α by Student’s t-test. c, Depletion of TCF4 blunts the activation of integrin signaling by PGC1α or ID2 knockdown in A375P cells. d, Ectopic expression of TCF4 increases integrin proteins and signaling in A375P cells. e, TCF4 knockdown suppresses cell invasion in A375 and A2058 cells. Images represent one picture captured per membrane with scale bar representing 200 microns. f, Expression of PGC1α and TCF4 in a panel of human melanoma cell lines. g, TCF4 and PGC1α expression in TCGA skin cutaneous melanoma dataset (471 samples with RNAseq expression data). Tendency towards mutual exclusivity for samples with Z-scores >0 (represented by dotted lines), p = 0.00016 by Fisher’s test. h, TCF4 level does not affect cellular metabolism. Values in e and h represent mean ± SD of independent biological triplicates; *p < 0.05 by Student’s t-test.
Extended Data Figure 9.
a, BRAF inhibitor, PLX4032, and MEK1/2 inhibitor, PD98059, decrease integrin gene expression in melanoma cell lines. Gene expression was quantified 6 h post treatment of inhibitors. b, PLX4032-induced PGC1α occupancy at the ID2 promoter. A375P cells were incubated with 2 μM of PLX4032 for 6 h before ChIP analysis. c, PLX4032 inhibits invasion of BRAFV600E-containing melanoma cells. Cells were incubated with 1 μM PLX4032 for 10 h in matrigel-coated transwell chambers, followed by quantification. Images represent one picture captured per membrane with scale bar representing 200 microns. d, PGC1α and ID2 double knockdown does not affect sensitivity to PLX4032. Values in a, b and d represent mean ± SD of independent biological triplicates; *p < 0.05 and **p < 0.01 by Student’s t-test in a, b and d.
Supplementary Material
Acknowledgments
We thank Dr. Rod Bronson (Rodent Histopathology Core, Dana-Farber/Harvard Cancer Center) for his critical analysis of the mouse histology. We thank the Nikon Imaging Center at Harvard Medical School for help with light microscopy. We appreciate the important discussions on this project from members of the Puigserver lab. J-HL was supported in part by a postdoctoral fellowship from the American Heart Association (13POST14750008) and the National Research Foundation from Korean government. These studies were funded in part by the Claudia Adams Barr Program in Cancer Research (to PP), Dana-Farber Cancer Institute internal funds (to PP) and NIH R01CA181217 (to PP), as well as the Friends of Dana-Farber Award (to CL).
Footnotes
The authors disclose no potential conflicts of interest.
Author Contributions
P.P. and F.V. conceived the project. C.L. and J-H.L. designed and performed all the experiments with direction and discussions from P.P.; Y.L. contributed to animal experiments and edited the manuscript. A.T. contributed to immunoblotting experiments. F.V. and H.R.W. designed and performed the bioinformatic analyses. S.R.G. performed immunohistochemistry experiments. P.P., F.V., J-H.L., H.R.W. and C.L. prepared the manuscript.
Author Information
The authors declare no competing financial interests. Readers are welcome to comment on the online version of the paper.
References
- 1.Chin L, Garraway LA, Fisher DE. Malignant melanoma: genetics and therapeutics in the genomic era. Genes Dev. 2006;20:2149–2182. doi: 10.1101/gad.1437206. 20/16/2149[pii] [DOI] [PubMed] [Google Scholar]
- 2.Gupta PB, et al. The melanocyte differentiation program predisposes to metastasis after neoplastic transformation. Nat Genet. 2005;37:1047–1054. doi: 10.1038/ng1634. ng1634[pii] [DOI] [PMC free article] [PubMed] [Google Scholar]
- 3.Puigserver P, Spiegelman BM. Peroxisome proliferator-activated receptor-gamma coactivator 1 alpha (PGC-1 alpha): transcriptional coactivator and metabolic regulator. Endocr Rev. 2003;24:78–90. doi: 10.1210/er.2002-0012. [DOI] [PubMed] [Google Scholar]
- 4.Vazquez F, et al. PGC1alpha expression defines a subset of human melanoma tumors with increased mitochondrial capacity and resistance to oxidative stress. Cancer cell. 2013;23:287–301. doi: 10.1016/j.ccr.2012.11.020. [DOI] [PMC free article] [PubMed] [Google Scholar]
- 5.Haq R, et al. Oncogenic BRAF regulates oxidative metabolism via PGC1alpha and MITF. Cancer cell. 2013;23:302–315. doi: 10.1016/j.ccr.2013.02.003. [DOI] [PMC free article] [PubMed] [Google Scholar]
- 6.Plantefaber LC, Hynes RO. Changes in integrin receptors on oncogenically transformed cells. Cell. 1989;56:281–290. doi: 10.1016/0092-8674(89)90902-1. 0092-8674(89)90902-1 [pii] [DOI] [PubMed] [Google Scholar]
- 7.Naba A, et al. The matrisome: in silico definition and in vivo characterization by proteomics of normal and tumor extracellular matrices. Mol Cell Proteomics. 2012;11:M111 014647. doi: 10.1074/mcp.M111.014647. M111.014647 [pii] [DOI] [PMC free article] [PubMed] [Google Scholar]
- 8.Nguyen DX, Bos PD, Massague J. Metastasis: from dissemination to organ-specific colonization. Nat Rev Cancer. 2009;9:274–284. doi: 10.1038/nrc2622. nrc2622 [pii] [DOI] [PubMed] [Google Scholar]
- 9.Bollag G, et al. Clinical efficacy of a RAF inhibitor needs broad target blockade in BRAF-mutant melanoma. Nature. 2010;467:596–599. doi: 10.1038/nature09454. [DOI] [PMC free article] [PubMed] [Google Scholar]
- 10.Genomic Classification of Cutaneous Melanoma. Cell. 2015;161:1681–1696. doi: 10.1016/j.cell.2015.05.044. S0092-8674(15)00634-0 [pii] [DOI] [PMC free article] [PubMed] [Google Scholar]
- 11.Hodis E, et al. A landscape of driver mutations in melanoma. Cell. 2012;150:251–263. doi: 10.1016/j.cell.2012.06.024. [DOI] [PMC free article] [PubMed] [Google Scholar]
- 12.Fidler IJ. The pathogenesis of cancer metastasis: the ‘seed and soil’ hypothesis revisited. Nat Rev Cancer. 2003;3:453–458. doi: 10.1038/nrc1098nrc1098. [pii] [DOI] [PubMed] [Google Scholar]
- 13.Hoek KS, et al. In vivo switching of human melanoma cells between proliferative and invasive states. Cancer Res. 2008;68:650–656. doi: 10.1158/0008-5472.CAN-07-2491. 68/3/650 [pii] [DOI] [PubMed] [Google Scholar]
- 14.Pinon P, Wehrle-Haller B. Integrins: versatile receptors controlling melanocyte adhesion, migration and proliferation. Pigment cell & melanoma research. 2011;24:282–294. doi: 10.1111/j.1755-148X.2010.00806.x. [DOI] [PubMed] [Google Scholar]
- 15.Busse A, Keilholz U. Role of TGF-beta in melanoma. Current pharmaceutical biotechnology. 2011;12:2165–2175. doi: 10.2174/138920111798808437. [DOI] [PubMed] [Google Scholar]
- 16.Damsky WE, et al. beta-catenin signaling controls metastasis in Braf-activated Pten-deficient melanomas. Cancer cell. 2011;20:741–754. doi: 10.1016/j.ccr.2011.10.030. [DOI] [PMC free article] [PubMed] [Google Scholar]
- 17.Foley CJ, et al. Matrix metalloprotease-1a promotes tumorigenesis and metastasis. The Journal of biological chemistry. 2012;287:24330–24338. doi: 10.1074/jbc.M112.356303. [DOI] [PMC free article] [PubMed] [Google Scholar]
- 18.Parsons JT. Focal adhesion kinase: the first ten years. J Cell Sci. 2003;116:1409–1416. doi: 10.1242/jcs.00373. [DOI] [PubMed] [Google Scholar]
- 19.Pencheva N, Buss CG, Posada J, Merghoub T, Tavazoie SF. Broad-spectrum therapeutic suppression of metastatic melanoma through nuclear hormone receptor activation. Cell. 2014;156:986–1001. doi: 10.1016/j.cell.2014.01.038. [DOI] [PubMed] [Google Scholar]
- 20.Lim JH, Luo C, Vazquez F, Puigserver P. Targeting mitochondrial oxidative metabolism in melanoma causes metabolic compensation through glucose and glutamine utilization. Cancer research. 2014;74:3535–3545. doi: 10.1158/0008-5472.CAN-13-2893-T. [DOI] [PubMed] [Google Scholar]
- 21.Langlands K, Yin X, Anand G, Prochownik EV. Differential interactions of Id proteins with basic-helix-loop-helix transcription factors. J Biol Chem. 1997;272:19785–19793. doi: 10.1074/jbc.272.32.19785. [DOI] [PubMed] [Google Scholar]
- 22.Norton JD. ID helix-loop-helix proteins in cell growth, differentiation and tumorigenesis. J Cell Sci. 2000;113(Pt 22):3897–3905. doi: 10.1242/jcs.113.22.3897. [DOI] [PubMed] [Google Scholar]
- 23.Zebedee Z, Hara E. Id proteins in cell cycle control and cellular senescence. Oncogene. 2001;20:8317–8325. doi: 10.1038/sj.onc.1205092. [DOI] [PubMed] [Google Scholar]
- 24.Chatr-Aryamontri A, et al. The BioGRID interaction database: 2013 update. Nucleic Acids Res. 2013;41:D816–823. doi: 10.1093/nar/gks1158. gks1158 [pii] [DOI] [PMC free article] [PubMed] [Google Scholar]
- 25.Franceschini A, et al. STRING v9.1: protein-protein interaction networks, with increased coverage and integration. Nucleic Acids Res. 2013;41:D808–815. doi: 10.1093/nar/gks1094. gks1094[pii] [DOI] [PMC free article] [PubMed] [Google Scholar]
- 26.Luo C, et al. Loss of ARF sensitizes transgenic BRAFV600E mice to UV-induced melanoma via suppression of XPC. Cancer research. 2013;73:4337–4348. doi: 10.1158/0008-5472.CAN-12-4454. [DOI] [PMC free article] [PubMed] [Google Scholar]
- 27.Yang H, et al. RG7204 (PLX4032), a selective BRAFV600E inhibitor, displays potent antitumor activity in preclinical melanoma models. Cancer research. 2010;70:5518–5527. doi: 10.1158/0008-5472.CAN-10-0646. [DOI] [PubMed] [Google Scholar]
- 28.Sanchez-Laorden B, et al. BRAF inhibitors induce metastasis in RAS mutant or inhibitor-resistant melanoma cells by reactivating MEK and ERK signaling. Science signaling. 2014;7:ra30. doi: 10.1126/scisignal.2004815. [DOI] [PubMed] [Google Scholar]
- 29.Torrano V, et al. The metabolic co-regulator PGC1alpha suppresses prostate cancer metastasis. Nature cell biology. 2016;18:645–656. doi: 10.1038/ncb3357. [DOI] [PMC free article] [PubMed] [Google Scholar]
- 30.Subramanian A, et al. Gene set enrichment analysis: a knowledge-based approach for interpreting genome-wide expression profiles. Proc Natl Acad Sci U S A. 2005;102:15545–15550. doi: 10.1073/pnas.0506580102. 0506580102 [pii] [DOI] [PMC free article] [PubMed] [Google Scholar]
- 31.Talantov D, et al. Novel genes associated with malignant melanoma but not benign melanocytic lesions. Clinical cancer research: an official journal of the American Association for Cancer Research. 2005;11:7234–7242. doi: 10.1158/1078-0432.CCR-05-0683. [DOI] [PubMed] [Google Scholar]
- 32.Scatolini M, et al. Altered molecular pathways in melanocytic lesions. International journal of cancer. Journal international du cancer. 2010;126:1869–1881. doi: 10.1002/ijc.24899. [DOI] [PubMed] [Google Scholar]
- 33.Barbie DA, et al. Systematic RNA interference reveals that oncogenic KRAS-driven cancers require TBK1. Nature. 2009;462:108–112. doi: 10.1038/nature08460. [DOI] [PMC free article] [PubMed] [Google Scholar]
- 34.Cancer Genome Atlas Network. Electronic address, i. m. o. & Cancer Genome Atlas, N. Genomic Classification of Cutaneous Melanoma. Cell. 2015;161:1681–1696. doi: 10.1016/j.cell.2015.05.044. [DOI] [PMC free article] [PubMed] [Google Scholar]
- 35.Gao J, et al. Integrative analysis of complex cancer genomics and clinical profiles using the cBioPortal. Science signaling. 2013;6:pl1. doi: 10.1126/scisignal.2004088. [DOI] [PMC free article] [PubMed] [Google Scholar]
- 36.Cerami E, et al. The cBio cancer genomics portal: an open platform for exploring multidimensional cancer genomics data. Cancer discovery. 2012;2:401–404. doi: 10.1158/2159-8290.CD-12-0095. [DOI] [PMC free article] [PubMed] [Google Scholar]
- 37.Meerbrey KL, et al. The pINDUCER lentiviral toolkit for inducible RNA interference in vitro and in vivo. Proceedings of the National Academy of Sciences of the United States of America. 2011;108:3665–3670. doi: 10.1073/pnas.1019736108. [DOI] [PMC free article] [PubMed] [Google Scholar]
Associated Data
This section collects any data citations, data availability statements, or supplementary materials included in this article.


