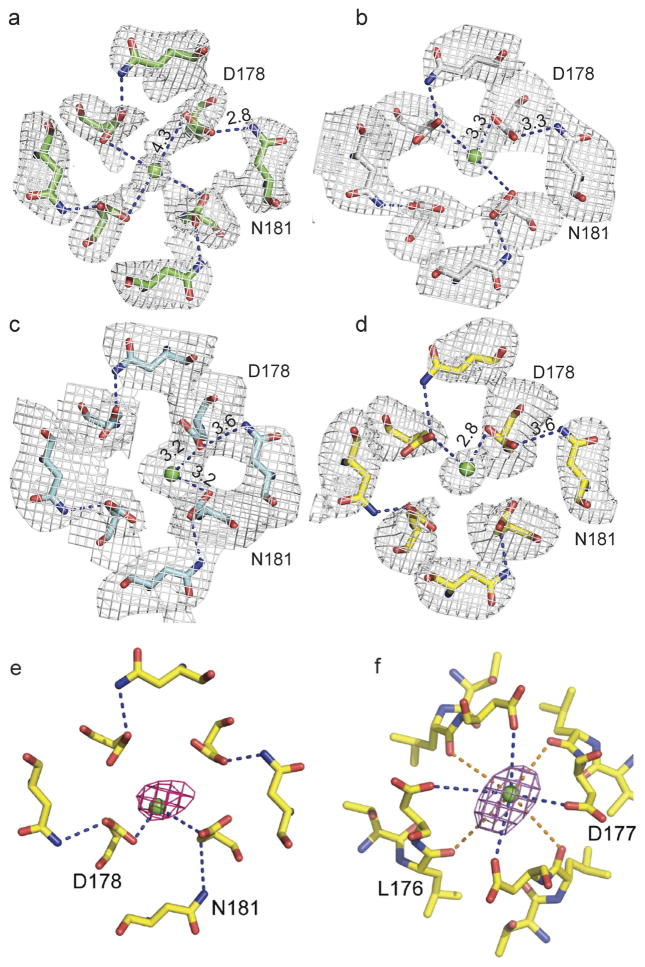
Extended Data Figure 5. Evidence for the partially dehydrated Ca2+ binding and carboxyl-carboxylate pairs at the selectivity filter entryway.
a, Top view of an Fo–Fc simulated annealing omit map contoured at 3σ for residues 178 and 181 for the wild-type channel without drug. b, Top view of an Fo–Fc simulated annealing omit map contoured at 3σ for residues 178 and 181 for CaVAb–amlodipine. c, Top view of an Fo–Fc simulated annealing omit map contoured at 2.5σ for residues 178 and 181 for CaVAb–nimodipine. d, Top view of an Fo–Fc simulated annealing omit map contoured at 3σ for residues 178 and 181 for CaVAb– UK-59811. e, Top view of Site 1 with the anomalous difference Fourier map density (red mesh, contoured at 3σ) calculated with diffraction data of crystals collected at 1.75 Å wavelength. Ca2+ is shown as a green sphere. Site 1 residues are shown in sticks. Hydrogen bonds are indicated with dashed lines. f, Top view of Site 2 with the anomalous difference Fourier map density (magenta mesh, contoured at 3σ).

