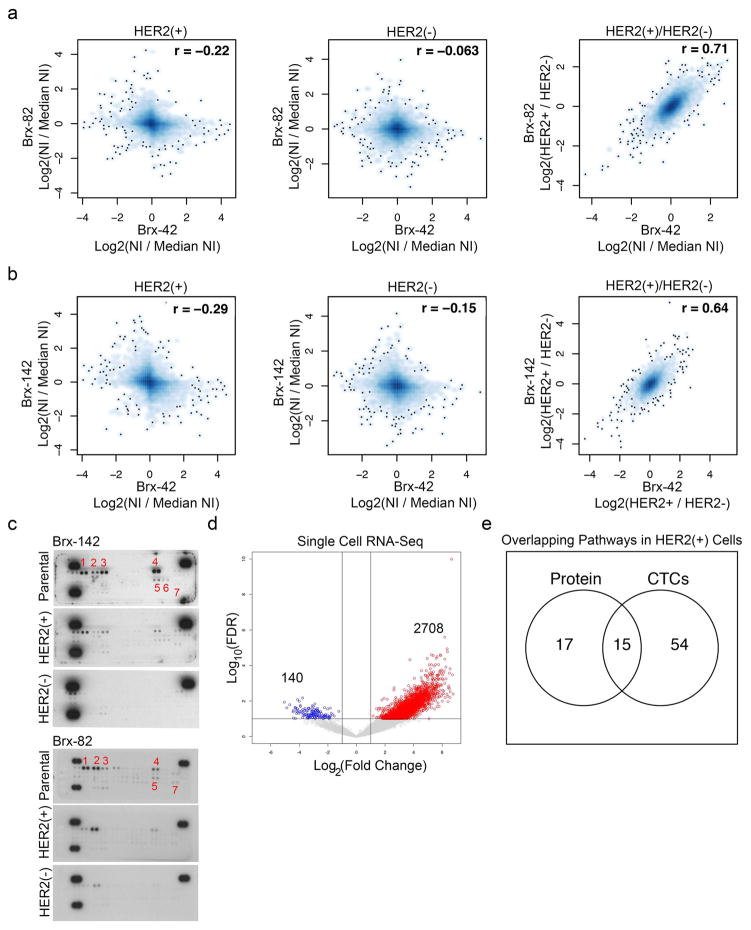
Extended Data Fig. 4. Proteomic and scRNA-Seq analysis of HER2+ versus HER2− cells.
(a–b) MS-based whole cell proteome profiles (6349 proteins) comparing HER2+ and HER2− populations from CTC lines (Brx-42, Brx-82, Brx-142). Matched HER2+ versus HER2− proteomic differences show significant linear correlation (Pearson correlation coefficient = 0.71 between Brx-82 and Brx-42; Pearson correlation coefficient = 0.64 between Brx-142 and Brx-42); NI = Normalized Intensity; n=2 per cell line are shown. (c) Phospho-RTK array of HER2+ and HER2− populations of CTC cell lines Brx-142 and Brx-82 show increased phosphorylation of RTKs in the HER2+ population. Numbers denote: 1. HER2; 2. HER3; 3. HER4; 4. INSR; 5. EPHA1; 6. EPHA2; 7. AXL. Representative data from two independent experiments are shown. (d) Volcano plot depicts genes enriched in HER2+ (red) and HER2− (blue) individual CTCs isolated from patients Brx-42 and Brx-82 and analyzed by scRNA-seq; n=22. (e) Venn diagram showing overlap of genes and proteins derived from scRNA-seq (Brx-42, Brx-82) and quantitative proteomics of HER2+ CTCs, respectively.

