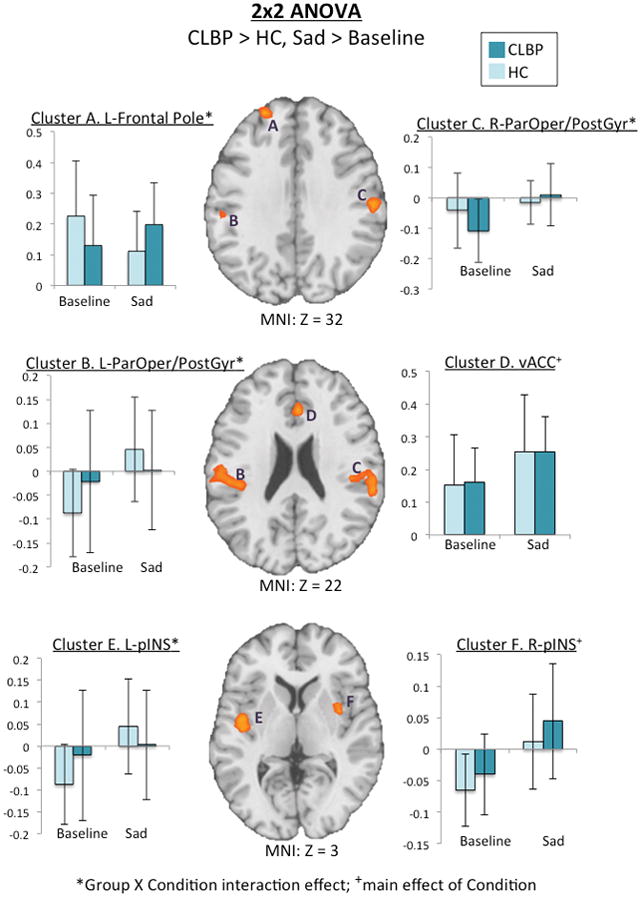
Figure 3.

Axial slices of omnibus results from a 2×2 repeated-measures ANOVA using the factors group (CLBP > HC) and condition (sadness > baseline). Level is indicated by the Z MNI coordinate below each slice. Bar graphs represent mean fcMRI values of each cluster, which are labeled by letters. Light bars represent HC and dark bars represent CLBP. Group X condition interaction effects were identified in clusters A (frontal pole), B (left ParOper/PostGyr), C (right ParOper/PostGry), E (left pINS), and cerebellum (not pictured)], so that CLBP showed increased fcMRI between these clusters and the DMN following sad mood induction. Additionally, there was a main effect of condition only in clusters D (vACC) and F (right pINS).
