Summary
In Gram-negative bacteria, outer membrane (OM) transporters import nutrients by coupling to an inner membrane (IM) protein complex called the Ton complex. The Ton complex consists of TonB, ExbB, and ExbD, and uses the proton motive force (pmf) at the IM to transduce energy to the OM via TonB. Here, we structurally characterize the Ton complex from E. coli using X-ray crystallography, electron microscopy, DEER spectroscopy, and crosslinking, revealing a stoichiometry consisting of a pentamer of ExbB, a dimer of ExbD, and at least one TonB. Electrophysiology studies show that the Ton subcomplex forms pH-sensitive cation-selective channels, providing insight to the mechanism by which it may harness the pmf for energy production.
Introduction
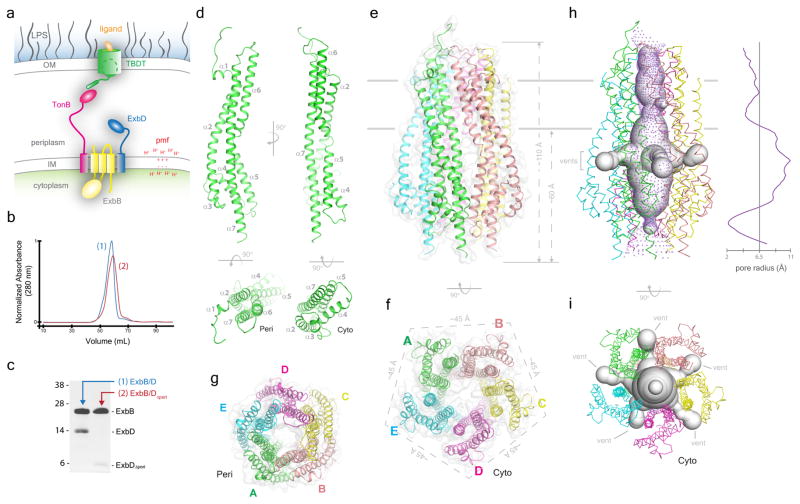
Gram-negative bacteria contain no known energy source located in the outer membrane (OM). To overcome this deficiency, bacteria have evolved systems to harness the energy produced from the proton motive force (pmf) generated at the inner membrane (IM) and transduce it for transport at the OM1,2. An example is the Ton system that mediates the uptake of metals, carbohydrates, iron-siderophore complexes, cobalamin, and many bacteriocins3–6. The Ton system consists of (i) the energy transducing Ton complex located within the IM and (ii) the ligand-specific TonB-dependent (TBD) transporter found within the OM, which interacts with the ligands to be transported2,7–9 (Fig. 1a). The Ton complex is formed by three integral polytopic membrane proteins ExbB, ExbD, and TonB. The energy transfer is mediated by a conserved 5–7 residue TonB-box at the N-terminus of all TBD transporters2,10. Upon ligand binding to the TBD transporter, the TonB box becomes exposed and the interaction with TonB leads to conformational changes in the TBD transporter that are coupled to ligand transport across the OM.
Figure 1. The structure of the ExbB oligomer.
a. Schematic of the Ton system for energy transduction. b. SEC profiles of the Ton subcomplexes (1, ExbB/ExbD; 2, ExbB/ExbDΔperi) (representative purification from 50 or 30 experiments, respectively). c. SDS-PAGE analysis of the Ton subcomplexes purified in panel b. d. A cartoon representation of the ExbB monomer, consisting of seven α-helices. e. The ExbB pentamer structure shown as cartoon and transparent surface. f. Perpendicular view of the cytoplasmic end of the ExbB pentamer depicting the 5-fold symmetry with each edge measuring ~45 Å. g. Perpendicular view of the periplasmic end of the ExbB pentamer. h. The ExbB pentamer was analyzed with the programs MOLE 2.039 (spheres representation) and HOLE40 (purple dots). i. Perpendicular view of the cavities in panel h to better illustrate the five fenestrations (vents).
ExbB is predicted to contain three transmembrane spanning helices (TMHs) with a large cytoplasmic domain, whereas ExbD and TonB are each predicted to contain a single N-terminal TMH that anchors a large C-terminal periplasmic domain in the IM11–15 (Fig. 1a). The exact stoichiometry of components of the Ton complex has been a matter of debate for years16–19. Evidence favoring a dynamic mechanism has been reported in which fluorescence anisotropy studies showed that the presence of TonB within the Ton complex sustains a rotational motion dependent on the pmf at the IM20.
The Ton complex is often compared to the Tol complex, which consists of the analogous components TolQ, TolR, and TolA21,22. The Tol complex is required for cell envelope integrity23,24 and to maintain cellular structure during cell division25. And similar to TonB for the Ton system, energy dependent conformational changes have been demonstrated for TolA20,26,27. The Ton complex is also evolutionarily related to the Mot complex, which drives bacterial flagellar motion22,28–30
To better understand the role of the Ton complex in energy transduction to the OM, we solved crystal structures of the E. coli Ton subcomplex. We further characterized the assembly of the complex using electron microscopy, crosslinking, and DEER spectroscopy, which reveal that the fully assembled Ton complex consists of a pentamer of ExbB, a dimer of ExbD, and at least one TonB.
Results
Crystal structure of the Ton subcomplex
Constructs of the Ton subcomplex (ExbB/ExbD) were purified by a C-terminal 10x-His tag on ExbD (Fig. 1b, c) and crystals grown by vapor diffusion as described in the Methods. Initial phases were calculated using a 5.2 Å Se-SAD dataset of ExbB/ExbDΔperi, allowing an initial poly-alanine model to be built (Extended Data Fig. 1). This starting model was then used as a search model to solve the structures at pH 4.5 and 7.0 by molecular replacement (Supplementary Table 1).
The structure of the ExbB/ExbDΔperi complex at pH 7.0 was solved to 2.6 Å resolution. However, only ExbB could be built due to insufficient density for ExbDΔperi (Extended Data Fig. 2). The ExbB monomer adopts an extended conformation sitting perpendicular to the membrane, consisting of seven α-helices with α2 and α7 measuring 80–100 Å in length and α5 and α6 forming an extended helix (~100 Å) separated by a kink (Fig. 1d). The TM domain consists of three transmembrane helices formed by α2, α6, and α7 while the remainder of the helices compose the cytoplasmic domain consisting of cytoplasmic domain 1 and the C-terminal domain, forming a 5-helix bundle.
The quaternary structure of ExbB is a pentamer where the five TM domains form a transmembrane pore (α6 and α7), while the cytoplasmic domains form a large enclosed cavity extending as far as ~60 Å into the cytoplasm (Fig. 1e, f, g). The cytoplasmic domain of ExbB retains 5-fold symmetry with each edge measuring ~45 Å, while the periplasmic domain is arranged in pseudo 5-fold symmetry with each edge measuring ~35 Å. ExbB forms a large extended cavity (largest pore radius ~11 Å) along the cytoplasmic and TM domains which is open, yet constricted on each end (pore radius ~2 Å on the cytoplasmic side and ~4 Å along the TM side) (Fig. 1h). Each monomer has ~3,000 Å2 of buried surface area with the two adjacent molecules (~20% of total surface area), indicating a stable oligomeric state. For the cytoplasmic cavity, five side fenestrations are observed which could allow solvent or ion passage (Fig. 1h, i). Sparse electron density indicated that the TM pore of ExbB is likely filled by the TMH of ExbDΔperi; however, this density was too diffuse to allow a model to be built unambiguously (Extended Data Fig. 2). Two ExbB pentamers were observed per asymmetric unit and alignment of these pentamers reveals some helical shifts, possibly indicating a propensity for movement within the membrane domain (Extended Data Fig. 3).
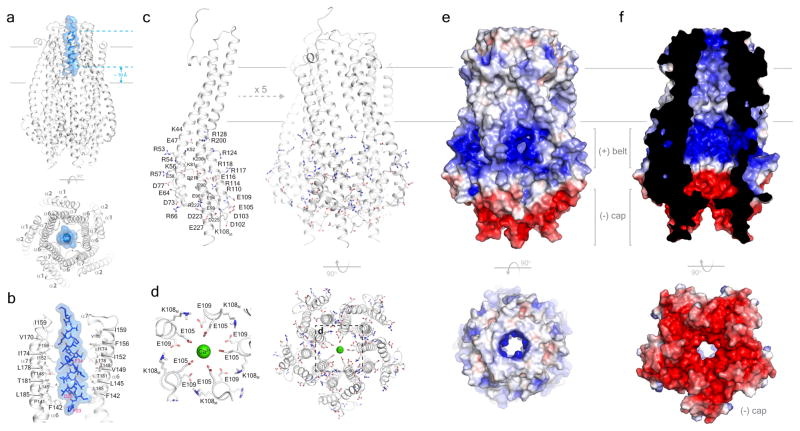
To verify the presence of the TMH of ExbDΔperi within the TM pore of the ExbB pentamer, we solved the structure of ExbB/ExbDΔperi at pH 4.5, to 3.5 Å resolution and observed a single α-helix (Fig. 2a, b, Supplementary Table 1, Extended Data Fig. 4). An extended α-helix could be built consisting of residues 22–45, which correlated well with the hydrophobic residues inside the TM pore of ExbB, although, it was offset by ~10 Å from the position of the TM domains of ExbB predicted to be embedded into the membrane. The exact position of each residue was less precise due to the lack of well-defined side chain density. These results suggest movements of the TMH of ExbDΔperi may be modulated by the change in pH (Extended Data Fig. 5).
Figure 2. The structure of the ExbB/ExbDΔperi complex.
a. The ExbB/ExbDΔperi complex highlighting the TM helix of ExbD (blue) located within the TM pore of the ExbB pentamer (gray). b. Residues from helices α6 and α7 line the TM pore of ExbB (gray) and mediate interaction with the TM helix of ExbD (blue). For clarity, only two monomers of the ExbB pentamer are shown. c. The cytoplasmic domain of ExbB forms a large enclosed cavity that includes twelve arginines, six lysines, eleven glutamates, and seven aspartates from each monomer. d. Electronegatively charged residues E105 and E109 line the cytoplasmic pore and interact with a single calcium ion (green sphere). e. Electrostatic surface representation of ExbB showing the electropositive ‘belt’ and the electronegative ‘cap’. f. Cutaway view showing that the electrostatic surface properties of the inside cavity.
A striking feature of the ExbB pentamer is the very large cytoplasmic domain and its electrostatic properties, which includes a strongly electropositive ‘basic belt’ that sits close to the membrane interface and a strongly electronegative ‘cap’ that sits at the cytoplasmic end of the structure (Fig. 2c, d, e, f). For the basic belt, each monomer contributes six lysine residues at positions 44, 52, 56, 81, 108, and 206 and twelve arginine residues at positions 53, 54, 57, 66, 110, 114, 117, 118, 124, 128, 200, and 222. For the cap, each monomer contributes seven aspartates at positions 73, 77, 102, 103, 211, 223, and 225, and eleven glutamate residues at positions 47, 58, 64, 90, 94, 96, 99, 105, 109, 116, and 227. Residues E105 and E109 line the cytoplasmic pore where we observed a single calcium ion in our structure (Fig. 2c, d).
ExbB is a pentamer in the Ton complex
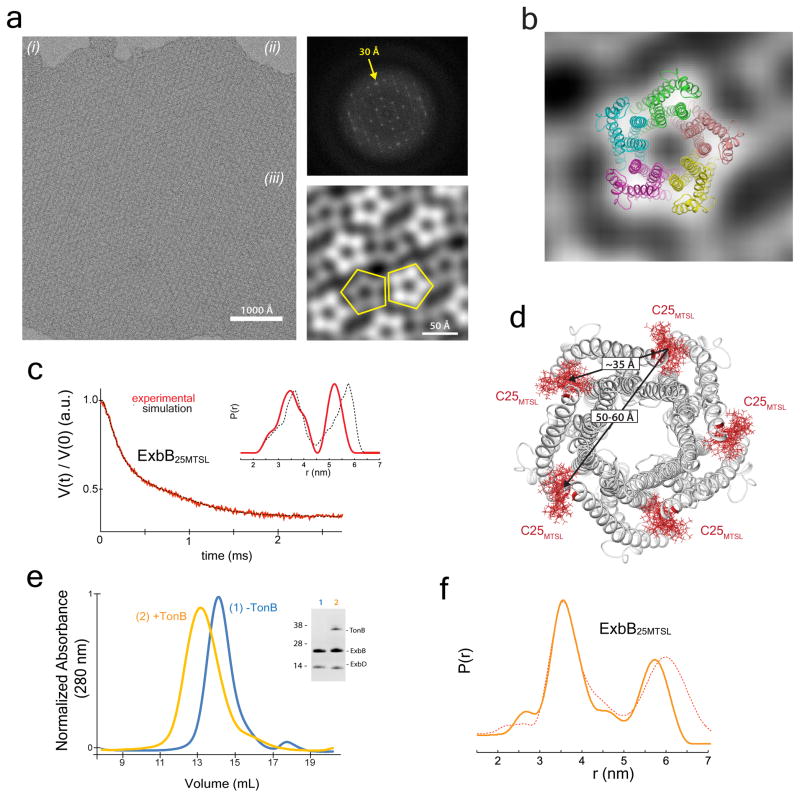
Negative stain electron microscopy (EM) was performed on two-dimensional (2D) crystals of the full-length ExbB/ExbD complex (Fig. 3a). The best images were used to generate an averaged 2D projection map of the unit cell which revealed five domains arranged as a pentamer, each with a diameter of 20–25 Å, with the edges of the pentamer measuring ~45 Å (Fig. 3b and Extended Data Fig. 6).
Figure 3. The oligomeric state of ExbB within the Ton complex.
a. EM analysis was performed using 2D crystals (i) of the Ton subcomplex with a power spectrum out to ~30 Å (ii). Five images were analyzed, and a representative average projection map calculated from 900 sub-images shows the complex is pentameric (iii). b. The EM studies agree that ExbB is a pentamer with edges measuring ~45 Å. c. DEER spectroscopy was performed on the Ton subcomplex labeled with MTSL at position C25 of ExbB. The experimentally measured traces and distance distributions (inset) (red lines) agree well with those calculated from the in silico labeled ExbB (black dashed lines). d. DEER analyses of the Ton subcomplex agree that ExbB is a pentamer. e. Purification of the fully assembled Ton complex (orange). f. Comparison of distance distributions of the fully assembled Ton complex (solid orange line) to those of the Ton subcomplex in DDM lacking TonB (dashed red line) showed minimal differences. Panels c, e, and f are from single experiments.
The Ton subcomplex was also studied using double electron-electron resonance (DEER) spectroscopy, where ExbB was labeled at C25 using the spin label MTSL. From this, distance distributions were obtained experimentally and compared to simulations of the in silico labeled crystal structure (Fig. 3c and Extended Data Fig. 7). The experimental results agree well with the simulated distances with peaks at ~35 and 50–60 Å (Fig. 3d). Together with the crystal structure and EM studies, these results further verify the stoichiometry of ExbB as a pentamer within the Ton subcomplex containing a centralized TM pore (Fig. 3b, d).
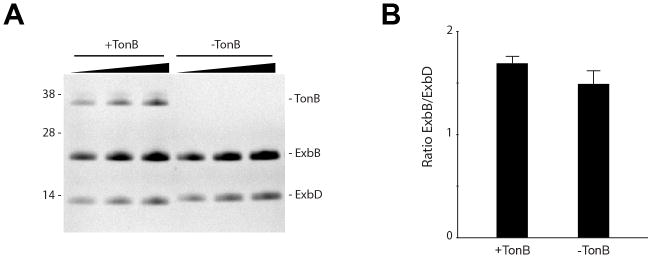
To determine the oligomeric state of ExbB in the presence of TonB, the fully assembled Ton complex was expressed and purified, and found to have a larger hydrodynamic radius than the ExbB/ExbD subcomplex (Fig. 3e and Extended Data Fig. 8). We then labeled ExbB at position 25 with MTSL and repeated the DEER spectroscopy analysis, finding that the distance distributions were nearly identical to the subcomplex (Fig. 3f and Extended Data Fig. 7), confirming that ExbB is a pentamer both in the absence and presence of TonB.
ExbD is a dimer in the Ton complex
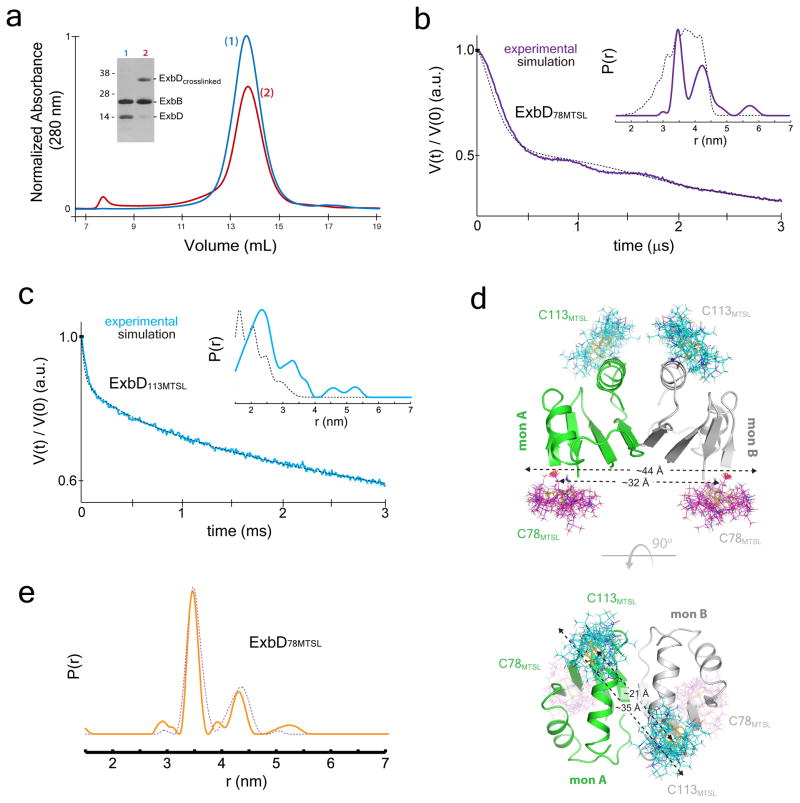
Previous studies have suggested that the Ton complex may contain a dimer of ExbD31. To investigate this further, we engineered an ExbBC25S/ExbDE113C construct of the Ton subcomplex. The sample was incubated with the crosslinker BM(PEG)2 and then separated by SEC and compared to a control sample that was not crosslinked (Fig. 4a). SDS-PAGE analysis confirmed the shift of ExbD from monomer to dimer for the crosslinked sample; however, no shift was observed by SEC, indicating that the ExbD-crosslinked dimer was formed within a single complex (intra) rather than between two different complexes (inter).
Figure 4. The oligomeric state of ExbD within the Ton complex.
a. Crosslinking studies targeting ExbD are consistent with a dimer within the Ton subcomplex, as evidenced by an observed crosslinked dimer (red, lane 2) compared to the non-crosslinked sample (blue, lane 1). b. DEER spectroscopy was performed on ExbD labeled at position 78 (purple lines) and position 113 (cyan lines) (panel c). The experimentally measured traces and distance distributions (inset) (purple and cyan lines) are consistent with those calculated (black dashed lines) from the in silico labeled ExbD dimer model (PDB ID 2PFU), which is based on the reported TolR structure (PDB ID 2JWK). d. The distance measurements within the in silico labeled ExbD dimer model are in agreement with those obtained experimentally at each site using DEER analysis. e. DEER spectroscopy was performed in DDM on the fully assembled Ton complex labeled at position 78 on ExbD. Comparison of distance distributions of the fully assembled Ton complex (solid orange line) to those of the Ton subcomplex in DDM lacking TonB (dashed purple line) showed minimal differences. Panels a, b, c, and e are from single experiments.
DEER spectroscopy was performed on the subcomplex by labeling ExbD at residues 78 and 113 individually, and constructs of ExbBC25S/ExbDN78C and ExbBC25S/ExbDE113C were labeled with the spin label MTSL. Distance distributions were detected experimentally and compared to simulations of an in silico labeled model of the ExbD dimer (PDB ID 2PFU)15, which was based on the related TolR dimer structure (PDB ID 2JWK)32 (Fig. 4b, c and Extended Data Fig. 7). According to the dimer model, labeling at residue 78 would yield distances between 32 – 44 Å, which is consistent with the peaks observed experimentally at 35 and 43 Å (Fig. 4b, d). Furthermore, labeling at residue 113 would yield distances from 21 – 35 Å, which is also consistent with the peaks observed experimentally at 23 and 34 Å, within the accuracy of the rotamer library approach (Fig. 4c, d and Extended Data Fig. 7).
To determine the oligomeric state of ExbD in the presence of TonB, DEER spectroscopy was performed on the fully assembled Ton complex containing the TonBC18A, ExbBC25S and ExbDN78C mutations and labeled with MTSL. The distance distributions for the labels on ExbD were nearly identical to the subcomplex (Fig. 4e and Extended Data Fig. 7), confirming that ExbD is a dimer both in the absence and presence of TonB.
Ton subcomplex channel properties
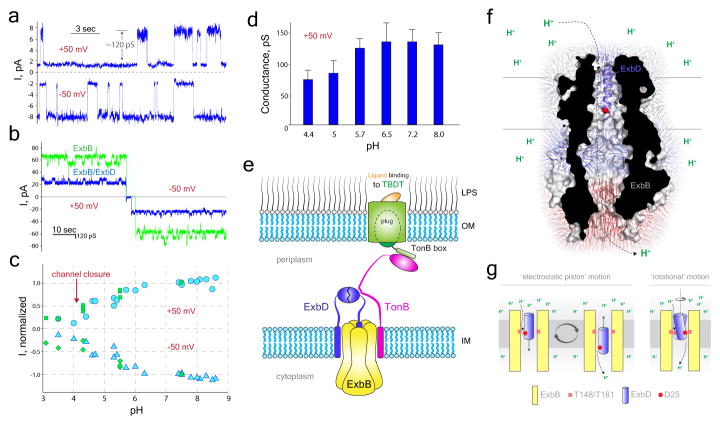
To investigate ion conduction by the Ton subcomplex (ExbB/ExbD)27,33, it was reconstituted into liposomes which were fused with a preformed planar bilayer membrane34. Single and multi-channel recordings revealed that channels formed by the Ton subcomplex display a 120+/−30 pS conductance at neutral pH (Fig. 5a,b), whereas channels formed by the ExbB pentamer are nearly twice as large with a 220+/−50 pS conductance (Fig. 5b). This is consistent with our structure which shows the TM helix of ExbD plugging the TM pore of the ExbB pentamer.
Figure 5. Channel properties of the Ton subcomplex.
a. Representative spectra for single channel measurements of the Ton subcomplex (n=15). b. Representative spectra of multichannel measurements performed on the Ton subcomplex (blue) and ExbB alone (green) (n=15 for each sample). c. Dependence of the macroscopic current amplitude on pH for the Ton subcomplex (blue) and the D25A mutation in the TM helix of ExbD (green) with a holding potential of +50 mV (circles and squares) or −50 mV (triangles and diamonds). d. Dependence of single channel conductance of the Ton subcomplex on pH was measured at +50 mV. Bars represent mean values with error bars showing standard deviation with n=5. e. Structural model for the Ton complex consisting of a pentamer of ExbB, a dimer of ExbD, and at least one TonB. f. The ExbB/ExbDΔperi complex showing electric fields for the ExbB pentamer. The modeled location of residue D25 of the TM helix of ExbD (purple helix) is indicated as a red sphere. g. Proposed mechanisms for how the Ton subcomplex may use the pmf for the production of energy.
Furthermore, ion selectivity of the channels was determined. Channels of the Ton subcomplex have a pronounced cation selectivity with 7-fold larger permeability for K+ compared with Cl− (Vrev, +24.7 ± 0.9 mV; pK+/pCl−, 7.0 ± 0.9) (Supplementary Table 2). Channels formed by the ExbB/ExbDΔperi complex are less cation selective (Vrev, +13.7 ± 4.5 mV; pK+/pCl−, 2.6 ± 1.0), which implies that the periplasmic domain of ExbD enhances cation selectivity. However, the ExbB pentamer is anion-selective (Vrev, −12.6 ± 2.8 mV; pK+/pCl−, 0.43 ± 0.09) (Supplementary Table 2), indicating that ExbDΔperi is sufficient to serve as a cation selective filter. The point mutation D25A, found within the TM helix of ExbD which sits in the pore of the ExbB pentamer, significantly decreases the cation selectivity of the Ton subcomplex (Vrev, +17.0 ± 1.5 mV; pK+/pCl−, 3.3 ± 0.5) (Supplementary Table 2), indicating a major contribution of D25 towards ion selectivity.
Channel activity of the Ton subcomplex has a pronounced pH dependence, showing a significant decrease in transmembrane current upon pH decrease from neutral to acidic (Fig. 5c). However, the TM helix of ExbD is not the major contributor to the observed pH dependence, as the D25A mutant shows nearly an identical pH dependence as observed for wild-type (Fig. 5c), suggesting that the unique electrostatic properties of the ExbB pentamer may be responsible. The decrease in transmembrane current amplitude in the pH range 4.5–8.0 is explained by a decrease in single channel conductance from 120 pS to 70 pS at pH 8.0 and 4.5, respectively (Fig. 5d). Below pH 4.5, the decrease in transmembrane current is caused by channel closure at both positive and negative potentials (Fig. 5c). The ion channel conductance properties of the Ton subcomplex demonstrate that it is being modulated by pH, possibly caused by movement of the TM helix of ExbD within the TM pore of the ExbB pentamer, such that at low pH, the TM helix of ExbD is in a more closed/fixed conformation (Fig. 2b).
Model for a fully assembled Ton complex
Based on our work, we propose a model where the Ton complex consists of a pentamer of ExbB, a dimer of ExbD, and at least one TonB (Fig. 5e and Extended Data Fig. 9). Since only a single TM helix can fit within the TM pore of ExbB, and dimerization of ExbD is hypothesized to be mediated by its periplasmic domain, we propose that a second copy of ExbD is located outside of the ExbB pentamer. Previous studies have indicated that TonB may exchange for one of the ExbD monomers during energy transduction17. However, our studies show that association of TonB does not significantly affect the structure or stoichiometry of ExbB or ExbD within the Ton complex. The interaction of TonB with ExbD represents the functional Ton complex, triggering energy production and transduction in the form of conformational changes in TonB that lead to ligand uptake by the transporter at the OM35,36.
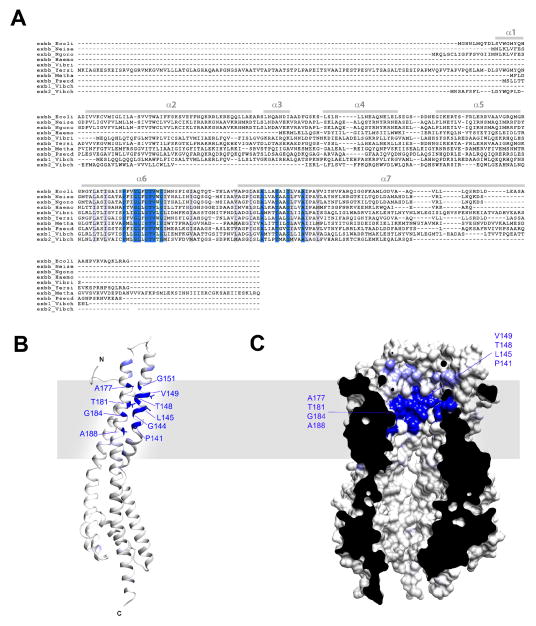
The Ton complex relies on the pmf for its function27,33 and it has been proposed that the Ton complex acts as a proton-conducting channel that shuttles protons from the periplasm to the cytoplasm and this powers a mechanical motion within the complex20. Mutagenesis studies have previously identified a number of residues that are necessary for harnessing the pmf, including D25 of ExbD and T148 and T181 of ExbB37,38. These residues all map to the interior of the TM pore of ExbB where protons would be translocated (Extended Data Fig. 10). Our studies indicate that the TM helix of ExbD is quite dynamic within the TM pore of ExbB, and together with the electrophysiology experiments, show that this dynamic behavior can be modulated by pH. The electrostatics of the ExbB pentamer may also create an ‘electrostatic funneling’ effect which assists in drawing protons from the periplasm and steering them through the TM pore of ExbB into the cytoplasm (Fig. 5f). Therefore, we suggest two plausible mechanistic models for how the Ton complex harnesses the pmf for energy production and transduction (Fig. 5g). The first is the ‘electrostatic piston’ model, where the TM helix of ExbD moves translationally within the TM pore of ExbB, thereby creating a piston-like motion. And the second is the ‘rotational’ model, where the TM helix of ExbD rotates within the TM pore of ExbB, creating rotational motion. A combination of the two mechanistic models is also plausible. While we observe minor conformational shifts within the TM helices of ExbB in our structures, it is also feasible that the ExbB pentamer cycles through more pronounced conformations to either drive or accommodate the dynamics of the TM helix of ExbD.
Methods
Cloning of E. coli (K-12 strain) ExbB, ExbD, and TonB constructs and mutants
The ExbB construct with and without a C-terminal 6x-His tag was subcloned into pET26b (Novagen). ExbD was subcloned into pACYCDuet-1 vector (Novagen) with an N-terminal Strep-tag and a C-terminal 10x-His tag. ExbD was also subcloned into pCDF-1b vector (Novagen) containing a C-terminal TEV protease site followed by a 10x-His tag. An ExbDΔperi construct containing a C-terminal TEV protease site [preceded by a Gly-Gly-Gly linker for efficient digestion by TEV protease] followed by a 10x-His tag was constructed by deletion of the sequence encoding the periplasmic domain of ExbD (residues 50 – 141). TonB was cloned into pACYCDUET-1 vector with an N-terminal 10x-His tag followed by a TEV protease site. Mutants of TonB (C18A), ExbD (D25A, N78C and E113C), and ExbB (C25S) were prepared by site-directed mutagenesis (primer sequences for all cloning and mutagenesis experiments are available upon request). The sequences of all plasmid constructs and mutations were verified by sequence analysis (Macrogen USA and Eurofins Genomics GmbH).
Expression and purification of the Ton complex, subcomplexes, and components
Expression of ExbB with a C-terminal 6x-His tag was performed by transforming E. coli BL21(DE3) cells (NEB) with the pET26b/ExbB vector. Co-expression was performed by co-transforming E. coli BL21(DE3) cells with the respective ExbB, ExbD, and/or TonB plasmids. For all transformations, cells were plated onto LB agar plates supplemented with appropriate antibiotics. Colonies were then used for a starter culture to inoculate twelve flasks containing either 1 L of 2xYT medium (Ton subcomplex) or SelenoMet Media supplemented with L-methionine at 40 mg/L (Molecular Dimensions) (Ton complex), with appropriate antibiotics. Cultures were grown at 37°C with shaking at 220 rpm until OD600 of 0.5 – 1.0, induced with isopropyl β-D-1-thiogalactopyranoside (IPTG) to 0.1 mM final concentration, and then allowed to continue to grow overnight at 28°C. For selenomethionine-substituted samples for experimental phasing, B834(DE3) cells (NEB) were co-transformed with pET26b/ExbBC25S and pCDF-1b/ExbDΔperi plasmids. Single colonies were used to inoculate twelve flasks containing 1 L SelenoMet Medium (Molecular Dimensions) supplemented with 40 mg/mL L-selenomethionine and appropriate antibiotics. Cultures were grown at 37°C with shaking at 220 rpm until OD600 of 0.5 – 1.0, induced with IPTG to 0.1 mM final concentration, and then allowed to continue to grow overnight at 28°C. Cells were harvested and used immediately or stored at −80°C.
For purification, cells were resuspended in either 1x PBS (Ton subcomplex) or TBS (Ton complex) supplemented with 100 μM 4-(2-aminoethyl)benzenesulfonyl fluoride (AEBSF), 100 μM DNAse, and 50 μg/ml lysozyme, and disrupted with two passages through an EmulsiFlex-C3 (Avestin) operating at ~15,000 psi. Membranes were pelleted by ultracentrifugation in a Type 45 Ti Beckman rotor at 200,000 × g for 1 hr at 4°C. Membranes were then resuspended in 1x PBS or TBS using a dounce homogenizer and solubilized by the addition of Triton X-100 (Ton subcomplex) or DDM (Anatrace) (Ton complex) to a final concentration of 1% by stirring at medium speed for 1 hr to overnight at 4°C. Insoluble material was pelleted by ultracentrifugation in a Type 45 Ti Beckman rotor at 200,000 × g for 1 hr at 4°C and the supernatant was used immediately.
Immobilized metal affinity chromatography (IMAC) was performed on an AkTA Purifier (GE Healthcare) using a 15 mL Ni-NTA agarose column (Qiagen) equilibrated with 1x PBS or TBS supplemented with 0.1% Triton X-100 or 0.1% DDM. The supernatant was supplemented with 10 mM imidazole and loaded onto the column. The column was washed in three steps with 1x PBS or TBS supplemented with 20, 40 and 60 mM imidazole, respectively, and eluted with 1x PBS or TBS supplemented with 250 mM imidazole in 2 mL fractions. Fractions were analyzed by SDS-PAGE and those fractions containing the complex were pooled. To remove the 10x-His tag, TEV protease was added to the sample at 0.1 mg/mL final concentration and rocked overnight at 4°C. For the Ton complex, the sample was then diluted 2–3 times with 25 mM HEPES, pH 7.3, and 0.1% DDM and loaded onto an anion exchange 6 ml ResourceQ column (GE Healthcare). Elution was performed with a 0–1 M NaCl gradient over 5 column volumes. For the Ton subcomplex, the sample was concentrated using an Amicon Ultra-15 Centrifugal Filter Unit with a 50 kDa MW cut-off (Millipore), filtered, and purified by size-exclusion chromatography using a Superdex 200 HL 16/600 column (GE Healthcare) at a flow rate of 0.5–1.0 mL/min. The buffer consisted of 20 mM HEPES-NaOH, pH 7.0, 150 mM NaCl, 0.01% NaN3, and 0.08% C10E5. For the Ton complex, eluted fractions were concentrated using an Amicon Ultra-15 Centrifugal Filter Unit with a 100 kDa MW cut-off (Millipore), and passed over a Superose6HR 10/30 column (GE Healthcare) at a flow rate of 0.5 mL/min using 20 mM HEPES-NaOH, pH 7.0, 150 mM NaCl, and 0.05% DDM.
Densitometry analysis was performed using ImageJ software41.
Circular dichroism
Far-UV circular dichroism (CD) spectra (185–260 nm) were measured in 0.1 M NaPi, pH 7.0, and 0.03% DDM using quartz cuvettes with a 0.02 – 0.2 mm optical path length. The results were analyzed using the DichroWeb package of programs42 and different sets of reference proteins, including the SMP180 set of membrane proteins. The analysis of the thermal stability of the complexes reconstituted into liposomes was measured by the temperature dependence of the CD signal amplitude at 222 nm. Thermal melting was performed in a magnetically stirred 1 cm quartz cuvette containing 10 mM HEPES, pH 7.0, and 100 mM NaCl with a rate of temperature increase of 0.5°C/min. Melting curves were normalized to the measured value of the molar ellipticity change at 10°C.
Crystallization and data collection
For crystallization, samples were concentrated to ~10 mg/ml and sparse matrix screening was performed using a TTP Labtech Mosquito crystallization robot using hanging drop vapor diffusion and plates incubated at 15 – 21°C. Initially, many lead conditions were observed producing crystals with hexagonal morphology; however, none diffracted to better than ~7 Å and most suffered from anisotropy. To avoid this packing, we performed reductive methylation of our samples prior to crystallization using the Reductive Alkylation Kit (Hampton Research), followed by an additional size exclusion chromatography step. This led to a condition which produced diffraction spots to ~4 Å resolution. Further optimization and screening allowed us to grow crystals in 100 mM Na-acetate, pH 4.5, 100 mM MgCl2, and 25% PEG 400 that routinely diffracted ~3.5 Å resolution or better. For heavy atom soaking, crystals were transferred to a drop containing 1 mM HgCl2 and incubated overnight at room temperature and then harvested directly from the soaking condition. The best native crystals for the ExbB/ExbDΔperi complex, however, were grown from 100 mM HEPES-NaOH, pH 7.0, 100 mM CaCl2, and 22% PEG MME 550 and diffracted to 2.6 Å resolution; these crystals were also used for heavy atom soaking experiments. Unfortunately, none of the heavy atom soaked crystals (nor selenomethionine substituted crystals) were useful for phasing due to crystal pathologies which we suspected was twinning related. However, selenomethionine substituted crystals of the ExbBC25S/ExbDΔperi complex were obtained using 100 mM MES/imidazole, pH 6.5, 30 mM MgCl2, 30 mM CaCl2, 50% ethylene glycol, and 8% PEG 8000 and diffracted to 5.2 Å resolution with no twinning related issues. Both native and selenomethionine-substituted crystals were harvested directly from the crystallization drops. Screening for diffraction quality was performed at the GM/CA-CAT and SER-CAT beamlines at the Advanced Photon Source at Argonne National Laboratory and at beamlines 5.0.1 and 8.2.1 at the Advanced Light Source at Lawrence Berkeley National Laboratory. Final datasets were collected at the SER-CAT beamline and all data were processed using either HKL200043 or Xia244. A summary of the data collection statistics can be found in Supplementary Table 1. The presence of both components of the Ton subcomplex within the crystals was confirmed by SDS-PAGE and mass spectrometry analyses of harvested crystals.
Structure determination
For phasing the ExbB/ExbDΔperi complex structure, three datasets were collected on selenomethionine substituted crystals of the ExbBC25S/ExbDΔperi complex at a wavelength of 0.979 Å. The data were processed with Xia244 and based on non-isomorphism, one dataset was removed. The final two datasets were processed together in space group P43212 to a final resolution of 5.2 Å. Selenium sites (35 total) were located using HKL2MAP45 after 5000 tries within SHELXD at a resolution range of 20 – 6 Å. The sites were then fed into AutoSol (PHENIX)46 which removed 1 site, producing a phase-extended density-modified electron density map which we could build an initial poly-alanine model into. Five-fold symmetry was clearly observed with each monomer consisting of very elongated α-helices and directionality was determined based on the predicted topology of ExbB, which contains a single large cytoplasmic domain. This model was then used as a search model to solve the native and Hg-soaked structures by molecular replacement using PHASER/PHENIX46,47 and the sequence docked based on anomalous peaks from the SeSAD dataset. The ExbB/ExbDΔperi complex was solved in space group P21 to 2.6 Å resolution with R/Rfree values of 0.21/0.26 and the Hg-soaked structure in space group P212121 to 3.5 Å resolution with R/Rfree values of 0.25/0.30. All model building was performed using COOT and subsequent refinement done in PHENIX46. RMSD analysis was performed within PyMOL (Schrödinger). Electrostatic surface properties (calculated using the Linearized Poisson-Boltzman Equation mode with a Solvent Radius of 1.4), including generation of the electric field lines, were analyzed and visualized using the APBS plugin within PyMOL (Schrödinger). Buried surface area was calculated using the PDBePISA server48. Structure-related figures were made with PyMOL (Schrödinger) and Chimera49 and annotated and finalized with Adobe Photoshop and Illustrator.
Data availability
Coordinates and structure factors for the ExbB/ExbD complexes have been deposited into the Protein Data Bank (PDB accession codes 5SV0 and 5SV1).
Two-dimensional (2D) crystallization
For two-dimensional (2D) crystallization experiments, the Ton subcomplex (ExbB/ExbD) was extracted and purified by IMAC as previously described. The sample was passed over a Superose 12 HR 10/30 column using 20 mM Tris-HCl, pH 7, 150 mM NaCl, 0.01% NaN3, and 0.035% Triton X-100. The purified complex was then mixed with a solution stock of E. coli polar lipid (Avanti Polar Lipids, Inc) at 10 mg/ml in 2% Triton X-100, to reach final concentrations of 0.5–1.0 mg/mL protein and 0.1 to 0.4 mg/mL lipid. The lipid-protein-detergent samples solution were placed into Mini Slide-A-Lyser dialysis devices (Pierce) with a 20 kDa MW cutoff, and dialyzed in 1 L of 25 mM Tris-HCl, pH 7.0, 150 mM NaCl, and 0.01% NaN3 at 4°C. Aliquots of dialyzed samples were observed periodically by electron microscopy to monitor the formation of 2D crystals.
Electron microscopy
Sample preparation for electron microscopy was carried out by applying a 5 μL drop of protein-lipid material on a glow discharged carbon-coated electron microscopy grid. Staining was performed by addition of 1% (w/v) uranyl acetate and incubation for 1 min. Grids were then imaged on a Tecnai G2 200 LaB6 electron microscope operating at 200 kV at the Institut de Microbiologie de la Méditerranée. Images were recorded with a 2K Eagle CCD camera.
The best 2D crystals were selected through observation of the power spectrum of the images using the ImageJ software41. Selected images were processed using the IPLT Correlation Averaging suite program50. A filtered image was generated by optical filtering of the low resolution spots, and padded to contain only 4–6 unit cells. The padded image was cross-correlated with the original large image. The positions of the cross-correlation peaks were determined and used to extract sub-images that were summed to generate an average image of the two-dimensional unit cell.
Double electron-electron resonance spectroscopy
Site-directed spin labeling was used to covalently attach the spin label (1-Oxyl-2,2,5,5-tetramethyl-Δ3-pyrroline-3-methyl) methanethiosulfonate (MTSL) (Toronto Research Chemicals) to Cys25 on ExbB and to cysteines engineered at positions 78 and 113 on ExbD (N78C, E113C; ExbD constructs were in the pACYC vector containing an N-terminal strep-tag and a C-terminal 10x-HIS tag for the Ton subcomplex, and in the pCDF-1b vector for the Ton complex). For labeling with MTSL, samples were first incubated with 2–10 mM dithiothreitol (DTT) for 1–2 hr and the DTT then removed by passage over a HiTrap desalting column (GE Healthcare) or during anion exchange (Ton complex). Samples were then incubated with a 10x molar excess of MTSL overnight at 4°C and then passed over a Superose 6HR 10/30 gel filtration column (GE Healthcare) using 20 mM HEPES-NaOH, pH 7.5, 200 mM NaCl, 0.08% C10E5 or 0.03% DDM (Ton subcomplex); or 20 mM HEPES-NaOH, pH 7.0, 150 mM NaCl, and 0.05% DDM (Ton complex).
For double electron-electron resonance (DEER) measurements, the samples were diluted with D2O to a final concentration of 30% and cryoprotected with 10% v/v D8-glycerol prior to being flash frozen in liquid nitrogen. Continuous Wave (CW) EPR experiments were carried out at room temperature on a bench-top X-band MiniScope MS 400 (Magnettech by Freiberg Instrument) at 9.5 GHz (X-band) with 2.5 mW microwave power, 15 mT sweep width, 0.15 mT modulation amplitude. Spin labeling efficiency was calculated based on the second integral of the derivative spectra compared to a standard spin concentration of 100 μM (Tempol in water). The ExbB native cysteine C25 was labeled with a 50% efficiency, while the ExbD mutants were labeled with efficiencies > 80%. DEER measurements were initially performed at ETH Zurich on a commercial Bruker ELEXSYS-II E580 Q-band spectrometer (34–35 GHz) and later on a Bruker ELEXSYS E580Q-AWG dedicated pulse Q-band spectrometer operating at 34–35 GHz at FU Berlin. Both spectrometers were equipped with a TWT amplifier (150 W) and a home-made rectangular resonator (from ETH Zurich) enabling the insertion of 30–40 μL of sample volume in quartz tubes with 3 mm outer diameter51. Dipolar time evolution data were acquired using the four-pulse DEER experiment at 50 K. All pulses were set to be rectangular with 12 ns length, with the pump frequency at the maximum of the echo-detected field swept spectrum, 100 MHz higher than the observer frequency. Deuterium nuclear modulations were averaged by increasing the first interpulse delay by 16 ns for 8 steps as previously described51. The background of the normalized DEER primary data (V(t)/V(0)) was fitted with optimized dimensions from 2.5 to 3.2 and the resulting normalized secondary data (F(t)/F(0)) were converted by model-free Tikhonov regularization to distance distributions with the software DeerAnalysis201552,53. The simulation of the possible spin label rotamers populated at selected positions in the protein was performed using the Matlab program package MMM2015.1 using the MTSL ambient temperature library54.
Crosslinking
The ExbBC25S/ExbDE113C complex (ExbDE113C was in the pACYC vector containing an N-terminal strep-tag and a C-terminal 6x-HIS tag) was expressed and purified as described earlier. To prepare the sample for crosslinking, the sample was incubated at 4°C with 5 mM DTT for at least 1 hr. The DTT was then removed using a desalting column in 20 mM HEPES, pH 7.0, 150 mM NaCl, and 0.1% DDM. The crosslinker 1,8-bismaleimidodiethylenglycol (BM(PEG)2) (Pierce) was added at a final concentration of 0.2 mM and the reaction was incubated at 4°C overnight. The sample was concentrated and passed over a Superose 6HR 10/30 gel filtration column using 20 mM HEPES-NaOH, pH 7.0, 150 mM NaCl, and 0.035% DDM on an AkTA Purifier system (GE Healthcare). The results were visualized by SDS-PAGE analysis.
Reconstitution in liposomes
Protein complexes were reconstituted into liposomes by dialysis of the protein/lipid/detergent mixture. Lipids (DOPG, DOPC and DOPE) dissolved in chloroform were mixed in a molar ratio 2:3:5. Chloroform was removed by vortexing in a stream of nitrogen gas in a glass tube followed by drying in vacuum for 2–3 hr. The lipid film was hydrated in 1 ml TN buffer (10 mM Tris-HCl, pH 7.5, 50 mM NaCl), followed by 5 cycles of freeze-thaw and sonication using a water bath sonicator until the suspension of lipids became clear (10–15 min). For proteoliposome preparation, small unilamellar vesicles (SUVs) were mixed with octylglucoside (final concentration, 2%) and then proteins added to achieve a molar ratio of total lipid to protein ≈500–2000 mol/mol. After 1 hr incubation in ice, the lipid/protein/detergent mixture was dialyzed into 10 mM Tris-HCl, pH 7.5, 0.3 M sucrose, and 50 mM KCl for 30–40 hr using a dialysis membrane with a MW cut-off pore size of 10 kDa.
Planar-lipid bilayer measurement of ion-conduction
Mueller-Rudin type planar bilayer membranes were formed on a 0.2 mm diameter aperture in a partition that separates two 1 mL compartments, using a mixture of lipids, DOPG, DOPC and DOPE, at a molar ratio 2:3:5 (10 mg/mL) in n-decane, applied by a brush technique55. The aqueous solution in both compartments consisted of 2 mM KPi, pH 7.0, and 0.1 M and 0.4 M KCl in cis- and trans-compartments, respectively. To study the pH dependence of channel activity, bathing solutions were buffered with 2 mM Na-acetate (pK 4.8), Na-cacodylate (pK 6.2), and Tris (pK 8.3). The pH of the bathing solution was changed by adding 10 – 20 μL 0.1 M HCl or KOH. The cis-side of the planar bilayer is defined as that to which the electrical potential is applied. Proteoliposomes, 0.1–2 μL, were added to the trans-compartment, and the solutions were stirred until the transmembrane current appeared. A large concentration of an osmolyte inside of the liposomes and the transmembrane KCl concentration gradient caused proteoliposome fusion with the pre-formed planar lipid membrane bilayer. The transmembrane current was measured in voltage-clamp mode with Ag/AgCl electrodes and agar bridges, using a BC-525C amplifier (Warner Instruments, Hamden, CT). Single channel conductance of the ExbB/ExbD complexes was performed in symmetrical salt conditions: 0.1 M KCl solution, pH 7.5, at a holding potential of +50 or −50 mV. For ion selectivity experiments, zero-current potential (Vrev) was determined from volt-ampere characteristics measured in asymmetric salt conditions. Relative cation/anion permeability was calculated using the Goldman-Hodgkin-Katz equation56.
Extended Data
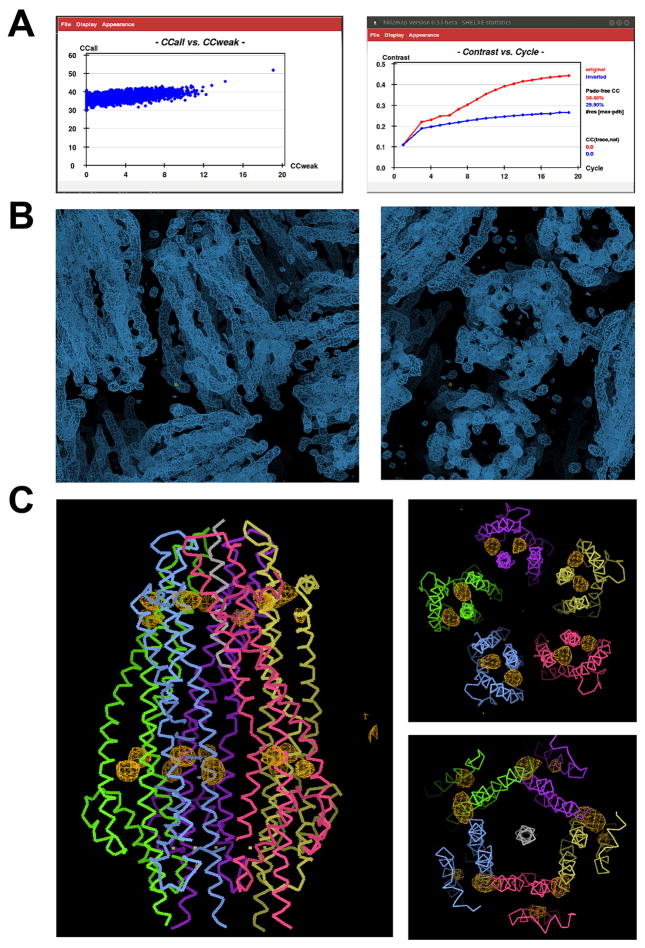
Extended Data Figure 1. Structure determination for the Ton subcomplex (ExbB/ExbDΔperi) using Se-SAD at 5.2 Å resolution.
A. The initial structure of the Ton subcomplex was solved by Se-SAD using anisotropic data extending to 5.2 Å resolution. The data from two crystals was processed with Xia2 and the initial sites found using HKL2MAP v0.3, which found a single solution every ~10,000 tries; resolution limits were also important for finding a solution. B. The sites were then input into AUTOSOL/PHENIX for site refinement and density modification, producing density maps (blue mesh) which clearly showed 5-fold symmetry and allowed an initial model of a monomer to be built, consisting almost entirely of α-helices. This model was then used as a search model for molecular replacement to solve the 2.6 Å native structure (data obtained from a single crystal). C. Anomalous different map (orange mesh) showing density for the selenium sites in the 5.2 Å Se-incorporated structure.
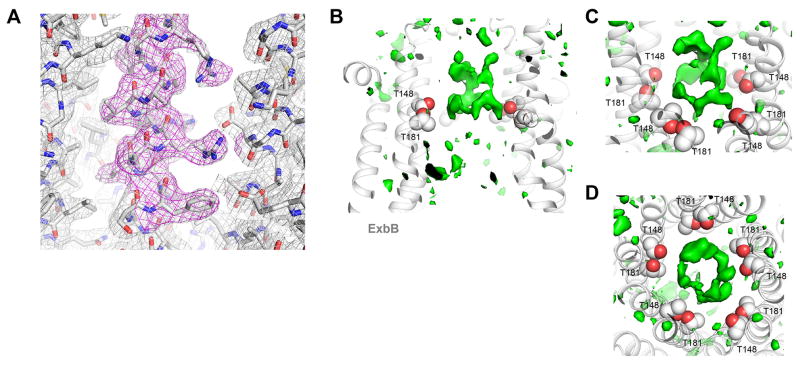
Extended Data Figure 2. Representative electron density for the native Ton subcomplex (ExbB/ExbDΔperi) solved to 2.6 Å resolution.
A. Representative electron density map (2Fo−Fc contoured at 1.0σ, gray mesh; 2Fo−Fc omit map (omitting residues 113–124) contoured at 1.0 σ, magenta mesh) along residues 113 – 124 within helix α5. B. Cutaway view of the TM pore of ExbB (gray ribbon) from the native structure at pH 7.0 showing ring-like difference density (green isosurface, Fo−Fc map contoured at 2.5 σ) along the conserved residues T148 and T181 (gray and red spheres). C. Tilted view and an orthogonal view (C; relative to panel A) of the ring-like density. Structures were determined using data obtained from a single crystal in each case.
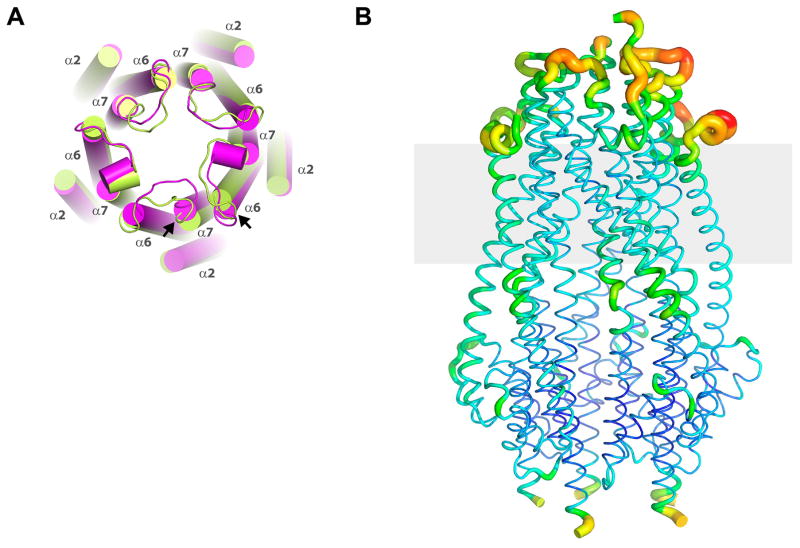
Extended Data Figure 3. Helical shifts and overall flexibility in the ExbB pentamer.
A. Two pentamers were observed per asymmetric unit within the crystal structure. Shown here is pentamer 1 (green) aligned with pentamer 2 (magenta), illustrating slight shifts in a number of the helices (cylinders) between the two pentamers, with the largest shifts indicated by the black arrows. Further, the loops connecting α6 and α7 also show variability between monomers and pentamers. B. The TonB subcomplex (ExbB/ExbDΔperi) showing a B-factor putty representation with values ranging from the most ordered in blue to the most disordered in red.
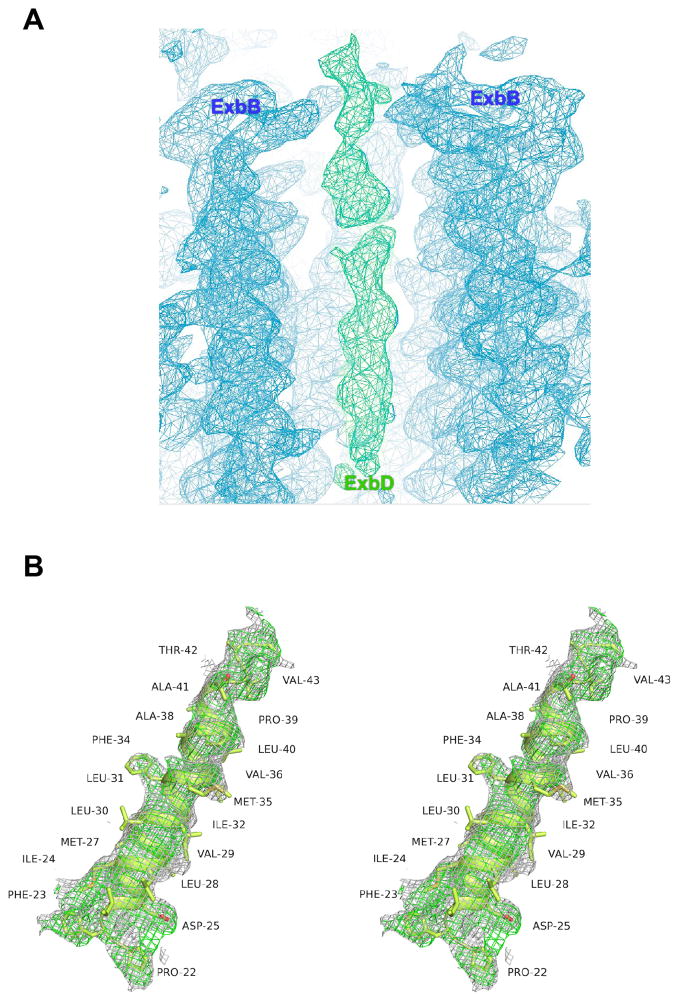
Extended Data Figure 4. Electron density for the TM helix of ExbD.
A. Omit map (2Fo−Fc, contoured at 1.0 σ) along the TM pore of ExbB. The density corresponding to the ExbB pentamer is shown in blue mesh, while the density corresponding to the TM helix of ExbD is shown in green mesh. B. Stereoimage showing the density (2Fo−Fc, contoured at 0.8 σ, gray mesh; 2Fo−Fc omit map (omitting the TM helix of ExbD), contoured at 0.8 σ, green mesh) for the the TM helix of ExbD after building and refinement.
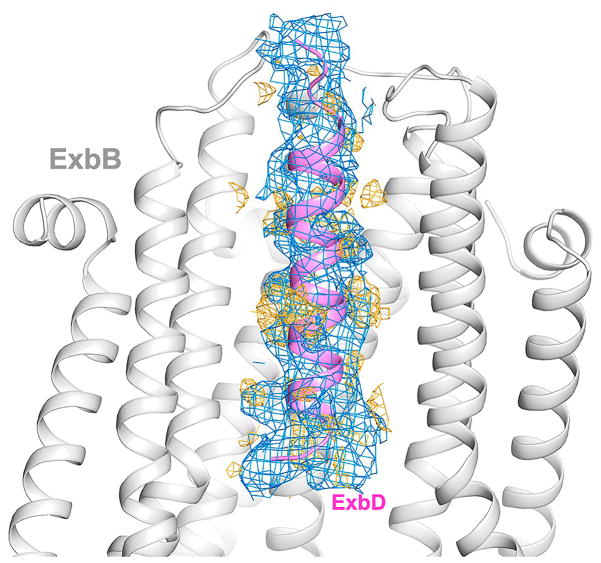
Extended Data Figure 5. Comparison of observed density for crystal structures of ExbB/ExbDΔperi solved at pH 7.0 versus pH 4.5.
The presence of electron density for the TM helix of ExbD (magenta ribbon) was dependent on the pH at which the crystals were grown. At pH 7.0, we observed little density (orange mesh) inside the TM pore of the ExbB (gray ribbon) pentamer (see also Extended Data Fig. 3). However, for the structures solved at pH 4.5, we observed clear density (blue mesh) for the TM helix of ExbD, albeit to varying degrees. Density maps (2Fo−Fc) are contoured at 1.0 σ.
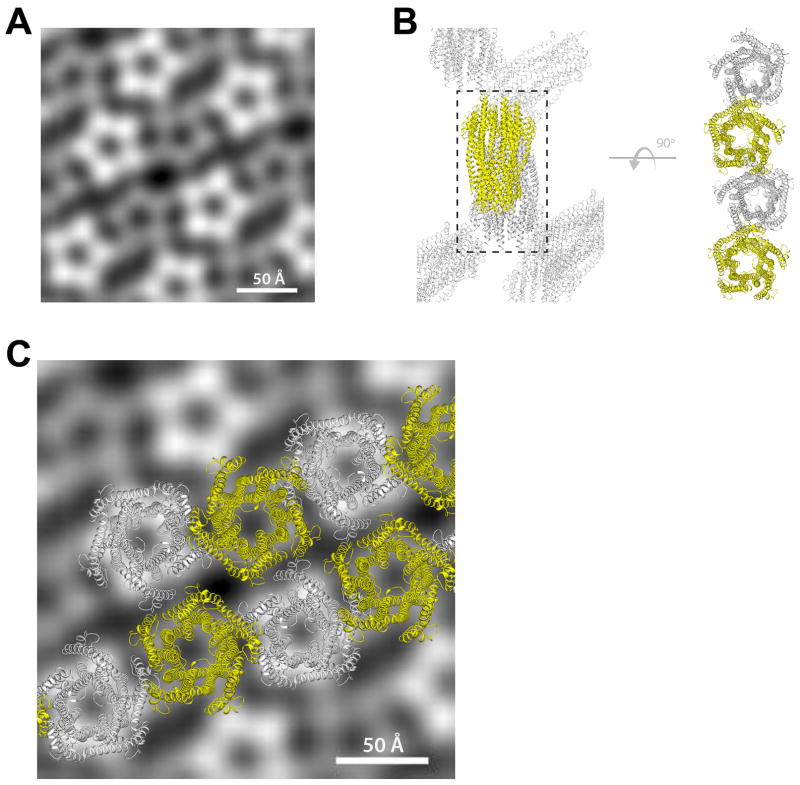
Extended Data Figure 6. Packing similarities of both the 2D and 3D crystals used for EM and X-ray crystallography.
A. Averaged projection map from the EM analysis on 2D crystals. Five images were analyzed, and a representative average projection map was calculated from 900 sub-images. The averaged map shows two different populations of the pentamer which are similar in size but differ in level intensity due to opposite orientations of the complex within the crystal; a similar packing arrangement was also observed in our crystal structures. ExbD was not detected in our EM studies, likely due to disorder of the globular domain which is anchored to the membrane by a long unstructured linker15. B. Packing of the complex in the X-ray crystal structure from 3D crystals. The right side indicates an orthogonal view highlighting a single row of molecules from the lattice (black dashed box). C. Fitting the row of molecules from the 3D lattice (X-ray) from panel B onto the averaged projection map from the 2D crystals (EM) to highlight the consistency observed in packing.
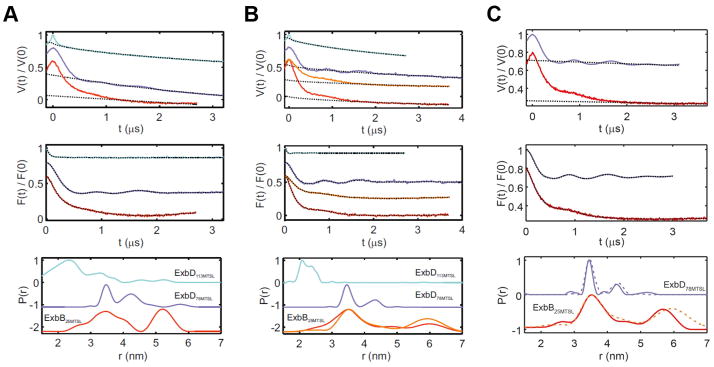
Extended Data Figure 7. DEER traces and analysis.
Ton subcomplex (ExbBC25/ExbD, ExbBC25S/ExbDN78C, and ExbBC25S/ExbDE113C) in 0.08% C10E5 (panel A) and in 0.03% DDM (panel B), and the fully assembled Ton complex (TonBC18A/ExbBC25/ExbD and TonBC18A/ExbBC25S/ExbDN78C) in 0.05% DDM (panel C). Upper panels, experimental Q-band DEER primary data V(t)/V(0) (colored lines, cyan ExbD113MTSL; violet ExbD78MTSL; red and orange, ExbB25MTSL) and simulated background functions (dotted line). Middle panels, DEER traces after background correction (colored lines) and fit with DeerAnalysis2015 (dotted lines) with Tikhonov regularization parameters from 10 to 100 adjusted via L-curve analysis and data validation. Lower panels, obtained distance distributions. For the pentameric ExbB sample (50% labeling efficiency), a modulation depth > 0.45 was obtained, indicating the presence of a multi-spin system. For the sample solubilized in DDM, longer DEER traces were obtained (4 μs) to better characterize the long distance peak of 5–6 nm in ExbB25MTSL. Additionally, for all panels, another DEER trace was measured after decreasing the microwave power of the 12 ns pump pulse to 25% (orange line) to suppress ghost peaks arising from the presence of more than two spins in the system. The resulting distance distribution (orange) was found to be very similar to that obtained with 100% microwave power (red), showing that no ghost peak artifacts were present. The lower modulation depth observed for the ExbD samples labeled at position 113 with respect to those labeled at position 78 (both labeling efficiency > 80%) may be due to the presence of distances < 1.5 nm (predicted by the simulations), which are outside of the sensitivity range of the technique or by destabilization of the ExbD dimer induced by the label. The bottom of panel C shows a comparison of the Ton subcomplex in DDM (dashed lines from panel B) to the fully assembled Ton complex (solid lines). All panels are from single experiments.
Extended Data Figure 8. Densitometry of the purified fully assembled Ton complex.
A. SDS-PAGE gel of the Ton complex (+TonB) and the Ton subcomplex (−TonB) at increasing concentrations. B. Bar graph showing the comparison of the ExbB/ExbD ratio within the Ton complex (+TonB) and the Ton subcomplex (−TonB) indicating that association of TonB with the Ton subcomplex does not change the stoichiometric ratio of the components. While we see a slight difference in the ExbB/ExbD ratio values in the presence or absence of TonB, the observed difference is too small to suggest an altered stoichiometry between ExbB and ExbD. Three representative lanes for each sample are shown in panel A; however, five lanes were used for all calculations. Densitometry analysis was performed with ImageJ and mean values and standard errors calculated using Microsoft Excel. For purifications of the Ton complex (+TonB), five purification experiments were performed and one representative is shown. For purifications of the Ton subcomplex (−TonB), ~50 purifications were performed and one representative is shown.
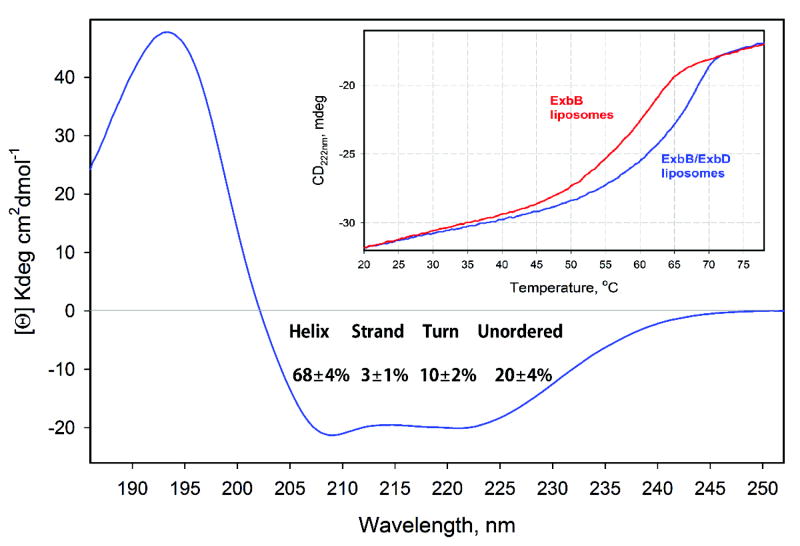
Extended Data Figure 9. Circular dichroism (CD) analysis of secondary structure and thermal stability of the Ton subcomplex.
Far-UV CD spectrum (185–260 nm) of the Ton subcomplex (ExbB/ExbD) with the calculated percentage of secondary structure shown. Contents of regular and distorted α-helical structures, 47 and 21%, respectively, were combined during the calculation of secondary structure contributions. Inset: comparison of the thermal stability of the Ton subcomplex (blue) vs ExbB alone (red) measured through the temperature dependence of the CD signal amplitude at 222 nm. Both panels are from a single experiment.
Extended Data Figure 10. Sequence conservation of ExbB orthologs mapped onto the crystal structure.
A. Clustal W alignment of ExbB sequences from: E.coli K12 (P0ABU7), Neisseria meningitidis (P64100), Neisseria gonorrhoeae (Q5F711), Haemophilus ducreyi (O51808), Vibrio harveyi (D0XEN5), Yersinia pestis (D1TTA4), Methanothermobacter thermautotrophicus (O27101), Pseudomonas aeruginosa (G3XCW0), ExbB1 of Vibrio cholerae (O52043) and ExbB2 of Vibrio cholerae (AAC69454). B. Conservation mapped onto the ExbB structure with Chimera, the most conserved residues are in blue and found in α6 (TM2) and α7 (TM3) of the ExbB structure. An extensive alignment that also includes sequences from the Tol and Mot systems shows similar results22. C. Cutaway molecular surface of ExbB pentamer with the most conserved residues mapped onto the surface.
Supplementary Material
Acknowledgments
We thank the respective staffs at the SER-CAT and GM/CA-CAT beamlines at the Advanced Photon Source (APS), Argonne National Laboratory. Use of the APS is supported by the US DOE, Office of Science, Office of Basic Energy Sciences, under Contract No. W-31-109-Eng-38, and by the US DOE, Basic Energy Sciences, Office of Science, under contract No. DE-AC02-06CH11357; the staffs at beamlines 5.0.1 and 8.2.1, Advance Light Source at Lawrence Berkeley National Laboratory for their assistance during crystal screening, the Advanced Light Source is supported by the Director, Office of Science, Office of Basic Energy Sciences, of the U.S. DOE under Contract No. DE-AC02-05CH11231; G. Jeschke (ETH Zurich) for providing the Q-band resonator, T. Assafa for the reproducibility measurements, the Deutsche Forschungsgemeinschaft for funding the AWG E580 Q-band spectrometer (INST 130/972-1 FUGG); Yan Li at the NINDS/NIH Protein/Peptide Sequencing Facility for performing mass spectrometry analysis; and members of RL team, E. Cascales, J. Sturgis and JP Duneau for discussions. NN is supported by the Department of Biological Sciences, Purdue University and by the National Institute of Allergy and Infectious Diseases (1K22AI113078-01). EB is supported by the Cluster of Excellence RESOLV (EXC 1069) funded by the Deutsche Forschungsgemeinschaft. WAC is supported by the NIH (NIH GM 038323) and the Henry Koffler Professorship at Purdue University. RL is supported by grants from the Agence National de la Recherche (BACMOLMOT [ANR-14-CE09-0023]) and from Projets internationaux de coopération scientifique (PICS05853). HC, TB, IB and SKB are supported by the Intramural Research Program of the NIH, NIDDK.
Footnotes
Supplementary Information is linked to the online version of the paper at www.Nature.com/nature.
Author Contributions
MS prepared the ExbB wild-type construct. HC, NN, TB, and RL prepared ExbD constructs and mutants of ExbB and ExbD. TB prepared the TonB constructs. HC performed all expression and purification for assays, EM, DEER, electrophysiology, and crystallization. HC and NN performed crystallization and HC, NN, and IB did screening and data collection. NN solved the initial crystal structure using crystals grown by HC. HC performed the EM experiments. EB performed the DEER experiments. SZ and WC performed the electrophysiology experiments. All authors analyzed and discussed the data. RL, WC, and SKB conceived the original projects. HC, NN, SZ, WC, RL and SKB contributed to writing the manuscript.
Data Availability
Coordinates and structure factors for the ExbB/ExbD complexes have been deposited into the Protein Data Bank (PDB accession codes 5SV0 and 5SV1).
The authors declare no competing financial interests.
References
- 1.Krewulak KD, Vogel HJ. TonB or not TonB: is that the question? Biochem Cell Biol. 2011;89:87–97. doi: 10.1139/o10-141. [DOI] [PubMed] [Google Scholar]
- 2.Noinaj N, Guillier M, Barnard TJ, Buchanan SK. TonB-dependent transporters: regulation, structure, and function. Annu Rev Microbiol. 2010;64:43–60. doi: 10.1146/annurev.micro.112408.134247. [DOI] [PMC free article] [PubMed] [Google Scholar]
- 3.Bassford PJ, Jr, Bradbeer C, Kadner RJ, Schnaitman CA. Transport of vitamin B12 in tonB mutants of Escherichia coli. J Bacteriol. 1976;128:242–247. doi: 10.1128/jb.128.1.242-247.1976. [DOI] [PMC free article] [PubMed] [Google Scholar]
- 4.Lohmiller S, Hantke K, Patzer SI, Braun V. TonB-dependent maltose transport by Caulobacter crescentus. Microbiology. 2008;154:1748–1754. doi: 10.1099/mic.0.2008/017350-0. [DOI] [PubMed] [Google Scholar]
- 5.Schauer K, Rodionov DA, de Reuse H. New substrates for TonB-dependent transport: do we only see the ‘tip of the iceberg’? Trends Biochem Sci. 2008;33:330–338. doi: 10.1016/j.tibs.2008.04.012. [DOI] [PubMed] [Google Scholar]
- 6.Cascales E, et al. Colicin biology. Microbiol Mol Biol Rev. 2007;71:158–229. doi: 10.1128/MMBR.00036-06. [DOI] [PMC free article] [PubMed] [Google Scholar]
- 7.Postle K, Kadner RJ. Touch and go: tying TonB to transport. Mol Microbiol. 2003;49:869–882. doi: 10.1046/j.1365-2958.2003.03629.x. [DOI] [PubMed] [Google Scholar]
- 8.Clement E, Mesini PJ, Pattus F, Schalk IJ. The binding mechanism of pyoverdin with the outer membrane receptor FpvA in Pseudomonas aeruginosa is dependent on its iron-loaded status. Biochemistry. 2004;43:7954–7965. doi: 10.1021/bi049768c. [DOI] [PubMed] [Google Scholar]
- 9.Cadieux N, Barekzi N, Bradbeer C. Observations on the calcium dependence and reversibility of cobalamin transport across the outer membrane of Escherichia coli. J Biol Chem. 2007;282:34921–34928. doi: 10.1074/jbc.M707426200. [DOI] [PubMed] [Google Scholar]
- 10.Schramm E, Mende J, Braun V, Kamp RM. Nucleotide sequence of the colicin B activity gene cba: consensus pentapeptide among TonB-dependent colicins and receptors. J Bacteriol. 1987;169:3350–3357. doi: 10.1128/jb.169.7.3350-3357.1987. [DOI] [PMC free article] [PubMed] [Google Scholar]
- 11.Brewer S, et al. Structure and function of X-Pro dipeptide repeats in the TonB proteins of Salmonella typhimurium and Escherichia coli. J Mol Biol. 1990;216:883–895. doi: 10.1016/S0022-2836(99)80008-4. [DOI] [PubMed] [Google Scholar]
- 12.Chang C, Mooser A, Pluckthun A, Wlodawer A. Crystal structure of the dimeric C-terminal domain of TonB reveals a novel fold. J Biol Chem. 2001;276:27535–27540. doi: 10.1074/jbc.M102778200. [DOI] [PubMed] [Google Scholar]
- 13.Witty M, et al. Structure of the periplasmic domain of Pseudomonas aeruginosa TolA: evidence for an evolutionary relationship with the TonB transporter protein. EMBO J. 2002;21:4207–4218. doi: 10.1093/emboj/cdf417. [DOI] [PMC free article] [PubMed] [Google Scholar]
- 14.Kodding J, et al. Crystal structure of a 92-residue C-terminal fragment of TonB from Escherichia coli reveals significant conformational changes compared to structures of smaller TonB fragments. J Biol Chem. 2005;280:3022–3028. doi: 10.1074/jbc.M411155200. [DOI] [PubMed] [Google Scholar]
- 15.Garcia-Herrero A, Peacock RS, Howard SP, Vogel HJ. The solution structure of the periplasmic domain of the TonB system ExbD protein reveals an unexpected structural homology with siderophore-binding proteins. Mol Microbiol. 2007;66:872–889. doi: 10.1111/j.1365-2958.2007.05957.x. [DOI] [PubMed] [Google Scholar]
- 16.Higgs PI, et al. Quantification of known components of the Escherichia coli TonB energy transduction system: TonB, ExbB, ExbD and FepA. Mol Microbiol. 2002;44:271–281. doi: 10.1046/j.1365-2958.2002.02880.x. [DOI] [PubMed] [Google Scholar]
- 17.Sverzhinsky A, et al. Membrane Protein Complex ExbB4-ExbD1-TonB1 from Escherichia coli Demonstrates Conformational Plasticity. J Bacteriol. 2015;197:1873–1885. doi: 10.1128/JB.00069-15. [DOI] [PMC free article] [PubMed] [Google Scholar]
- 18.Sverzhinsky A, et al. Coordinated rearrangements between cytoplasmic and periplasmic domains of the membrane protein complex ExbB-ExbD of Escherichia coli. Structure. 2014;22:791–797. doi: 10.1016/j.str.2014.02.010. [DOI] [PubMed] [Google Scholar]
- 19.Pramanik A, et al. Oligomeric structure of ExbB and ExbB-ExbD isolated from Escherichia coli as revealed by LILBID mass spectrometry. Biochemistry. 2011;50:8950–8956. doi: 10.1021/bi2008195. [DOI] [PubMed] [Google Scholar]
- 20.Jordan LD, et al. Energy-dependent motion of TonB in the Gram-negative bacterial inner membrane. Proc Natl Acad Sci U S A. 2013;110:11553–11558. doi: 10.1073/pnas.1304243110. [DOI] [PMC free article] [PubMed] [Google Scholar]
- 21.Braun V. The structurally related exbB and tolQ genes are interchangeable in conferring tonB-dependent colicin, bacteriophage, and albomycin sensitivity. J Bacteriol. 1989;171:6387–6390. doi: 10.1128/jb.171.11.6387-6390.1989. [DOI] [PMC free article] [PubMed] [Google Scholar]
- 22.Cascales E, Lloubes R, Sturgis JN. The TolQ-TolR proteins energize TolA and share homologies with the flagellar motor proteins MotA-MotB. Mol Microbiol. 2001;42:795–807. doi: 10.1046/j.1365-2958.2001.02673.x. [DOI] [PubMed] [Google Scholar]
- 23.Lloubes R, et al. The Tol-Pal proteins of the Escherichia coli cell envelope: an energized system required for outer membrane integrity? Res Microbiol. 2001;152:523–529. doi: 10.1016/s0923-2508(01)01226-8. [DOI] [PubMed] [Google Scholar]
- 24.Yeh YC, Comolli LR, Downing KH, Shapiro L, McAdams HH. The caulobacter Tol-Pal complex is essential for outer membrane integrity and the positioning of a polar localization factor. J Bacteriol. 2010;192:4847–4858. doi: 10.1128/JB.00607-10. [DOI] [PMC free article] [PubMed] [Google Scholar]
- 25.Gray AN, et al. Coordination of peptidoglycan synthesis and outer membrane constriction during Escherichia coli cell division. Elife. 2015;4 doi: 10.7554/eLife.07118. [DOI] [PMC free article] [PubMed] [Google Scholar]
- 26.Germon P, Ray MC, Vianney A, Lazzaroni JC. Energy-dependent conformational change in the TolA protein of Escherichia coli involves its N-terminal domain, TolQ, and TolR. J Bacteriol. 2001;183:4110–4114. doi: 10.1128/JB.183.14.4110-4114.2001. [DOI] [PMC free article] [PubMed] [Google Scholar]
- 27.Larsen RA, Thomas MG, Postle K. Protonmotive force, ExbB and ligand-bound FepA drive conformational changes in TonB. Mol Microbiol. 1999;31:1809–1824. doi: 10.1046/j.1365-2958.1999.01317.x. [DOI] [PubMed] [Google Scholar]
- 28.Zhai YF, Heijne W, Saier MH., Jr Molecular modeling of the bacterial outer membrane receptor energizer, ExbBD/TonB, based on homology with the flagellar motor, MotAB. Biochim Biophys Acta. 2003;1614:201–210. doi: 10.1016/s0005-2736(03)00176-7. [DOI] [PubMed] [Google Scholar]
- 29.Kojima S, Blair DF. Conformational change in the stator of the bacterial flagellar motor. Biochemistry. 2001;40:13041–13050. doi: 10.1021/bi011263o. [DOI] [PubMed] [Google Scholar]
- 30.Saier MH., Jr Tracing pathways of transport protein evolution. Mol Microbiol. 2003;48:1145–1156. doi: 10.1046/j.1365-2958.2003.03499.x. [DOI] [PubMed] [Google Scholar]
- 31.Ollis AA, Manning M, Held KG, Postle K. Cytoplasmic membrane protonmotive force energizes periplasmic interactions between ExbD and TonB. Mol Microbiol. 2009;73:466–481. doi: 10.1111/j.1365-2958.2009.06785.x. [DOI] [PMC free article] [PubMed] [Google Scholar]
- 32.Parsons LM, Grishaev A, Bax A. The periplasmic domain of TolR from Haemophilus influenzae forms a dimer with a large hydrophobic groove: NMR solution structure and comparison to SAXS data. Biochemistry. 2008;47:3131–3142. doi: 10.1021/bi702283x. [DOI] [PubMed] [Google Scholar]
- 33.Larsen RA, Postle K. Conserved residues Ser(16) and His(20) and their relative positioning are essential for TonB activity, cross-linking of TonB with ExbB, and the ability of TonB to respond to proton motive force. J Biol Chem. 2001;276:8111–8117. doi: 10.1074/jbc.M007479200. [DOI] [PubMed] [Google Scholar]
- 34.Labarca P, Latorre R. Insertion of ion channels into planar lipid bilayers by vesicle fusion. Methods Enzymol. 1992;207:447–463. doi: 10.1016/0076-6879(92)07032-j. [DOI] [PubMed] [Google Scholar]
- 35.Ollis AA, Kumar A, Postle K. The ExbD periplasmic domain contains distinct functional regions for two stages in TonB energization. J Bacteriol. 2012;194:3069–3077. doi: 10.1128/JB.00015-12. [DOI] [PMC free article] [PubMed] [Google Scholar]
- 36.Ollis AA, Postle K. ExbD mutants define initial stages in TonB energization. J Mol Biol. 2012;415:237–247. doi: 10.1016/j.jmb.2011.11.005. [DOI] [PMC free article] [PubMed] [Google Scholar]
- 37.Braun V, et al. Energy-coupled transport across the outer membrane of Escherichia coli: ExbB binds ExbD and TonB in vitro, and leucine 132 in the periplasmic region and aspartate 25 in the transmembrane region are important for ExbD activity. J Bacteriol. 1996;178:2836–2845. doi: 10.1128/jb.178.10.2836-2845.1996. [DOI] [PMC free article] [PubMed] [Google Scholar]
- 38.Braun V, Herrmann C. Point mutations in transmembrane helices 2 and 3 of ExbB and TolQ affect their activities in Escherichia coli K-12. J Bacteriol. 2004;186:4402–4406. doi: 10.1128/JB.186.13.4402-4406.2004. [DOI] [PMC free article] [PubMed] [Google Scholar]
- 39.Sehnal D, et al. MOLE 2.0: advanced approach for analysis of biomacromolecular channels. J Cheminform. 2013;5:39. doi: 10.1186/1758-2946-5-39. [DOI] [PMC free article] [PubMed] [Google Scholar]
- 40.Smart OS, Neduvelil JG, Wang X, Wallace BA, Sansom MS. HOLE: a program for the analysis of the pore dimensions of ion channel structural models. J Mol Graph. 1996;14:354–360. 376. doi: 10.1016/s0263-7855(97)00009-x. [DOI] [PubMed] [Google Scholar]
- 41.Schneider CA, Rasband WS, Eliceiri KW. NIH Image to ImageJ: 25 years of image analysis. Nat Methods. 2012;9:671–675. doi: 10.1038/nmeth.2089. [DOI] [PMC free article] [PubMed] [Google Scholar]
- 42.Whitmore L, Wallace BA. Protein secondary structure analyses from circular dichroism spectroscopy: methods and reference databases. Biopolymers. 2008;89:392–400. doi: 10.1002/bip.20853. [DOI] [PubMed] [Google Scholar]
- 43.Minor ZOaW. Processing of X-ray Diffraction Data Collected in Oscillation Mode. Methods Enzymol. 1997;276:307–326. doi: 10.1016/S0076-6879(97)76066-X. [DOI] [PubMed] [Google Scholar]
- 44.Winter G. xia2: an expert system for macromolecular crystallography data reduction. J Appl Cryst. 2010;43:186–190. [Google Scholar]
- 45.Schneider TPTR. HKL2MAP: a graphical user interface for phasing with SHELX programs. J Appl Cryst. 2004;37:843–844. [Google Scholar]
- 46.Adams PD, et al. PHENIX: a comprehensive Python-based system for macromolecular structure solution. Acta Crystallogr D Biol Crystallogr. 2010;66:213–221. doi: 10.1107/S0907444909052925. [DOI] [PMC free article] [PubMed] [Google Scholar]
- 47.McCoy AJ, et al. Phaser crystallographic software. J Appl Crystallogr. 2007;40:658–674. doi: 10.1107/S0021889807021206. [DOI] [PMC free article] [PubMed] [Google Scholar]
- 48.Krissinel E, Henrick K. Inference of macromolecular assemblies from crystalline state. J Mol Biol. 2007;372:774–797. doi: 10.1016/j.jmb.2007.05.022. [DOI] [PubMed] [Google Scholar]
- 49.Pettersen EF, et al. UCSF Chimera--a visualization system for exploratory research and analysis. J Comput Chem. 2004;25:1605–1612. doi: 10.1002/jcc.20084. [DOI] [PubMed] [Google Scholar]
- 50.Schenk AD, Philippsen A, Engel A, Walz T. A pipeline for comprehensive and automated processing of electron diffraction data in IPLT. J Struct Biol. 2013;182:173–185. doi: 10.1016/j.jsb.2013.02.017. [DOI] [PMC free article] [PubMed] [Google Scholar]
- 51.Polyhach Y, et al. High sensitivity and versatility of the DEER experiment on nitroxide radical pairs at Q-band frequencies. Phys Chem Chem Phys. 2012;14:10762–10773. doi: 10.1039/c2cp41520h. [DOI] [PubMed] [Google Scholar]
- 52.Jeschke G, Chechik V, Ionita P, Godt A, Zimmermann H, Banham J, Timmel CR, Hilger D, Jung H. DeerAnalysis2006—a comprehensive software package for analyzing pulsed ELDOR data. Appl Magn Reson. 2006;30 [Google Scholar]
- 53.von Hagens T, Polyhach Y, Sajid M, Godt A, Jeschke G. Suppression of ghost distances in multiple-spin double electron-electron resonance. Phys Chem Chem Phys. 2013;15:5854–5866. doi: 10.1039/c3cp44462g. [DOI] [PubMed] [Google Scholar]
- 54.Polyhach Y, Bordignon E, Jeschke G. Rotamer libraries of spin labelled cysteines for protein studies. Phys Chem Chem Phys. 2011;13:2356–2366. doi: 10.1039/c0cp01865a. [DOI] [PubMed] [Google Scholar]
- 55.Mueller P, Rudin DO, Tien HT, Wescott WC. Reconstitution of cell membrane structure in vitro and its transformation into an excitable system. Nature. 1962;194:979–980. doi: 10.1038/194979a0. [DOI] [PubMed] [Google Scholar]
- 56.Hille B. Ion Channels of Excitable Membranes. 3. Sinauer Assoc; 2001. [Google Scholar]
Associated Data
This section collects any data citations, data availability statements, or supplementary materials included in this article.
Supplementary Materials
Data Availability Statement
Coordinates and structure factors for the ExbB/ExbD complexes have been deposited into the Protein Data Bank (PDB accession codes 5SV0 and 5SV1).


