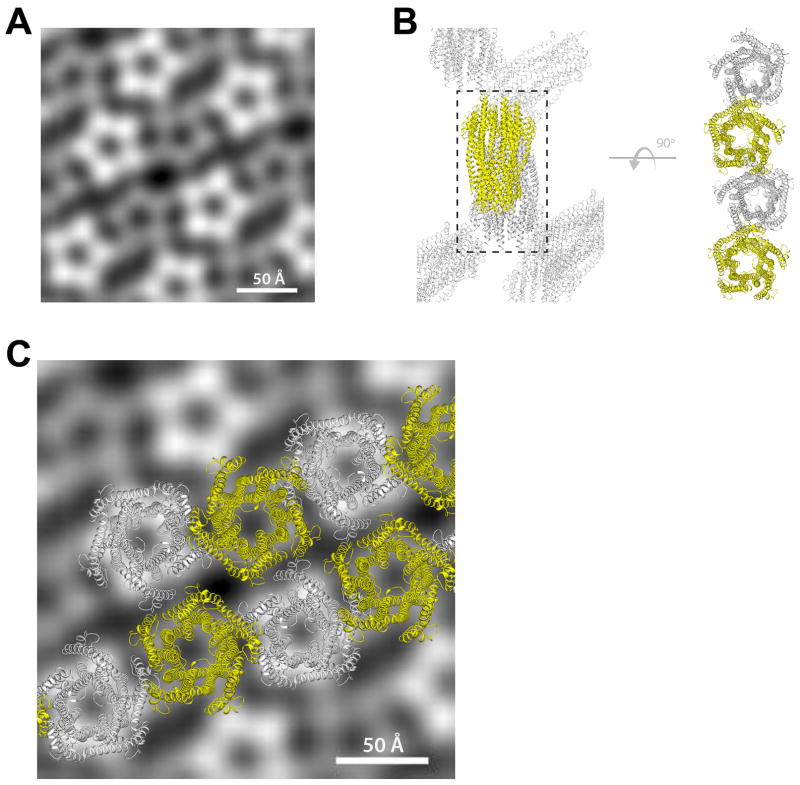
Extended Data Figure 6. Packing similarities of both the 2D and 3D crystals used for EM and X-ray crystallography.
A. Averaged projection map from the EM analysis on 2D crystals. Five images were analyzed, and a representative average projection map was calculated from 900 sub-images. The averaged map shows two different populations of the pentamer which are similar in size but differ in level intensity due to opposite orientations of the complex within the crystal; a similar packing arrangement was also observed in our crystal structures. ExbD was not detected in our EM studies, likely due to disorder of the globular domain which is anchored to the membrane by a long unstructured linker15. B. Packing of the complex in the X-ray crystal structure from 3D crystals. The right side indicates an orthogonal view highlighting a single row of molecules from the lattice (black dashed box). C. Fitting the row of molecules from the 3D lattice (X-ray) from panel B onto the averaged projection map from the 2D crystals (EM) to highlight the consistency observed in packing.

