Delineating hierarchical cellular states including rare intermediates and the networks of regulatory genes that orchestrate cell-type specification are quintessential challenges for developmental biology. Single-cell RNA-Seq (scRNA-Seq) is greatly accelerating such research given its power to provide comprehensive descriptions of genomic states and their presumptive regulators1–5. Hematopoietic multipotential progenitors (MPPs) as well as bipotential intermediates manifest mixed-lineage patterns of gene expression at a single-cell level6,7. Such mixed-lineage states may reflect molecular priming of developmental potentials by co-expressed alternate-lineage determinants, namely transcription factors. Although a bistable-gene-regulatory network has been proposed to regulate the specification of neutrophils versus macrophages7,8, the nature of the transition states manifested in vivo and the underlying dynamics of the cell-fate determinants have remained elusive. We used scRNA-Seq, coupled with a new analytic tool, ICGS and clonogenic assays to delineate hierarchical genomic and regulatory states culminating in neutrophil or macrophage specification. The analysis captured prevalent mixed-lineage intermediates that manifested coincident expression of hematopoietic stem cell/progenitor (HSCP) and myeloid progenitor genes. It also revealed rare metastable intermediates that had collapsed the HSCP program and expressed low levels of the myeloid determinants, Irf8 and Gfi19–13. Genetic perturbations and ChIP-Seq revealed Irf8 and Gfi1 as key components of counteracting myeloid-gene-regulatory networks. Combined loss of these two determinants “trapped” the metastable transition state. We propose that mixed-lineage states are obligatory during cell-fate specification and manifest differing frequencies because of their “dynamic instability”, dictated by counteracting gene-regulatory networks.
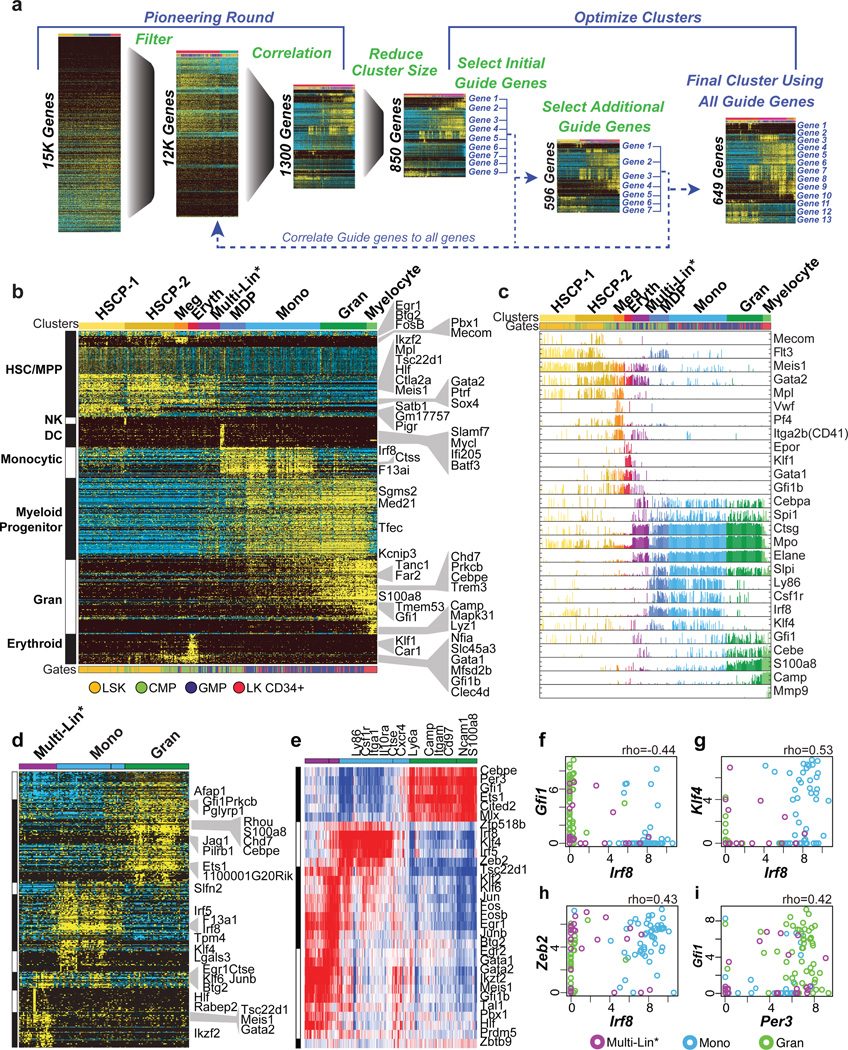
To analyze discrete genomic states and transitional intermediates spanning myelopoiesis, we performed scRNA-Seq on stem/multipotent progenitors (LSK; lin−Sca1+c-Kit+), common myeloid progenitors (CMP), granulocyte monocyte progenitors (GMP)14, and LKCD34+ cells (lin−c-Kit+CD34+)15 that included granulocytic precursors. Analysis of the data using six independent computational approaches1,3,4,16,17 resulted in varied delineation of cellular states and intermediates (Supplementary Information, Extended Data Fig. 1–5). Therefore, we developed a method, Iterative Clustering and Guide-gene Selection (ICGS), which utilizes pair-wise correlation of dynamically expressed genes and iterative clustering with pattern-specific guide genes to delineate coherent gene-expression patterns (Fig. 1a, Supplementary Information). Exclusion of cell-cycle genes improved predictions of developmental states (Supplementary Information, Extended Data Fig. 6a–c). ICGS resolved nine hierarchically-ordered cellular states (Fig. 1b) that encompassed all those delineated above. GO-Elite pathway enrichment assigned cellular identities to these states; HSCP-1 (Hematopoietic Stem Cell Progenitor), HSCP-2, Meg (Megakaryocytic), Eryth (Erythrocytic), Multi-Lin* (Multi-Lineage Primed), MDP (Monocyte-Dendritic cell precursor), Mono (Monocytic), Gran (Granulocytic) and Myelocyte (myelocytes and metamyelocytes). Gene expression patterns of Csf1r, Flt3 and Cx3cr1 suggested that both CMP and GMP contain macrophage/dendritic cell precursors (MDP: CX3CR1+CD115+CD135+)18, which was confirmed by flow cytometry (Extended Data Fig. 6d–f). Strikingly, the unbiased ICGS analysis inferred a developmental order in agreement with the experimentally determined hematopoietic sequence19 (Fig. 1b, bottom). Similarly, clustering of LKCD34+ cells recreated the entire developmental ordering with granulocytic precursors at one end of the continuum (Extended Data Fig. 6b). Thus ICGS generated a refined order of discrete myeloid cell states, independent of but consistent with prior knowledge.
Figure 1. ICGS ordering of the myeloid developmental hierarchy and derivation of regulatory states.
a, Schematic illustration of scRNA-Seq ICGS workflow. b, Heatmap of genes delineated by ICGS (excluding cell cycle) in scRNA-Seq data (n=382 cells). Columns represent cells. Rows represent genes. Gene-expression clusters were generated in AltAnalyze using the HOPACH algorithm. ICGS cell clusters are indicated (top); HSCP (hematopoietic stem cell and progenitor), Meg (megakaryocytic), Eryth (erythroid), Multi-Lin* (multi-lineage primed), MDP (monocyte-dendritic cell precursor), Mono (monocytic), Gran (granulocytic), Myelocyte, Flow cytometric identifiers are indicated (below). ICGS guide genes are displayed (right). c, Plots displaying the incidence and amplitude of select genes delineated by ICGS. d, ICGS clustering of GMPs (n=132). e, TF-to-gene correlation analysis of GMPs. Heatmap displays HOPACH clustering of Pearson correlation coefficients among genes and TFs in designated ICGS clusters from panel d. Columns represent genes. Rows represent TFs. f–i, Scatterplots generated in R (using the pairs function) show expression levels (TPM) of select TF pairs in individual GMPs. Color key for ICGS clusters (bottom). Pearson correlation coefficient is indicated (top).
Next, we displayed the incidence and amplitude of expression of key genes within the predicted ICGS hematopoietic hierarchy (Fig. 1c). Notably, the Multi-Lin* population co-expressed the transcription factors (TFs) Gata2, Meis1, PU.1 (Spi1) and C/EBPα, the latter two are key regulators of myelopoiesis20,21. They also manifested infrequent and variable-amplitude expression of megakaryocytic, erythroid, granulocytic and monocytic genes (Fig. 1c). Thus, during steady-state myelopoiesis a prevalent mixed-lineage state is encountered that expresses HSCP and myeloid progenitor genes (Ctsg, Mpo, and Elane), while displaying molecular priming of erythrocytic, megakaryocytic, granulocytic and monocytic potentials. Each ICGS delineated cellular state is expected to have an underlying regulatory state characterized by distinct combinations of TFs. Clustering of Pearson-correlation coefficients for ICGS-delineated TF-gene pairs (Fig. 1d, e, Extended Data Fig. 6g–j), revealed three distinct regulatory states within GMPs (Fig. 1e). Two were demarcated by TFs involved in granulocyte (e.g., Cebpe, Gfi1) or monocyte (e.g., Irf8, Klf4) specification10–12,22. The third encompassed HSCP TFs, Gata2 and Meis1, along with signal-induced TFs, Jun, Fos and Egr1. The combined analysis of myelopoiesis suggests a multipotential ground state associated with a large set of TFs including Gata2, Meis1, PU.1 and C/EBPα, that is acted on by signal induced TFs such as Fos and Egr1 to generate myeloid progenitors which undergo a strong bifurcation into well demarcated monocytic and granulocytic genomic states.
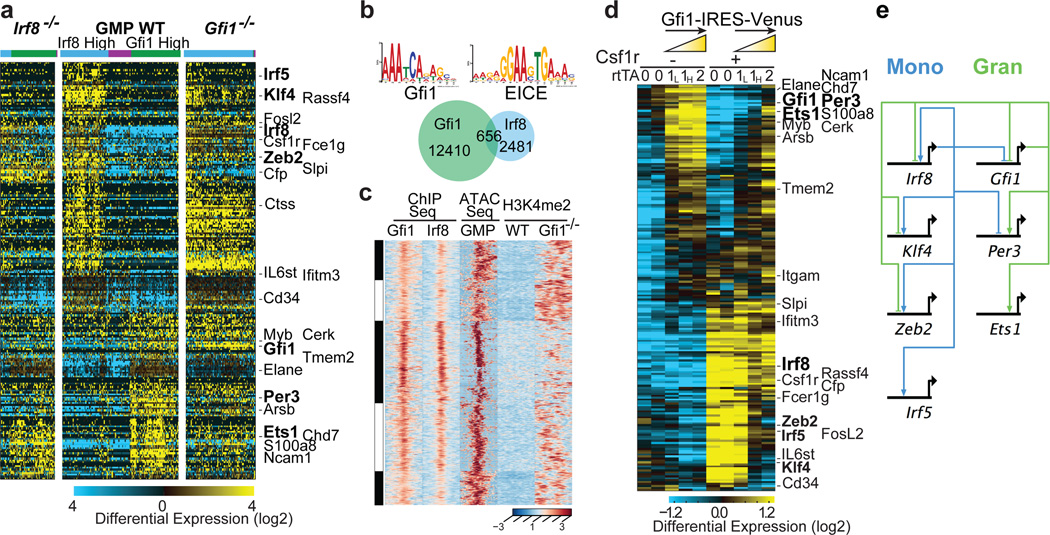
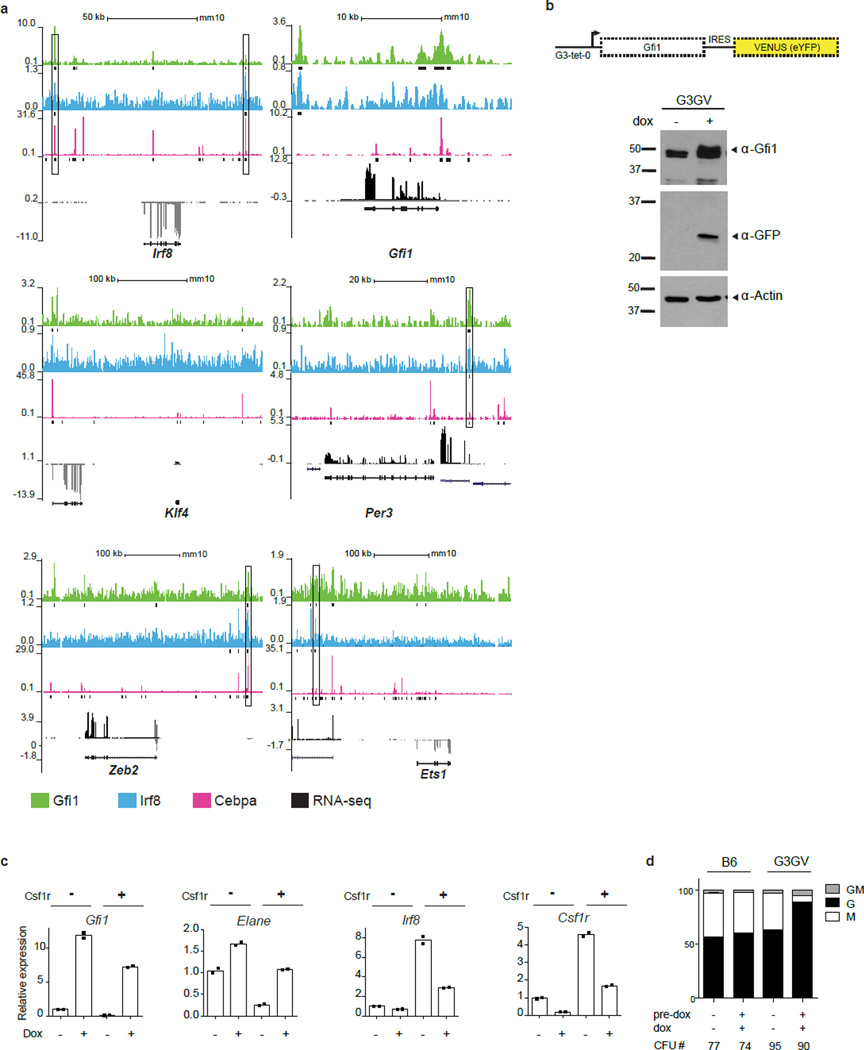
To infer regulatory interactions among TFs reflective of granulocytic and monocytic specification their pairwise expression was correlated with cellular genomic states (Fig. 1f–i, Extended Data Fig. 7a). This confirmed an established regulatory relationship (e.g. Irf8-Klf423), and suggested new regulatory interactions (Irf8-Zeb2 and Gfi1-Per3). Notably, Gfi1 and Irf8, which are required for normal granulopoiesis and monopoiesis, respectively9,11,12,24,25, displayed strong partitioning within granulocyte- versus monocyte-specified cells (Fig. 1f). Given their reciprocal expression, we analyzed the consequences of Gfi1 or Irf8 loss on genes strongly correlated with their expression within wild type (WT) GMPs (Fig. 2a). Importantly, loss of either TF reduced the heterogeneity of genomic states manifested at the single-cell level (Fig. 2a). Furthermore, loss of Irf8 or Gfi1 reciprocally perturbed the expression of transcription factors that were associated with the monocytic (Klf4, Zeb2, Irf5) and granulocytic (Per3, Ets1) regulatory states, respectively (Fig. 2a, Extended Data Fig. 7b, c). To explore underlying molecular mechanisms, we performed ChIP-Seq analyses in GMPs (Fig. 2b). Notably, Irf8 peaks were enriched for EICE motifs, which are co-bound by PU.126. Intersection of the Gfi1 and Irf8 peaks revealed shared regions that were deemed accessible in GMPs27 based on ATAC-Seq27 (Fig. 2b, c). Gfi1 recruits Lsd128, a histone demethylase acting on H3K4me2. The shared genomic regions manifested increased H3K4me2 upon Gfi1 loss (Fig. 2c) or Lsd1-inhibition, correlating with enhanced monocytic potential (Extended Data Fig. 7d, e). Genes located near the shared genomic regions were associated with monocytic-dendritic-precursors (ImmGen) or abnormal mononuclear cell morphology (Mouse Phenotype Ontology), and were reciprocally dysregulated in Irf8−/− or Gfi1−/− GMPs (Extended Data Fig. 7f). Thus Gfi1 antagonizes the specification of the monocytic-dendritic program in GMPs by repressing enhancers activated by PU.1-Irf8. Strikingly, similar binding patterns for Gfi1 and Irf8 were seen on the Irf8, Klf4 and Zeb2 genes (Extended Data Fig. 8a). Thus Gfi1 likely represses the Irf8, Klf4 and Zeb2 genes by interrupting positive regulation by PU.1 and Irf8, similar to its antagonism of PU.1 on the Spi1 gene29. To further test regulatory interactions, we varied levels of Gfi1 within GMPs using an inducible Gfi1 allele (Extended Data Fig. 8b). Gfi1 induction in GMP increased granulocytic and diminished monocytic potential (Extended Data Fig. 8c, d). In Csf1r+ GMP, inducing Gfi1 repressed monocytic genes (including Irf8), and induced neutrophil genes in a dose-dependent manner (Fig. 2d). In agreement with regulatory state (Fig. 1e) and loss-of-function analyses (Fig. 2a), key TFs were reciprocally altered by increased expression of Gfi1; Klf4, Zeb2 and Irf5 were repressed whereas Ets1 and Per3 were induced. The perturbation and ChIP-Seq data were used to assemble a gene regulatory network underlying myeloid cell fate specification (Fig. 2e).
Figure 2. Counteracting gene regulatory network underlying myeloid cell fate determination.
a, HOPACH clustering of wild type (WT), Irf8−/− and Gfi1−/− GMPs using Gfi1- or Irf8-correlated genes derived from scRNA-Seq of WT GMPs (rho>0.3, TPM>1). Genotypes and cell clusters of Irf8-high (blue) and Gfi1-high (green) or neither (purple) are indicated. along with genes shared with ICGS. b, ChIP-Seq analysis of Gfi1 and Irf8 in GMPs. Statistically enriched Gfi1 (p=6.63×10⁻⁸) and Ets-Irf composite element (EICE) motifs (p=1.08×10⁻⁶) are displayed. Venn diagram illustrates Gfi1, Irf8 and overlapping ChIP-Seq peaks. c, Integrative K-means cluster heatmap of overlapping Gfi1 and Irf8 peaks (656 genomic regions). Corresponding ATAC-Seq analysis in GMPs (GSE60103) and H3K4me2 ChIP-Seq tracks in wild type or Gfi1−/− lin− bone marrow cells are shown. d, RNA-Seq analysis of GMPs with inducible Gfi1 expression. GMPs harboring tetracycline-inducer (rtTA-M2) and tetracycline-responsive (Gfi1-IRES-Venus) alleles were incubated with doxycycline overnight, then sorted for Venus expression. GMPs carrying one rtTA-M2 allele were sorted on the basis of low (1L) versus high (1H) Venus expression. Hierarchical clustering was performed as in Fig. 2a. Select genes shared with ICGS are indicated. e, Myeloid gene regulatory network displayed using BioTapestry51. Regulatory connections summarize perturbation and ChIP-Seq experiments. Indicated TFs are known or predicted to regulate monocyte/dendritic (left) or neutrophil (right) specification, respectively.
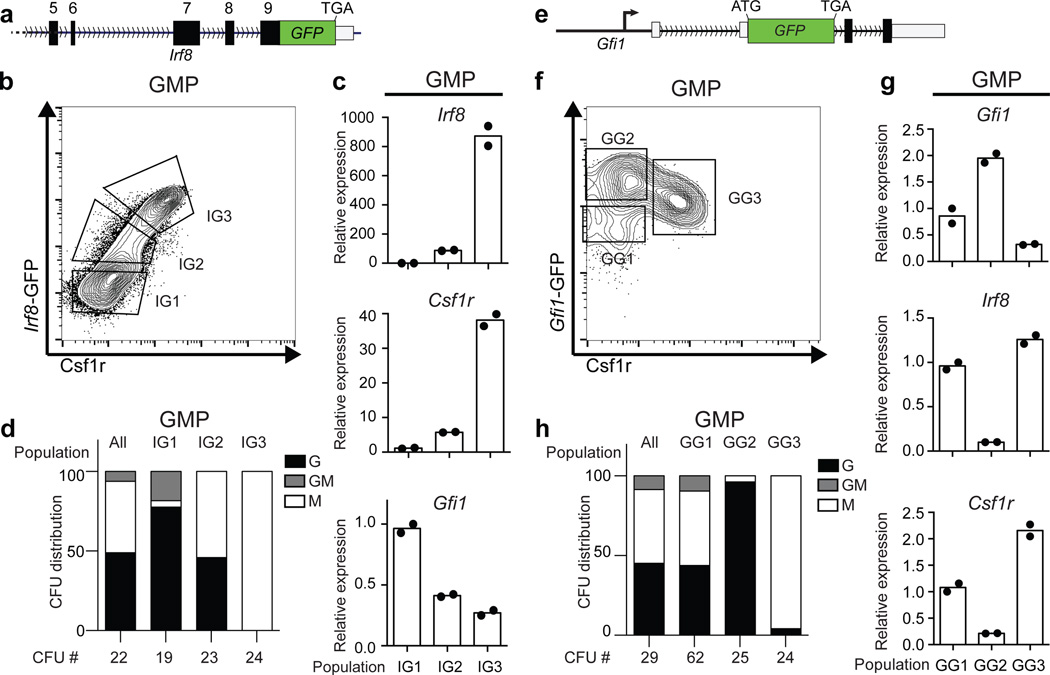
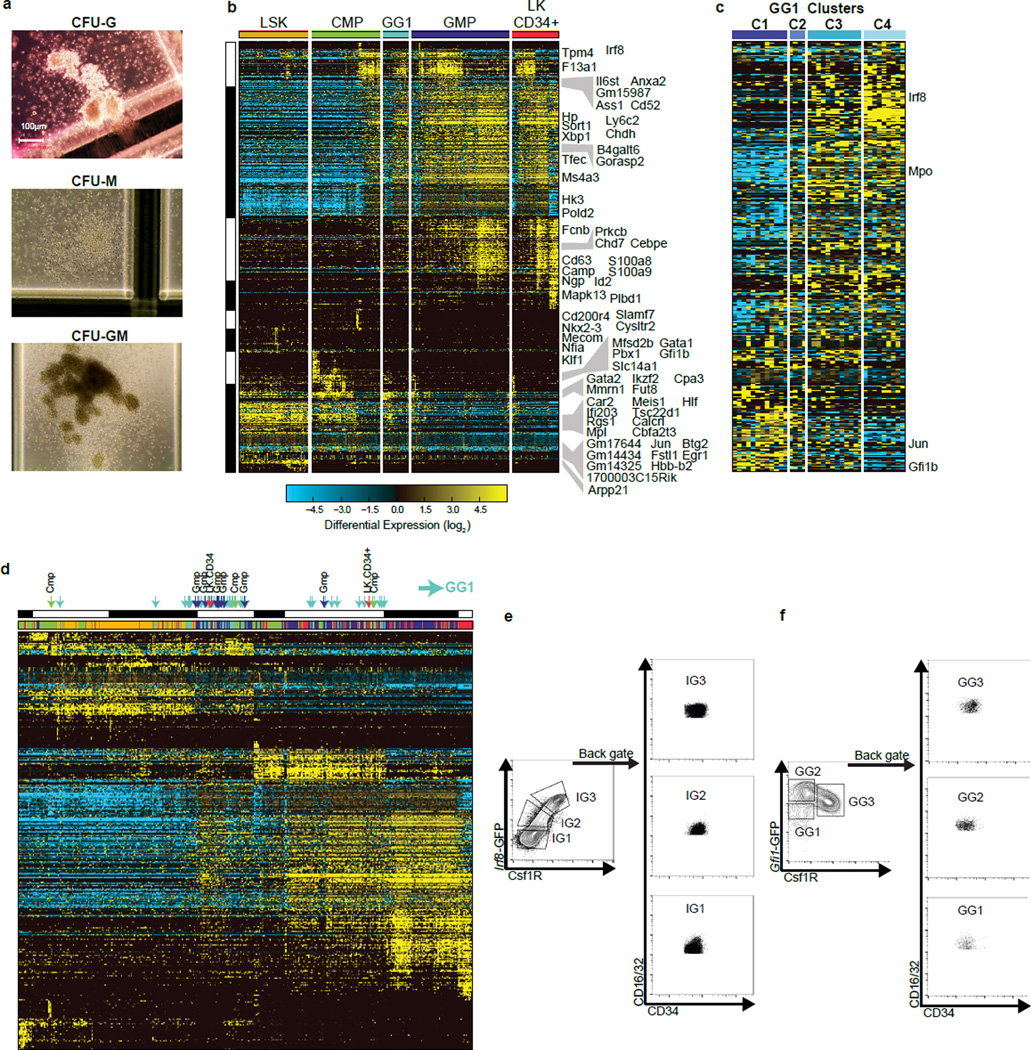
Given that Irf8 and Gfi1 function as antagonistic determinants, we determined how their dynamic expression shapes the genomic state and developmental potential of a GMP. Analysis of GMPs using an Irf8-GFP reporter (Fig. 3a) and CD115 (Csf1r) revealed two major Irf8-GMP subpopulations (IG1 and IG3) and a minor intermediate (IG2) (Fig. 3b). Expression of Csf1r protein and transcripts was strongly correlated with Irf8 (Fig. 3b, c). Conversely Gfi1 transcripts were anti-correlated with Irf8 and Csf1r (Fig. 3c). Colony forming unit (CFU) assays demonstrated that Irf8hi GMPs (IG3) were specified monocytic progenitors (CFU-M); whereas Irf8− GMPs (that expressed highest levels of Gfi1) comprised of specified granulocytes (CFU-G) as well as bipotential progenitors (CFU-GM) (Fig. 3d). Intriguingly, the IG2s, which expressed low levels of Irf8 and Gfi1 (Fig. 3b, c), appeared to represent cells poised to undergo specification as they gave rise to equal proportion of monocytic and granulocytic colonies. Next, we examined GMPs from Gfi1-GFP reporter mice (Fig. 3e), using Csf1r as a surrogate for Irf8. Flow cytometry analysis revealed two major Gfi1-GMP intermediates (GG2, GG3) and a minor population (GG1) (Fig. 3f). GG2 cells expressed highest levels of Gfi1 and represented specified granulocytic progenitors, while GG3 cells, which expressed highest levels of Irf8 were oppositely specified as monocytic progenitors (Fig. 3f–h). The rare GG1 cells expressed intermediate levels of both transcription factors (Fig. 3g). The Gfi1-GFP reporter expresses a stable GFP, which can over-estimate Gfi1 expression, likely accounting for higher GFP expression in GG3s (Fig. 3f) in spite of very low levels of Gfi1 transcripts (Fig. 3g). Importantly GG1s were enriched for bipotential cells (CFU-GM) as well as those undergoing lineage specification (CFU-G and CFU-M; Fig. 3h, Extended Data Fig. 9a). Thus using reporters for reciprocally expressed TFs we were able to distinguish bipotential cells, their lineage-committed progeny and rare intermediates poised to undergo binary cell-fate choice.
Figure 3. Detection of rare transition state poised to undergo myeloid cell fate determination.
a, Schematic representation of the Irf8-GFP (IG) reporter allele. b, Flow cytometric analysis of Csf1r and GFP expression in GMPs. Gating strategy for IG1, IG2 and IG3 cells is indicated. c, TaqMan analysis of indicated transcripts in IG cells. d, Colony forming unit (CFU) assays with indicated IG cells. Percent distribution of colonies containing granulocytes (G), macrophages (M) or both (GM) is displayed on y-axis (n=3). e, Schematic representation Gfi1-GFP (GG) reporter allele. f, Flow cytometric analysis of Csf1r and GFP expression in GMPs. Gating strategy for GG1, GG2 and GG3 cells is indicated. g, TaqMan of indicated transcripts in GG cells as in panel 3c. h, CFU assays with indicated GG cells as in panel 3d. Representative plots from one of three independent experiments with each reporter are shown. c, g display two technical replicates.
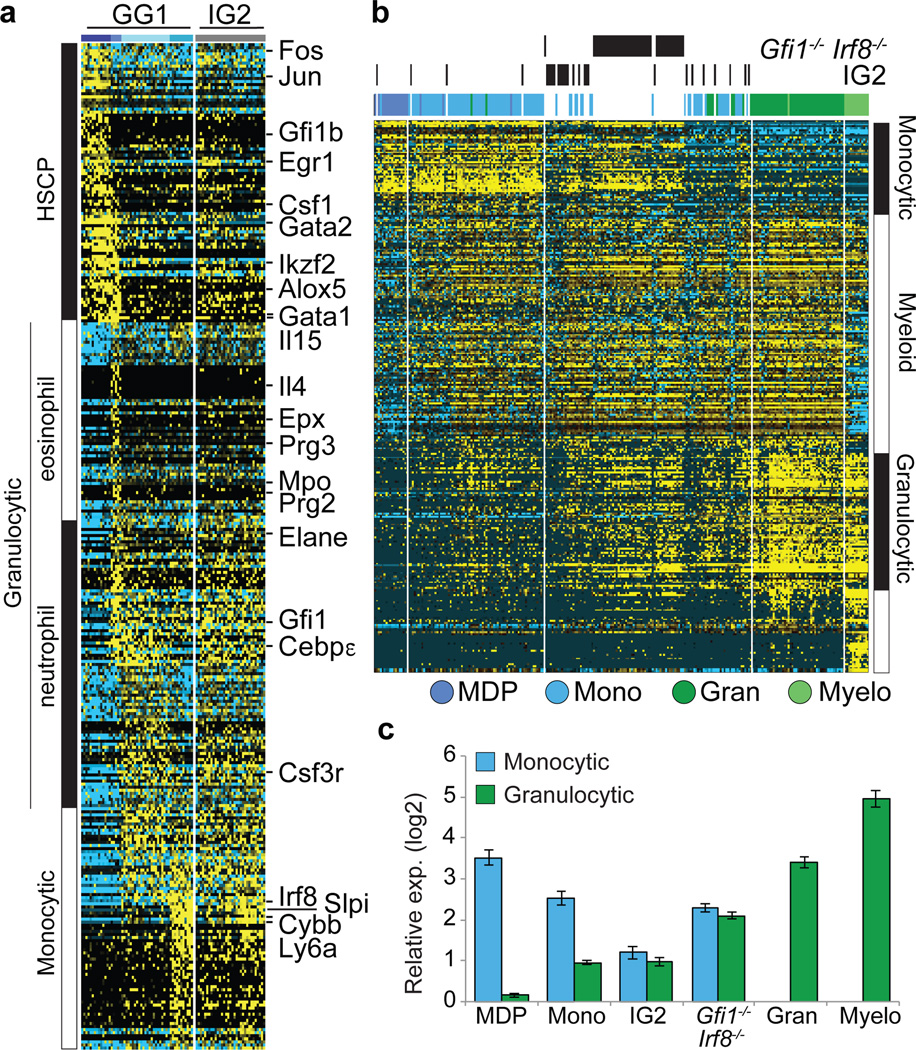
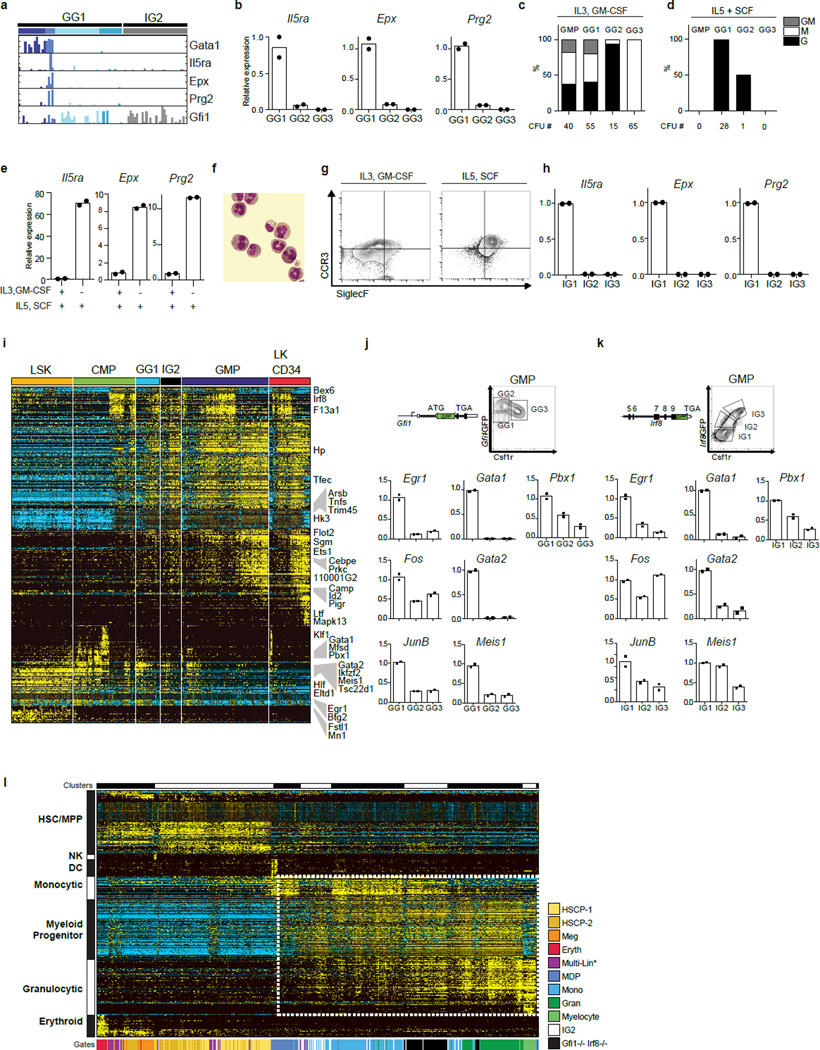
We next performed scRNA-Seq of GG1s and IG2s (Fig. 4a). Four clusters of cells could be delineated within GG1s (Supplementary Information, Extended Data Fig. 9b–d). One group was enriched for HSCP genes including Gata1, Gata2, Egr1, FosB and Jun (Fig. 4a). These cells were not contaminants as they expressed CD16/32 and CD34 (Extended Data Fig. 9e, f), and corresponded to the bipotential cells (CFU-GM) within the GG1 population (see below). The second cluster down regulated most HSCP genes except Gata1 and expressed Gfi1, Il5ra, Prg2 and Epx. These were eosinophilic progenitors based on CFU assays, cytospins and flow cytometry (Extended Data Fig. 10a–h)30. The remaining two groups of cells expressed low levels of Gfi1 and Irf8 along with the myeloid genes Etv6, Mpo, Elane, Hax1, a subset of these expressed higher levels of Irf8 along with Cybb and Ly6a (Fig. 4a). The genomic states of these latter groups suggested they represented mixed-lineage intermediates poised for binary cell fate choice. To test this, we analyzed IG2s (Fig. 4a, Extended Data Fig. 10i), which lack bipotential progenitors (CFU-GM) and are highly enriched for cells undergoing lineage specification, resulting in CFU-G and CFU-M. HSCP gene expression waned in IG2s and they co-expressed Gfi1 and Irf8. In contrast, GG1s and IG1s, which both contain the bipotential progenitors (CFU-GM) were enriched for cells expressing key HSCP genes (Extended Data Fig. 10j, k), linking the HSCP gene expression module with CFU-GM developmental output. Thus, we were able to assign genomic states at a single cell level to well-known myeloid intermediates, CFU-M, CFU-G and CFU-GM.
Figure 4. Trapping rare myeloid transition state by removal of counteracting determinants.
a, ICGS-based scRNA-Seq analysis of GG1 and IG2 cells (see Extended Data Figure 9 and Supplementary Methods). Known hematopoietic regulators and markers are indicated (right). b, HOPACH clustering of WT, IG2 and Irf8−/−Gfi1−/− GMPs based on ICGS-delineated genes (Fig. 1b), with indicated myeloid cellular states (right) (see global analysis in ED Fig. 10l). c, Monocyte or granulocyte gene enrichment analysis. The median expression value of a gene within cells of designated group was compared to its median value in all cells (Extended Data Fig. 10l) and average fold change (log2 ± SEM) was determined for monocytic or granulocytic genes.
We note induction of Irf8 at low levels is associated with loss of the multipotential program but is not accompanied by specification of monocytes. Higher amplitude Irf8 expression appears necessary for the latter. Similarly, an intermediate level of Gfi1 expression is associated with loss of the multipotential program, but a further increase in its expression coincides with neutrophil specification. Thus hematopoietic intermediates, which express a multipotential program (HSCP1, HSCP2) span the LSK, CMP and GMP flow cytometric gates. The rare cells within the GMP gate that are undergoing monocyte versus neutrophil specification have collapsed multipotential gene expression program and manifest a metastable mixed-lineage transcriptional state involving low-level expression of both Irf8 and Gfi1. If this genomic state, exemplified by IG2s, is a developmental intermediate that is rendered metastable because of counteracting gene regulatory networks, we reasoned that it may be “trapped” by eliminating opposing lineage determinants such as Irf8 and Gfi1. Accordingly, we isolated GMP-like cells from Irf8−/−Gfi1−/− mice and subjected them to scRNA-Seq. Analysis of their genomic states revealed that they, like the IG2s, were primarily distributed between the monocytic and granulocytic specified cells (Fig. 4b, Extended Data Fig. 10l), underscored by quantitative indexing of monocytic and granulocytic signature genes (Fig. 4c). Notably the Irf8−/−Gfi1−/− GMPs were more tightly correlated as a group than the IG2s. Accordingly, we propose that IG2s manifest “dynamic instability” because of the counter acting functions of Irf8 and Gfi1 and that this metastable state is “trapped” by the elimination of both developmental determinants.
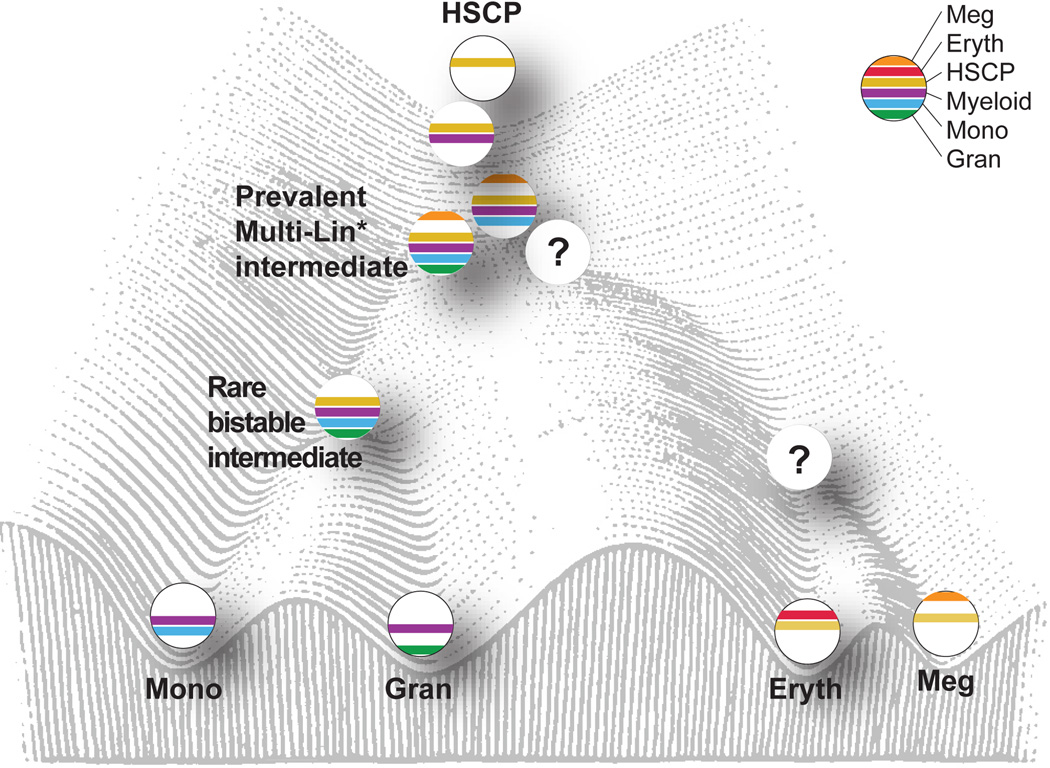
We were able to identify both prevalent and rare mixed-lineage genomic states that are encountered during myelopoiesis (Fig. 5). Multi-Lin* intermediates expressing HSCP genes induce robust myeloid progenitor gene expression and transcripts for alternate lineage genes. Notably, myeloid priming occurs in cells which express the TFs PU.1 and/or C/EBPα32. A remarkable feature of this mixed-lineage state is its prevalence and apparent stability in spite of mixing of alternate lineage determinants. Expression of the HSCP module in GMPs is associated with CFU-GM potential. In rare cells, HSCP gene expression wanes with the simultaneous acquisition of CFU-G and CFU-M potentials. Based on its frequency, this state is inferred to be metastable, but could be “trapped” by elimination of counter-acting determinants. The concept of “trapping” of rare developmental intermediates by genetic perturbation is based on the analogy with trapping of unstable transition states in chemical reactions using physico-chemical strategies33. We propose that coincident expression of counteracting regulatory network components manifests as dynamic instability34. This may generate oscillations in the regulatory states of multi- or bi-potential intermediates, resulting in bursts of alternate lineage gene expression. The oscillatory behavior may be a reflection of partial assembly of counter acting regulatory states or a lack of their stabilization.
Figure 5. Model of mixed-lineage transition states underlying myeloid cell-fate determination.
Model depicts a hierarchical set of hematopoietic intermediates culminating in the specification of monocytic and granulocytic lineages. Cells are ordered on a Waddington landscape with their characteristic gene expression modules (color bars) and states. The prevalent (Multi-Lin*) and rare (bistable) mixed-lineage myeloid transition states, characterized herein, are proposed to manifest dynamic instability because of counteracting regulatory determinants. Although erythroid and megakaryocytic progenitors were found within CMPs, it remains to be determined if a distinct set of Multi-Lin* intermediates give rise to these progenitors via a rare bistable state.
Methods
Mice
Gfi1Δex2-3/Δex2-312, Gfi1P2A11, Gfi1GFP31, Irf8tm1.2Hm/J25, Irf8EGFP32 and CX3CR1GFP33 mice were maintained on C57Bl/6 background. C57Bl/6 mice used in experiments were purchased from Charles River. Mice were bred and housed by Cincinnati Children's Hospital Medical Center (CCHMC) Veterinary Services, and mouse manipulations were reviewed and approved by the Children's Hospital Research Foundation Institutional Animal Care and Use Committee (Protocol Number IACUC2013-0090).
To generate G3-tetracycline-inducible-promoter Gfi1-IRES-Venus (G3GV) knock-in mice, we first modified the pBS31 vector34 to contain 7 tetracycline responsive elements with revised sequence and spacing, termed “G3”35 (pBS31-G3). To generate the Gfi1-IRES-Venus sequence, the internal ribosomal entry site (IRES) from encephalomyocarditis virus was cloned 5 prime of a rapidly maturing YFP variant (Venus)36. The murine Gfi1 open reading frame was then cloned 5 prime of IRES-Venus. Finally, the Gfi1-IRES-Venus fragment was cloned into the pBS31-G3 plasmid (pBS31-G3GV). Inducible Gfi1-IRES-Venus knock in mice were generated by electroporating KH2 ES cells34 with both the pBS31-G3GV vector and a FLP recombinase expression vector (pCAGs-FLPe-Puro). FLP recombinase is expected to recombine the pBS31 plasmid into the Col1A1 locus of KH2 ES cells, and repair a defective hygromycin resistance gene34. KH2 cells were maintained on DR4 feeders (Mirimus, NY) according to Preimsrirut et al.37. After electroporation, the KH2 cells were selected in hygromycin and the first eight hygromycin-resistant clones were expanded. Since KH2 cells also contain a ROSA allele encoding rtTA-M2, a split of each recombinant clone was treated with doxycycline in vitro, then analyzed by immunoblot using α-Gfi1 (AF3540, R&D Systems, Minneapolis, MN) or α-GFP (632593, Clontech, Mountain View, CA) antibodies. Four independent G3GV+ ES clones were injected into 8-cell embryos, resulting in an average of 50% chimerism. Progeny were backcrossed to C57Bl/6 ROSA-rtTA-M2 mice (JAX Stock Number:006965).
Flow cytometry and cell sorting
Mice were euthanized with carbon dioxide and cervical dislocation. Femurs, tibias and iliac crest were harvested immediately after euthanasia and put in cold PBS+2%FBS. Bones were crushed with mortar and pestle, filtered and washed in cold PBS+2%FBS, then enriched using CD117 MicroBeads on a Automacs Pro separator (Miltenyi, San Diego, CA). CD117+ cells were stained with lineage: CD3-biotin (clone 145-2C11, BioLegend, San Diego, CA), CD4-biotin (clone RM4-5, eBioscience, San Diego, CA), CD8-biotin (clone 53-6.7, Becton, Dickinson and Company, Franklin Lakes, NJ), CD11b-biotin (clone M1/70, Becton, Dickinson and Company), CD19-biotin (clone 6D5, BioLegend), Gr1-biotin (clone RB6-8C5, Biolegend), Ter119-biotin (clone Ter-119, Biolegend) and CD45R-biotin (clone RA3-6B2, Biolegend). To isolate LSK, CMP and GMP, lineage stained cells were stained with: Streptavidin APC-Cy7 (Becton, Dickinson and Company), CD16/32-PerCp-ef710 (clone 93, eBioscience), CD117-APC (clone 2B8, Becton, Dickinson and Company), Sca-1-Pe-Cy7 (clone D7, Becton, Dickinson and Company) and CD34-BV421 (clone RAM34, Becton, Dickinson and Company). GMP and CMP gates were set using CD34 FMO.
To isolate Irf8-GFP and Gfi1-GFP GMP subpopulations, the LSK, CMP, GMP panel was supplemented with CD115-BV605 (clone TR15-12F1 2.2, BioLegend). MDP were analyzed by adding CD115-BV605 (clone TR15-12F1 2.2, Biolegend) and CD135-PE (A2F10.1, eBioscience) to the LSK, CMP, GMP panel. To isolate LK CD34+, mouse bone marrow cells were stained with CD3-biotin (clone 145-2C11, Biolegend), CD4-biotin (clone RM4-5, eBioscience), CD8-biotin (clone 53-6.7, Becton, Dickinson and Company), CD19-biotin (clone 6D5, BioLegend), CD45R-biotin (clone RA3-6B2, BioLegend), Streptavidin APC-Cy7 (Becton, Dickinson and Company), CD16/32-PerCp-ef710 (clone 93, eBioscience), CD117-APC (clone 2B8, Becton, Dickinson and Company), Sca-1-Pe-Cy7 (clone D7, Becton, Dickinson and Company), Gr1-FITC (clone RB6-8C5, Becton, Dickinson and Company) and CD34-BV421 (clone RAM34, Becton, Dickinson and Company).
Eosinophil differentiation was assayed by staining washed CFU cells with CCR3-FITC (clone 83101, R&D Systems) and SiglecF-PE (clone_E50-2440, Becton, Dickinson and Company). Cells analyzed by flow were briefly ACK treated before filtering.
Cell sorting was performed on MoFloXDP (Beckman Coulter, Brea, CA) or BD FACSAria II with a 100µm nozzle. Flow cytometric analyses were performed on FACS LSR Fortessa (Becton, Dickinson and Company). Data were analyzed with FlowJo Software (TreeStar, Ashland, OR). For flow cytometric statistics, a t-test was performed from at least 3 independent experiments.
RNA-Seq
To ensure maximum cell integrity, C57BL/6J mice between 6–8 weeks of age were sacrificed in the morning, cells were sorted at noon and loaded on the microfluidics chamber at 2PM. Single cell LSK, CMP, GMP and CD34+Lin−CD117+ cells were prepared using the C1™ Single-Cell Auto Prep System (Fluidigm, San Fransisco, CA), according to the manufacturer’s instructions. In short, flow-sorted cells were counted and resuspended at a concentration of 35,000 cells per 100 µl PBS then loaded onto a primed C1 Single-Cell Auto Prep Integrated Fluidic Chip for mRNA-Seq (5–10 µm). After the fluidic step, cell separation was visually scored, between 55–86 single cells were normally captured. Cells were lysed on chip and reverse transcription was performed using Clontech SMARTer® Kit using the mRNA-Seq: RT + Amp (1771×) according to the manual. After the reverse transcriptase step, cDNAs were transferred to a 96 well plate and diluted with 5 µl C1™ DNA Dilution Reagent. cDNAs were quantified using Quant-iT™ PicoGreen® dsDNA Assay Kit (Life Technologies, Grand Island, NY) and Agilent High Sensitivity DNA Kit (Agilent Technologies (Santa Clara, CA). Libraries were prepared using Nextera XT DNA Library Preparation Kit (Illumina Inc, Santa Clara, CA) on cDNAs with an initial concentration>180 pg/µl that were then diluted to 100 pg/µl. In each single-cell library preparation, a total of 125pg cDNA was tagmented at 55 °C for 20 minutes. Libraries were pooled and purified on AMPure® bead-based magnetic separation before a final quality control using Qubit® dsDNA HS Assay Kit (Life Technologies, Grand Island, NY) and Agilent High Sensitivity DNA Kit. We required the majority of cDNA fragments to be between 375–425bp to qualify for sequencing. For bulk RNA-Seq, RNA was isolated from LSK, CMP and GMP cells using RNeasy Micro Kit (Qiagen, Valencia, CA). Libraries were prepared from one microgram of total RNA with TRUseq Stranded mRNA HT kit (Illumina Inc., San Diego, CA). Both bulk and single cell libraries were subjected to paired-end 75bp RNA-Seq uencing on a HiSeq 2500 (Illumina Inc., San Diego, CA). 96 scRNA-Seq libraries were sequenced per HiSeq 2500 gel (~300 million bp/gel).
ChIP-Seq
Mouse GMP were fixed with 1% formaldehyde for 15 min and quenched with 0.125 M glycine. Chromatin was isolated by the addition of lysis buffer, followed by disruption with a Dounce homogenizer. Lysates were sonicated and the DNA sheared to an average length of 300–500bp. Approximately 20 mice were needed to obtain enough GMP to generate the chromatin used for each ChIP-Seq library. Genomic DNA (Input) was prepared by treating aliquots of chromatin with RNase, proteinase K and heat for de-crosslinking, followed by ethanol precipitation. Pellets were resuspended and the resulting DNA was quantified on a NanoDrop spectrophotometer. Extrapolation to the original chromatin volume allowed quantitation of the total chromatin yield. An aliquot of chromatin (30 ug) was precleared with protein A- (for Gfi1) or protein G- (for Irf8) agarose beads (Life Technologies, Grand Island, NY). Genomic DNA regions of interest were isolated using 4 ug of antibody against Gfi131 or Irf8 (sc-6058, Santa Cruz, Dallas, Tx). Complexes were washed, eluted from the beads with SDS buffer, and subjected to RNase and proteinase K treatment. Crosslinks were reversed by incubation overnight at 65 °C, and ChIP DNA was purified by phenol-chloroform extraction and ethanol precipitation. Illumina sequencing libraries were prepared from the ChIP and Input DNAs by the standard consecutive enzymatic steps of end-polishing, dA-addition, and adaptor ligation. After a final PCR amplification step, the resulting DNA libraries were quantified and then 50 nt single end reads were sequenced on Illumina HiSeq 2500 (Gfi1) or NexSeq 500 (Irf8).
Alternatively, lineage negative bone marrow cells were lysed in cell lysis buffer (10mM Tris pH 8.0, 10mM NaCl, 0.2% NP40). Chromatin from nuclei, lysed in Nuclear lysis buffer (50mM Tris pH 8.0, 10mM EDTA, 1% SDS), was diluted in IP buffer (20mM Tris pH 8.0, 2mM EDTA, 150mM NaCl, 1% Triton X-100, 0.01% SDS) and sheared using a Bioruptor (Diagenode, Denville, NJ). Chromatin immunoprecipitation was performed with α-H3K4me2 (pAb-035-050, Diagenode, Denville, NJ), then isolated with Protein A/G Magnetic Beads (Pierce, Rockford, IL). After uncrosslinking, libraries were prepared (llumina Inc.) and sequenced on Genome Analyzer II (Illumina Inc). Cebpα ChIP-Seq fastq were downloaded from NCBI/GEO/GSE43007. ATAC-Seq in GMP was downloaded from NCBI/GEO/GSE59992.
RNA-Seq and ChIP-Seq Data Processing
RNA and ChIP-Seq reads were aligned to the reference mm9 mouse genome using Bowtie238. Single-cell and bulk sorted RNA-Seq were analyzed using RSEM to estimate transcripts per million mapped reads (TPM) for all genes39. Genomic aligned sequences were visualized with IGV40. In order to identify sub-populations of 3 cells, present at 10%, a minimum of 30 cells was required. For primary discovery analyses n>90 was required. Differentially expressed genes were identified using AltAnalyze using a FDR adjusted empirical Bayes moderated t-test p<0.05. Hierarchical clustering and heat map visualization was produced using AltAnalyze and R41. All AltAnalyze heatmaps are scaled to a contrast factor 2.5 and median-centered normalized. Details on the ICGS analysis pipeline and GG1/IG2 associated population identification are detailed in Supplementary Information.
ChIP-Seq peaks were called using Homer software42 using options “-style factor, -size 500 minDist 1000”. ChIP-Seq heat plot was generated in R using heatplot utility from bioconductor package “made4”43,44. For visualization, RNA and ChIP-Seq were processed and aligned to mm10 using Biowardrobe45 (which requires mm10). Tracks were displayed using UCSC Genome Browser46.
The data sets are reposited in GEO as a SuperSeries under GSE70245. ICGS ordered cells and gene expression profiles can be queried and visualized for selected gene and gene-sets of interest at http://www.altanalyze.org/hematopoietic.html.
RT-PCR
High capacity cDNA reverse transcription kit (Applied Biosystems, Foster City, CA) was used to generate cDNA. Quantitative PCR was performed using Taqman universal master mix (Applied Biosystem) and the following gene expression assays (Applied Biosystems): Csf1r (Mm00432689_m1), Egr1 (Mm00656724_m1), Ela2 (Mm00469310_m1), Epx (Mm00514768_m1), Fos (Mm00487425_m1), Gata1 (Mm01352636_m1), Gata2 (Mm00492301_m1). Gapdh (Mm99999915_g1), Gfi1 (Mm00515855_m1), Il5ra (Mm00434284_m1), Irf8 (Mm00492567_m1), JunB (Mm04243546_s1), Meis1 (Mm00487664_m1), Pbx (Mm04207617_m1) and Prg2 (Mm01336479_m1).
Methyl cellulose assays and liquid culture
For methyl cellulose assays, 750 sorted GMP or 10,000 lineage negative BM cells were mixed with 1ml M3534 (StemCell Technologies, Vancouver, Canada) supplemented with penicillin-streptomycin and plated in a 35mm gridded plate. Colonies were scored from triplicate plates after 7 days. Colonies containing at least 30 cells were scored. CFU-G, CFU-M and CFU-GM scoring was based on colony appearance and morphology, as exemplified in Extended Data Fig. 9a. Dispersed colonies with large oval/round cells with a grainy or grey center were scored as CFU-M. Dense colonies with round, bright cells (that are uniformly smaller than CFU-M) were scored as CFU-G. Colonies with multiple cell clusters of both these types were scored as CFU-GM. To induce the G3-Gfi1-IRES-Venus (G3GV) transgene, 1µg/ml Doxycycline (SIGMA D9891) was added to either liquid or methyl cellulose media. To test Gfi1 function in CD115+ GMP, G3GV GMP were sorted for CD115 expression. CD115+/− GMP were cultured 16 hours with 1µg/ml Doxycycline. Cells were sorted for Venus expression the following day. For liquid culture, cells were maintained in serum-free StemSpan medium (StemCell Technologies) supplemented with IL-3 (10 ng/ml), IL-6 (20 ng/ml), SCF (25 ng/ml). To test Lsd1 dependency, CD117+ cells were treated with 0.5 µM LSD1-C76 (Xcessbio, San Diego, CA), for either 24 hours in liquid culture or in methylcellulose for 7 days. For IL5 driven eosinophil colony assays, Gfi1-GFPdim, Cd115− GMP were plated in M3231 (StemCell Technologies) supplemented with IL-3 (20 ng/ml), IL-5 (50 ng/ml), GM-CSF (10ng/ml), SCF (25 ng/ml) or IL-5 (50 ng/ml) and SCF (25 ng/ml) only. Cytospins were prepared by washing the cells twice in PBS. 10,000 cells were loaded onto VistaVision™ HistoBond (VWR, Radnor, PA) slides using a Cytospin 4 Cytocentrifuge (Thermo Fisher Scientific, Waltham, MA). Slides were dried overnight and then stained with Camco™ Stain Pak (Cambridge Diagnostic Products, Inc, Fort Lauderdale, FL).
Extended Data
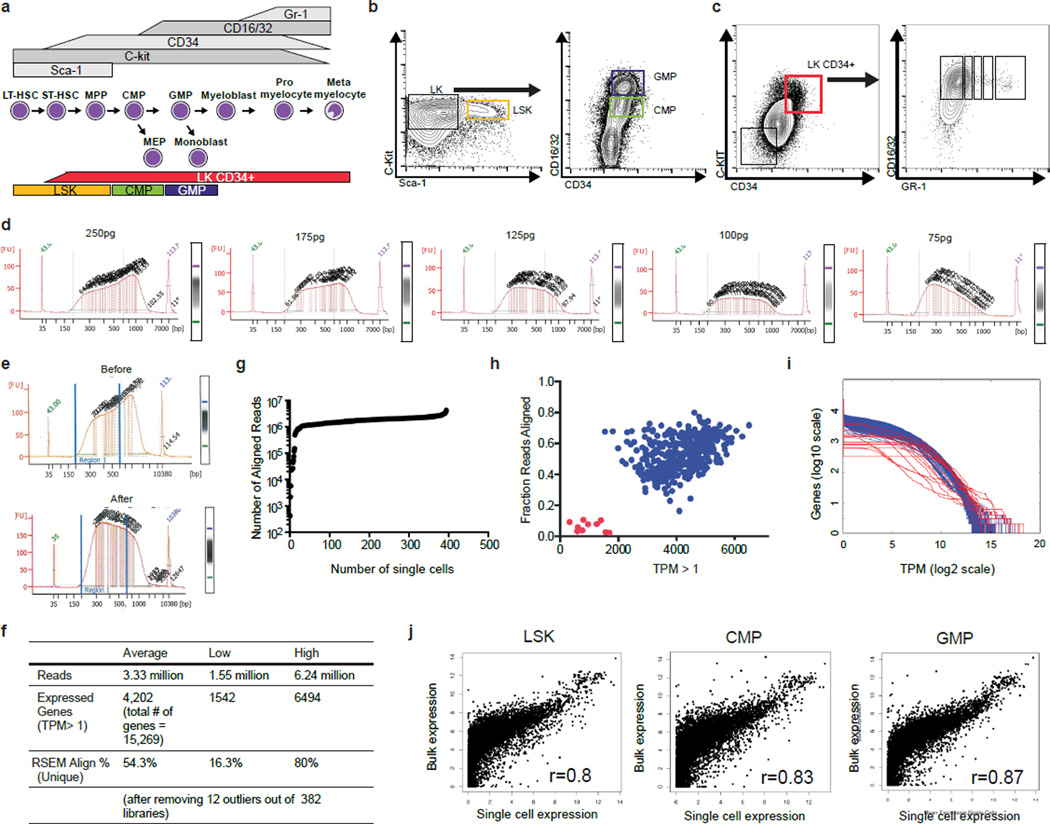
Extended Data Figure 1. Experimental design, optimization, quality control, and validation of scRNA-Seq data.
a, Schematic illustrating hematopoietic intermediates that constitute the myeloid developmental pathway in the bone marrow. Select cell surface markers expressed by the various intermediates are indicated (top). The murine bone-marrow populations used for scRNA-Seq are color coded and indicated at bottom of schematic. b, Flow cytometry strategy for isolation of LSK, CMP, and GMP hematopoietic subsets. c, Sorting strategy for lineage negative CD117+CD34+ (LK CD34+) myeloid progenitor-precursor populations. d, Optimization of size of single-cell RNA-Seq library fragments by varying the amount of input cDNA (amount shown on top of each electropherogram). e, Single-cell RNA-Seq library fragment distribution before and after optimization reveals an increase in reads that can be mapped to the genome (reads mapping to a single genomic/transcriptomic location using BowTie2/TopHat2; 61.8% before and 83.5% after optimization). f, Single-cell RNA-Seq summary statistics. g, Distribution of number of aligned reads for single-cell RNA-Seq libraries. h, Scatter plot of the fraction of aligned reads (y-axis: RSEM-transcriptome-aligned reads relative to the total number of sequenced reads) versus the total number of genes with a TPM >1 (x-axis) for each cell. RNA-Seq libraries in red were considered outliers and eliminated from downstream analyses. Of the 96 LSK, 96 CMP, 136 GMP and 66 LKCD34+ libraries that were sequenced, 3 LSK, 2 CMP, 4 GMP and 3 LKCD34+ samples failed the QC analysis. i, Histogram showing the inverse cumulative count of genes for each sequenced cell greater than the TPM cutoff in each bin (200 bins, red samples represent outliers from ED Fig. 1h). j, Correlation between bulk RNA-Seq (TRUseq Stranded mRNA HT kit) for each sorted population compared to average single-cell gene expression values from the same sort (e.g. LSK, CMP, or GMP).
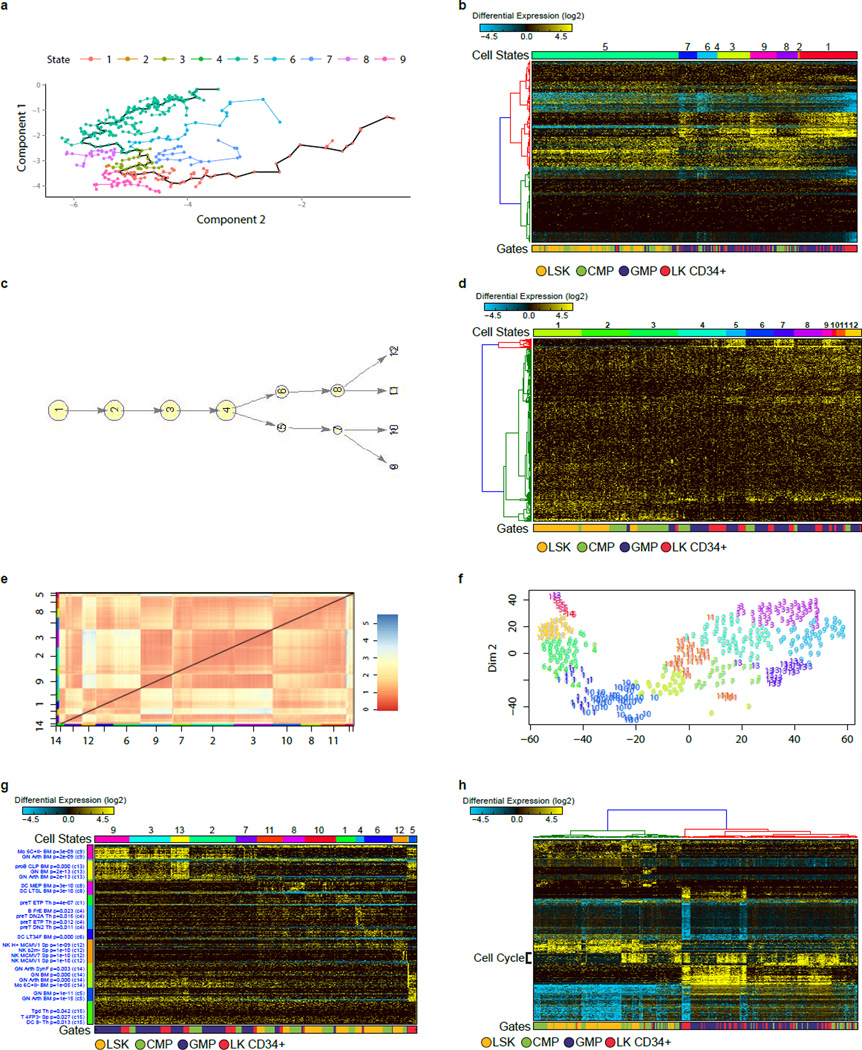
Extended Data Figure 2. Analysis of scRNA-Seq data with Monocle, SCUBA, RaceID and PCA.
a, Pseudotemporal ordering of all 382 hematopoietic progenitors along the 9 identified Monocle cell states. These states were identified from the original four annotated flow cytometric gates, based on 5,110 Monocle identified genes (p<0.01). b, Hierarchical clustering of the 1000 most significant genes for the 9 Monocle states (correlation and ward hierarchical clustering for genes). c, SCUBA pseudotemporal ordered cell states. d, Hierarchically clustering of the 1000 most variable SCUBA genes. e, RaceID identified k-means cell clusters. f, RaceID t-SNE visualization of these cells and k-means cell states. g, Heatmap of the t-SNE based cell-state ordering and the top 150 most significant RaceID genes associated with each of the 14 k-means clusters. Gene-set predictions are assigned on the left of the heatmap following ImmGen gene-set enrichment analysis in AltAnalyze. h, Hierarchical clustering of 584 PCA identified genes using the workflow outlined by Treutlein B, et al.47.
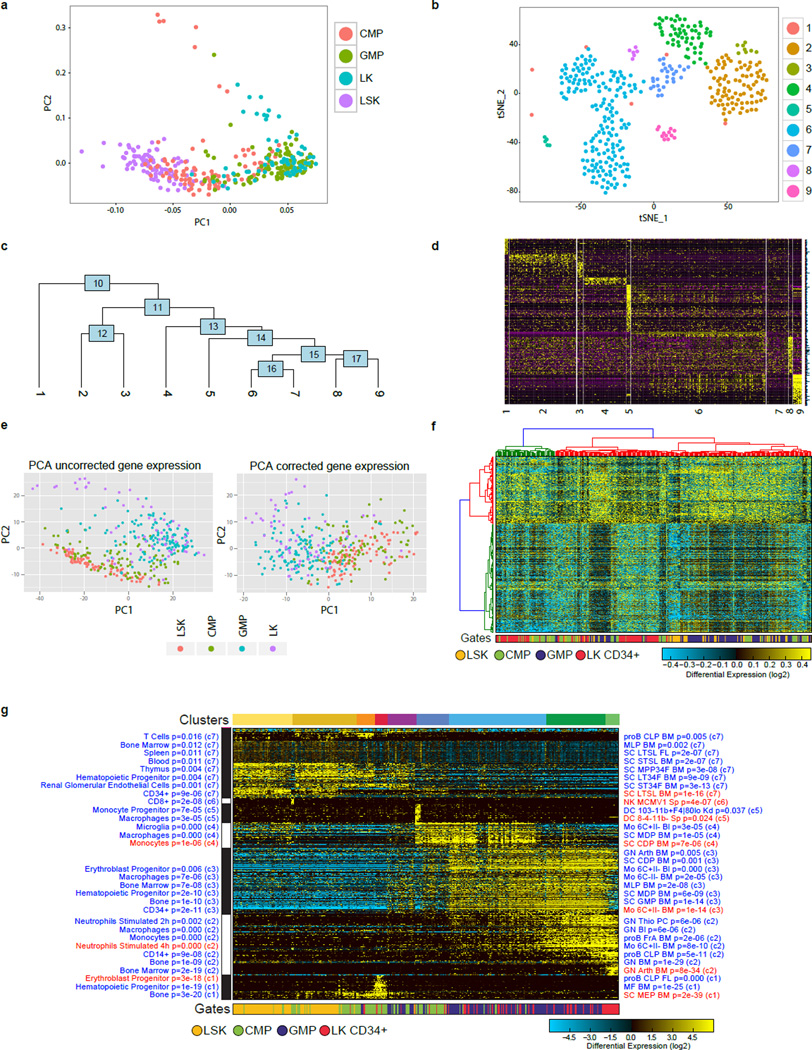
Extended Data Figure 3. Analysis of scRNA-Seq data with Seurat, scLVM and ICGS.
a, Seurat significant gene weighted PCA, colored by the sorted cell population annotations. b, Seurat t-SNE displayed output for the 9 predicted cell states. c, Seurat hierarchical relationships between the predicted cell states, based on 161 differentially expressed genes. d, Expanded 766 significant genes displayed along the Seurat ordered cell states. e, Uncorrected PCA using the top 2361 scLVM variance genes (left). PCA upon the scLVM corrected normalized expression matrix (right). f, Hierarchically clustered heatmap using the top 2361 genes from the corrected scLVM normalized expression matrix. g, ICGS analysis and integration of cell-type prediction analyses in AltAnalyze. ICGS produced expression heatmap for the hematopoietic progenitor scRNA-Seq data. On the right hand side of the ICGS heatmap are the default predicted GO-Elite BioMarker enrichment predictions (60 top-genes for each of the 300 cells/tissue microarray datasets evaluated) for each HOPACH cluster. On the left is a similar set of gene-set enrichments derived in AltAnalyze for all mouse ImmGen profiles (enrichment analysis and visualization available through the AltAnalyze heatmap viewer). Fisher-Exact enrichment p-values are displayed with each term along with the associated HOPACH cluster number. Terms used to derive the final predicted cell-types are manually highlighted in red.
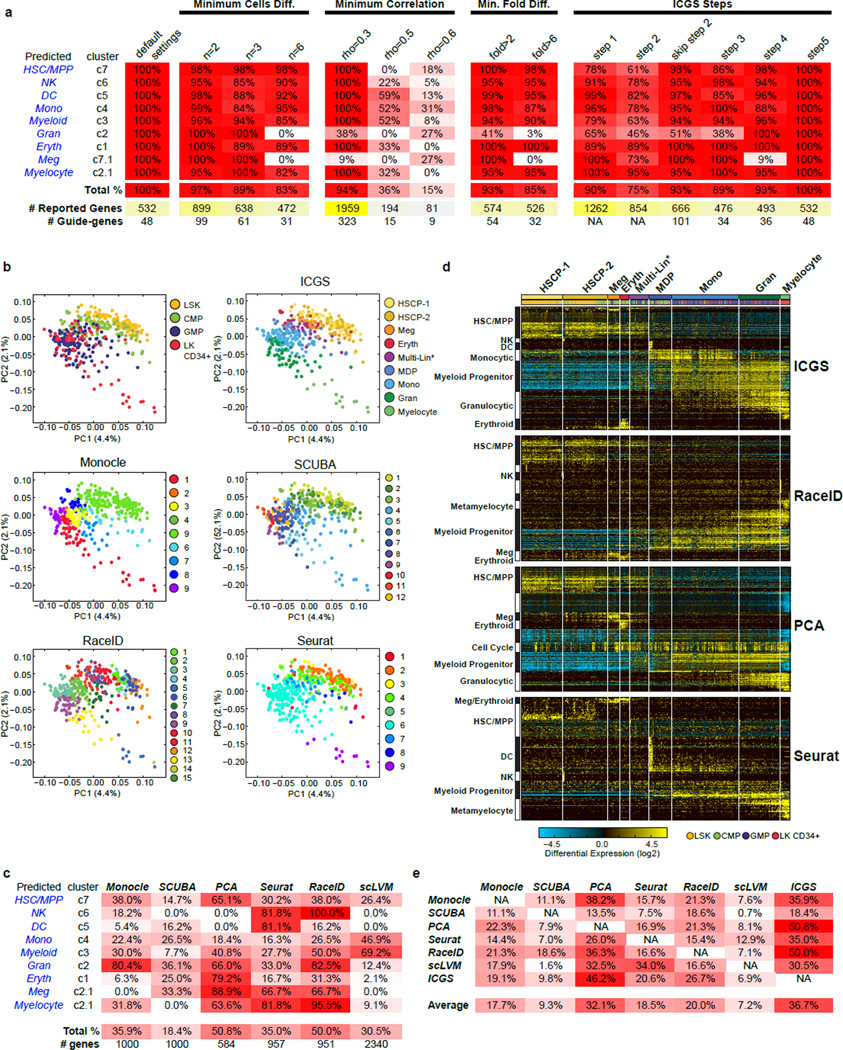
Extended Data Figure 4. Comparing ICGS with Monocle, SCUBA, RaceID, PCA, Seurat, and scLVM for the analysis of scRNA-Seq data.
a, Table comparing ICGS derived cell population gene-set results using different ICGS parameters. These parameters include minimum cells differing between the highest and lowest values for a gene for an indicated minimum fold difference and minimum Pearson correlation threshold. The results indicated under ICGS Steps refers to the gene outputs from each step of ICGS or from the entire workflow with exclusion of step 2. b, PCA visualization of the first two principal components of all expressed genes (ICGS step 1), following z-score normalization of all TPM values. Cells are colored according to the flow cytometric gate (top left), according to their ICGS clusters (top right) or for cell populations indicated by the different evaluated algorithms (Monocle, SCUBA, RaceID, Seurat). c, Table comparing ICGS derived cell population gene-sets for different scRNA-Seq algorithms. d, Direct comparison of gene expression results from different selected scRNA-Seq algorithms. All cells are ordered based on the ICGS output and genes clustered by HOPACH. Gene set enrichment analysis results for ICGS delineated gene populations (GO-Elite) are displayed to the left of each HOPACH gene cluster. e, Table comparing the relative overlap of the top significant gene sets produced by each of the scRNA-Seq algorithms.
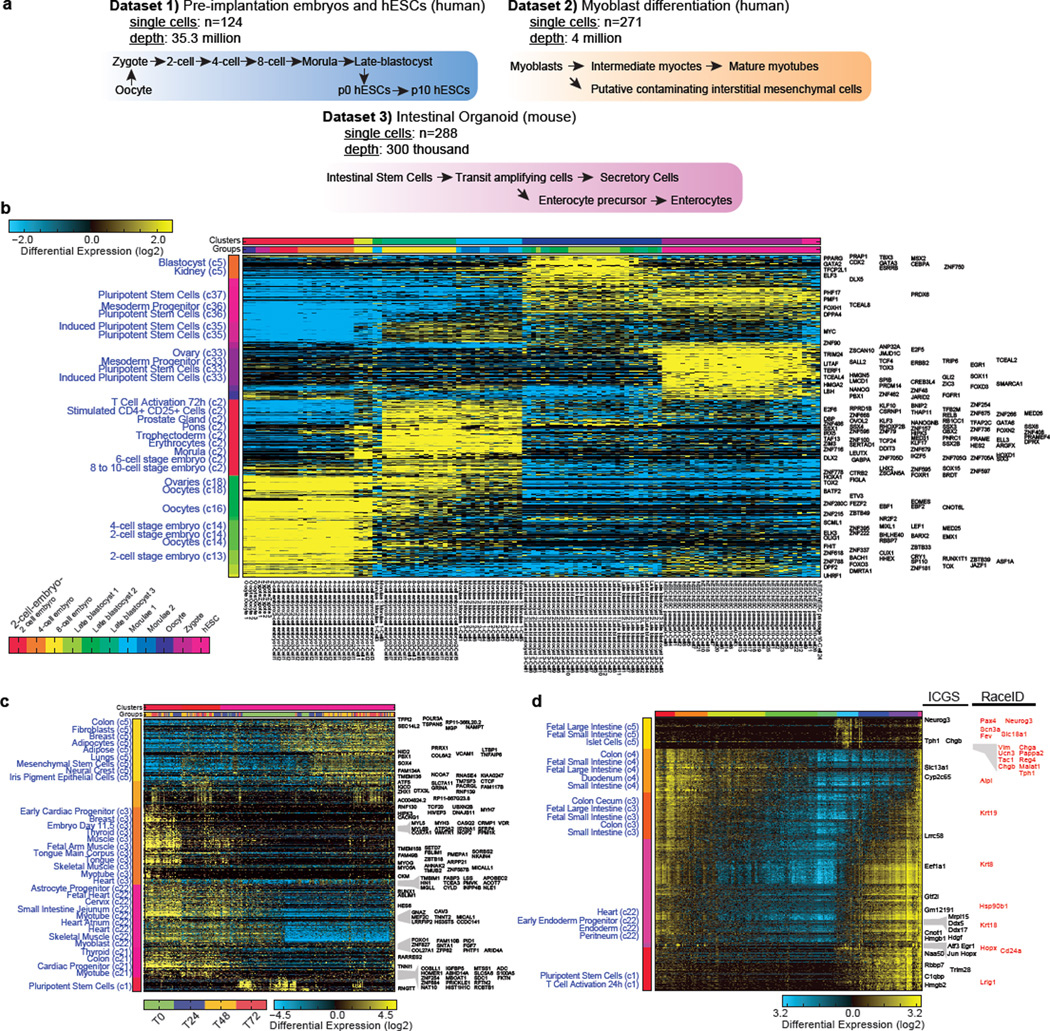
Extended Data Figure 5. Application of ICGS to diverse scRNA-Seq datasets.
a, Schematic overview of published embryonic5, myoblast4 and intestinal organoid1 scRNA-Seq datasets. b, HOPACH generated clusters derived using ICGS for human scRNA-Seq data for pre-implantation embryos and embryonic stem cells. c, HOPACH generated clusters using ICGS for human myoblast differentiation, without inclusion of cell cycle associated genes. d, HOPACH generated clusters using ICGS for mouse intestinal organoids1 for the discovery of rare cell populations. Novel rare population markers reported by the original study authors are highlighted in red. To the left of the heatmaps are predicted cell-types and tissues using AltAnalyze enrichment analysis (GO-Elite algorithm), using gene-sets from the imbedded MarkerFinder database. Enriched terms are ordered based on significance from the bottom to top in each indicated HOPACH cluster. Genes to the right of the heatmap are guide genes delineated by ICGS. The color bars above the heatmaps indicate either HOPACH clusters or input cell identities.
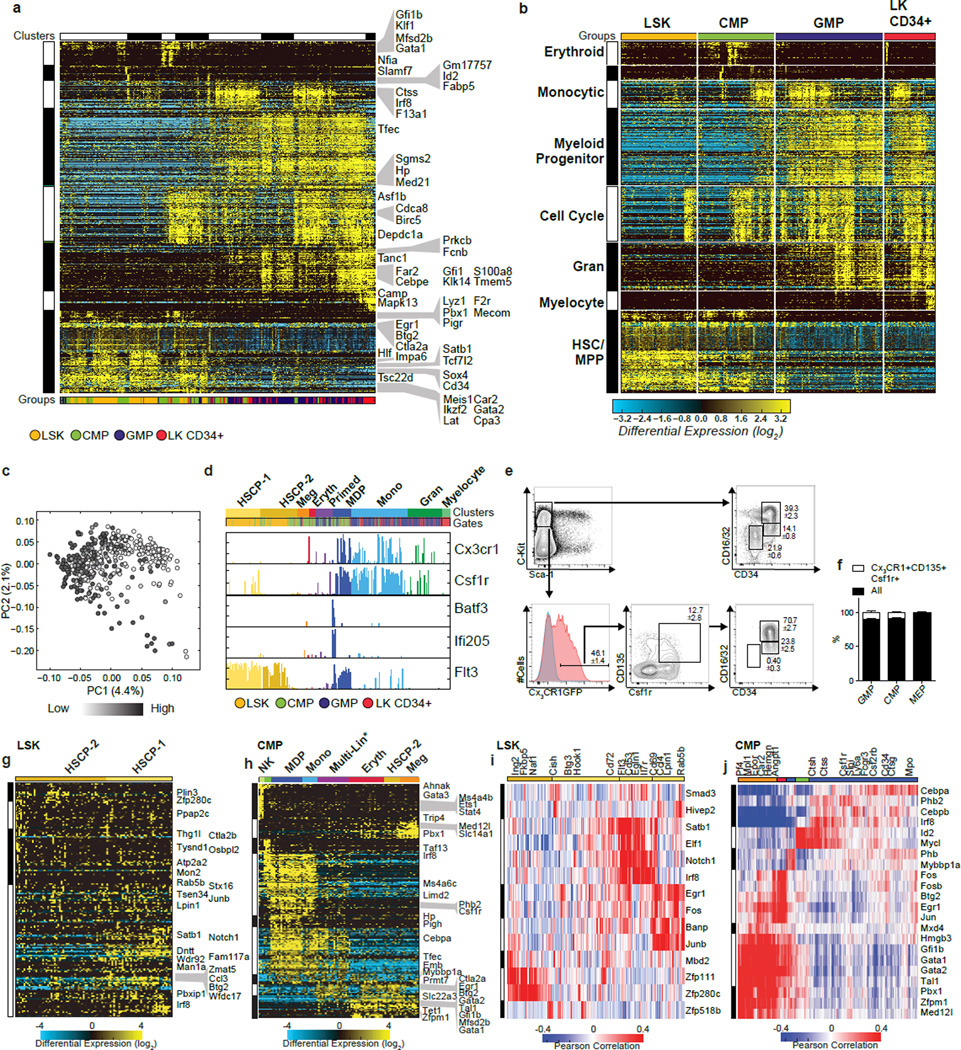
Extended Data Figure 6. Cell cycle, Monocyte-Dendritic Precursor, and TF-gene correlation analyses.
a–c, Activation of a mitotic gene expression program in developmentally distinct cell populations. a, Heatmap of single-cell ICGS-gene-expression clusters generated (in AltAnalyze using the HOPACH algorithm) with the allowed inclusion of cell-cycle regulators as guide genes. Each column represents a single-cell library. Each row represents a different gene. ICGS-identified guide genes are indicated to the right of each plot. ICGS-identified HOPACH clusters are indicated at the top. b, ICGS from panel a, reordered by gates used for flow cytometric isolation (indicated at the top). Cell-types (to the left) were predicted using GO-Elite (AltAnalyze) and ToppGene enrichment analysis, in addition to prior literature knowledge. c, PCA visualization of the first two principal components of all expressed genes (ICGS step 1), following z-score normalization of all TPM values. Cells shaded to signify the mean expression of cell-cycle-associated genes (GO:0022402). d–f, Macrophage-dendritic precursors (MDP) and nascent dendritic cells within myeloid progenitor gates. d, Column plots displaying the incidence and amplitude of expression of select genes (in Fig. 1b ICGS-clustered order; “Clusters” at the top). The origin (flow-cytometric-gate) of each cell is indicated (“Gates” at the top). Expression of Flt3, Csf1r and Cx3CR1 identifies MDP, while expression of Batf3 and Ifi205 suggests dendritic cell differentiation. e, Flow cytometric analysis of lineage negative Cx3CR1-GFP+ mouse bone marrow cells confirms the presence of phenotypic CD135+(Flt3), CD115+(Csf1r) MDP in CMP and GMP gates. f, Bar graph representing the relative abundance of MDP within each gate ± SEM. Average of three biological replicates represented, percent parent represented in flow plots ± SEM (n=3). g–j, TF-to-gene correlation analysis. g, ICGS clustering of LSK cells (n=93) with cell-cycle genes excluded. h, ICGS clustering of CMP cells (n=94) with cell-cycle genes excluded. ICGS selected guide genes are displayed on the right of each heatmap. i, Heatmap displays clustering of Pearson correlation coefficients among genes and TFs using HOPACH, with corresponding ICGS clusters from LSK in panel g. j, Heatmap displays clustering of Pearson correlation coefficients among genes and TFs using HOPACH, with corresponding ICGS clusters from CMP in panel h. Columns represent genes and rows transcription factors (TF) that are captured by the ICGS analysis of CMP cells.
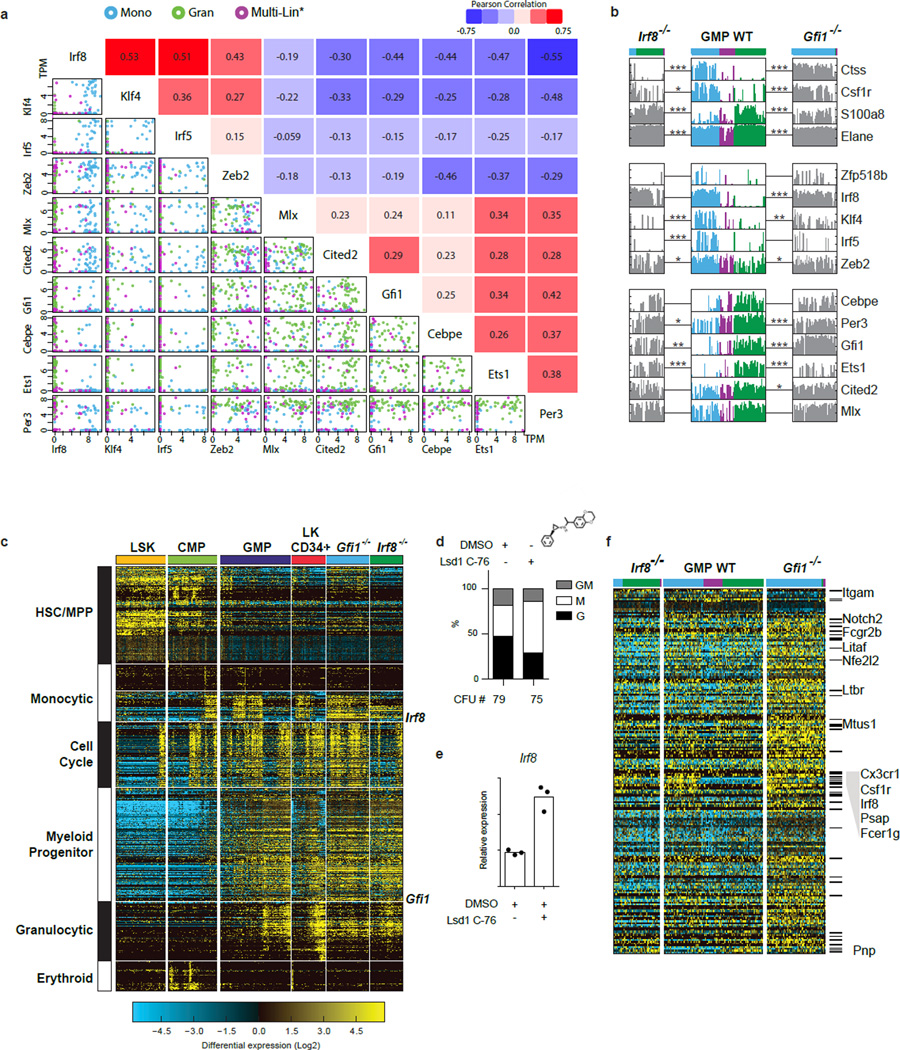
Extended Data Figure 7. TF to TF correlations, and TF loss-of-function analyses.
a, Scatterplots reveal the single-cell structure underlying correlations between TFs. Scatterplots generated in R (using the pairs function) show TPM of select transcription factor pairs in individual GMPs (colors corresponding to ICGS groups in Fig. 1d, top). Expression is given as TPM. Pearson correlation coefficients are indicated opposite to each plot. b, Plots displaying the incidence and amplitude of expression of select genes in Fig. 2a. Expression clusters of Irf8-high (blue) and Gfi1-high (green) or neither (Multi-Lin*; purple) are delineated. Significant changes in expression of key genes between Irf8−/− versus Irf8-high WT GMP, or Gfi1−/− versus Gfi1-high WT GMP are noted (* p<0.05, ** p<0.01, *** p<0.001 Benjamini-Hochberg adjusted). Note that Irf8−/− and Gfi1−/− GMP continue to express non-productive transcripts emanating from the mutant Gfi1 and Irf8 alleles. c. Gfi1−/− GMPs show a significant increase in cell cycle-related gene expression compared to wildtype or Irf8−/− GMPs. HOPACH clustering of Gfi1−/− and Irf8−/− GMPs using hematopoietic guide genes from Fig. 2a. All cells were first clustered by HOPACH and then grouped according to sorting gates. In agreement with our previous report that Gfi1 controls two genetically separable programs; granulopoiesis and Hox-based myeloid progenitor proliferation25, Gfi1−/− GMP demonstrate significantly increased HSC and cell-cycle-associated gene expression. Cell cycle associated genes were enriched (z-score>1.96) in Gfi1−/− and depleted (z-score <−1.96) in the Irf8−/− GMPs. d–e Lsd1 inhibition results monocytic colony formation and increased Irf8 expression. d, CFU assays performed with CD117+ bone marrow cells −/+ treatment with an Lsd1 inhibitor (GSK C-76). Y-axis displays percent distribution of colony types. Mean CFU number of three technical replicates shown. e, TaqMan analysis of Irf8 expression in CD117+ bone marrow cells −/+ treatment with C-76 (16 h). Mean of three technical replicates with similar results from 3 biological replicates. Representative plot from one of three independent experiments performed displayed (d,e). f, Heat map showing the expression of a subset of genes (214) associated with Gfi1 and Irf8 shared ChIP-Seq peaks. All displayed genes are significantly differentially expressed (p<0.05, Benjamini Hochberg adjusted) among at least one of the four comparisons (Irf8−/− versus WT; Irf8−/− versus Irf8-high WT; Gfi1−/− versus WT; Gfi1−/− versus Gfi1-high WT). Marked genes (−) are associated with ImmGen monocyte-dendritic-precursor genes sets, and named genes are associated with abnormal mononuclear cell morphology (Mouse Phenotype Ontology). c, Gfi1 (green), Irf8 (blue) and Cebpα (red) ChIP-Seq and RNA-Seq tracks illustrating co-regulation at select loci. Gfi1 and Irf8 ChIP-Seq and bulk RNA Seq were performed using wild-type GMP (as in ED Fig. 1j). Cebpα ChIP-Seq data was obtained from GEO record GSE43007. Significant peaks called by MACS are represented as bars under each ChIP-Seq track. Regions that have called peaks overlapping for Gfi1, Irf8 and Cebpα are highlighted by a box. Strand specific RNA seq are displayed as black and grey peaks, respectively. RefSeq gene structure presented at bottom.
Extended Data Figure 8. Counter-acting functions of Irf8 and Gfi1 in myeloid cell fate choice.
a, Gfi1, Irf8 and Cebpα ChIP-Seq and RNA-Seq tracks illustrating coregulation at select loci. Gfi1 and Irf8 ChIP-Seq were carried using crosslinked wild type GMP whereas the RNA-Seq were performed using wild type GMP. Cebpα ChIP-Seq data was obtained from GEO record GSE43007. Significant peaks called by MACS are represented as bars under each ChIP-Seq track. Regions that have called peaks overlapping for Gfi1, Irf8 and Cebpα are highlighted by a box. Strand specific RNA seq are displayed as black and grey peaks, respectively. Refseq gene structure presented at bottom for Irf8, Gfi1, Klf4, Per3, Zeb2, and Ets1. b–d G3-tetracycline-inducible promoter-driven Gfi1 allele (G3- Gfi1-IRES-Venus eYFP = “G3GV”) results in granulocytic differentiation. b, Schematic representation of the Col1A1 locus of KH2 ES cells engineered using FLP recombinase to harbor a G3-tetracycline-inducible promoter-driven Gfi1 allele (G3-Gfi1-IRES-Venus eYFP = “G3GV”). KH2 ES cells also contain a ROSA-allele which expresses the rtTA-M2 protein. Immunoblot of Gfi1 and Venus eYFP expression in ES cells. G3GV KH2 ES cells were treated with 1µg/ml doxycycline for 48 hours, then analyzed for Gfi1 and Venus expression by immunoblotting. For gel source data, see Supplementary Figure 1. c, TaqMan analysis of gene expression in Csf1r- and Csf1r+ GMPs, +/− doxycycline induction of G3GV using one allele encoding rtTA. Mean of two technical replicates represented. d, CFU assays using lineage negative bone marrow cells from wild type B6 or G3GV knock-in mice. Cells were cultured with or without 1µg/ml doxycycline, in methylcellulose media. Percent distribution of colony types is displayed on y-axis. Mean CFU number ± SEM (bottom) (n=3 wells per condition). Representative plot from one of three independent experiments performed displayed (c,d)
Extended Data Figure 9. Bi-potential GG1 cells comprise transcriptionally distinct progenitor populations.
a, Colony appearance of CFU-G, -M and GM- respectively. Photos taken with a 10× objective. b, ICGS analysis of GG1 cells with those spanning the entire myeloid developmental spectrum (Fig. 1b). Cells were separated according to the flow cytometric sort gates. c, Hierarchical clustering using genes in panel b that are expressed in GG1 cells (TPM>1) identifies four distinct sub clusters. d, Finding GG1-like cells in the existing scRNA-Seq data set. HOPACH clustering of the same genes and cells from ED Fig. 9b with arrows indicating the GG1 and 16 GG1-like cells identified in the other sort gates. GG1-like cells were identified by comparing centroids from ED Fig. 9c to those from Fig. 1b HOPACH clusters, using the LineageProfiler classification option in AltAnalyze (n=16) (Supplementary Methods – Identification of Bi-Potential Single-Cell RNA-Seq Profiles). Arrows at the top of the heatmap denote GG1 and GG1-like cells. e–f, Back-gating of sorted Irf8-GFP GMP subpopulations (e; IG1, IG2, IG3) or Gfi1-GFP GMP subpopulations (f; GG1, GG2, GG3) showing that all populations are phenotypically GMP (CD16/32high CD34high).
Extended Data Figure 10. Clustering intermediates and Irf8−/−Gfi1−/− double knock-out GMP.
a–h, GMP subpopulations enriched for CFU-GM also contain eosinophil-granulocyte progenitors. a, Plots displaying the incidence and amplitude of expression of select genes (from Fig. 4a). b, TaqMan analysis of eosinophil gene expression (IL5ra, Epx, Prg2) in the GMP subpopulations from Gfi1-GFP heterozygous mice. c, CFU assays with GMP subsets in media containing IL-3, GM-CSF, IL-5, SCF and TPO. d, CFU assays with GMP subsets with media containing IL5 and SCF (which supports eosinophil-granulocyte colonies). e, TaqMan analysis of eosinophil gene expression in colonies from GG1 cells. Mean CFU number of two technical replicates with similar results from 2 biological replicates. f, Cytospin analysis of eosinophils in GG1 derived CFU from panel i. g, Flow-cytometric analysis for eosinophil-granulocyte markers CCR3 and SiglecF on colonies from GG1 cells. Nearly all the GG1-derived IL5 + SCF CFU are positive for eosinophil markers. Representative FACS plot shown. h, TaqMan analysis of eosinophil genes (IL5ra, Epx, Prg2) in the GMP subpopulations from Irf8-GFP heterozygous mice. i, ICGS of GG1 and IG2 cells with those spanning the entire myeloid developmental spectrum (Fig. 1b). Cells were separated according to the flow cytometric sort gates. j–k, GG1 and IG1 cells that are enriched for CFU-GM also preferentially express HSCP1-and HSCP2-cluster genes. j, TaqMan analysis of HSCP1-HSCP2 genes in the GMP GG subpopulations. k, TaqMan analysis of HSCP1-HSCP2 genes in sorted IG subpopulations. l. Clustering Irf8−/−Gfi1−/− double knock-out single cell libraries. HOPACH hierarchical clustering of all cells from Fig. 1b, as well as IG2 and Irf8−/−Gfi1−/− double knock-out single cell libraries. Only genes from Fig. 1b and in the previously clustered results were included. Genes and cells outlined in the dotted box were re-clustered with HOPACH to delineate relationships between monocytic and granulocytic programming among the different indicated cell populations (Fig. 4c). Representative plot of the mean of two technical replicates from one of three independent experiments performed displayed (b,e,h,j,k).
Supplementary Material
Acknowledgments
We thank Herbert C. Morse for supplying Irf8-Gfp mice. We acknowledge the assistance of the Cincinnati Children’s Hospital Medical Center (CCHMC) Research Flow Cytometry Core (supported in part by NIH AR-47363, NIH DK78392 and NIH DK90971) and DNA Sequencing and Genotyping Core. We thank Shawn Smith and Hung Chi Liang in the CCHMC Gene Expression Core for optimizing and generating scRNA-Seq libraries. We thank Steven Potter and Jeffrey Whitsett for advice on scRNA-Seq experiments, Phillip Dexheimer and Kashish Chetal for assistance with RNA-Seq data processing, and Katherine Pollard, Larsson Omberg and Aly Khan for helpful discussions. This work was partly funded by contributions from CCRF (H.S.), CCHMC Divisions of Pathology and Oncology, and NIH R01HL122661 (H.L.G.). In memory of Eric Davidson.
Footnotes
Supplementary Information is linked to the online version of the paper at www.nature.com/nature
Author Contributions
A.O., H.S. and H.L.G. designed and interpreted experiments. A.O. performed the experiments. N.S. conceived and developed the software with significant input from B.A., H.S., and H.L.G.. M.V., V.C., B.A., N.S., H.S. and H.L.G. analyzed bioinformatics data. A.O., N.S., H.S. and H.L.G. wrote the paper.
Data is deposited as GEO SuperSeries GSE70245.
References
- 1.Grun D, et al. Single-cell messenger RNA sequencing reveals rare intestinal cell types. Nature. 2015;525:251–255. doi: 10.1038/nature14966. [DOI] [PubMed] [Google Scholar]
- 2.Paul F, et al. Transcriptional Heterogeneity and Lineage Commitment in Myeloid Progenitors. Cell. 2015;163:1663–1677. doi: 10.1016/j.cell.2015.11.013. [DOI] [PubMed] [Google Scholar]
- 3.Satija R, Farrell JA, Gennert D, Schier AF, Regev A. Spatial reconstruction of single-cell gene expression data. Nat Biotechnol. 2015;33:495–502. doi: 10.1038/nbt.3192. [DOI] [PMC free article] [PubMed] [Google Scholar]
- 4.Trapnell C, et al. The dynamics and regulators of cell fate decisions are revealed by pseudotemporal ordering of single cells. Nat Biotechnol. 2014;32:381–386. doi: 10.1038/nbt.2859. [DOI] [PMC free article] [PubMed] [Google Scholar]
- 5.Yan L, et al. Single-cell RNA-Seq profiling of human preimplantation embryos and embryonic stem cells. Nat Struct Mol Biol. 2013;20:1131–1139. doi: 10.1038/nsmb.2660. [DOI] [PubMed] [Google Scholar]
- 6.Hu M, et al. Multilineage gene expression precedes commitment in the hemopoietic system. Genes Dev. 1997;11:774–785. doi: 10.1101/gad.11.6.774. [DOI] [PubMed] [Google Scholar]
- 7.Laslo P, et al. Multilineage transcriptional priming and determination of alternate hematopoietic cell fates. Cell. 2006;126:755–766. doi: 10.1016/j.cell.2006.06.052. [DOI] [PubMed] [Google Scholar]
- 8.Dahl R, et al. Regulation of macrophage and neutrophil cell fates by the PU.1:C/EBPalpha ratio and granulocyte colony-stimulating factor. Nat Immunol. 2003;4:1029–1036. doi: 10.1038/ni973. [DOI] [PubMed] [Google Scholar]
- 9.Hambleton S, et al. IRF8 mutations and human dendritic-cell immunodeficiency. N Engl J Med. 2011;365:127–138. doi: 10.1056/NEJMoa1100066. [DOI] [PMC free article] [PubMed] [Google Scholar]
- 10.Tamura T, Nagamura-Inoue T, Shmeltzer Z, Kuwata T, Ozato K. ICSBP directs bipotential myeloid progenitor cells to differentiate into mature macrophages. Immunity. 2000;13:155–165. doi: 10.1016/s1074-7613(00)00016-9. [DOI] [PubMed] [Google Scholar]
- 11.Karsunky H, et al. Inflammatory reactions and severe neutropenia in mice lacking the transcriptional repressor Gfi1. Nat Genet. 2002;30:295–300. doi: 10.1038/ng831. [DOI] [PubMed] [Google Scholar]
- 12.Hock H, et al. Intrinsic requirement for zinc finger transcription factor Gfi-1 in neutrophil differentiation. Immunity. 2003;18:109–120. doi: 10.1016/s1074-7613(02)00501-0. [DOI] [PubMed] [Google Scholar]
- 13.Zarebski A, et al. Mutations in growth factor independent-1 associated with human neutropenia block murine granulopoiesis through colony stimulating factor-1. Immunity. 2008;28:370–380. doi: 10.1016/j.immuni.2007.12.020. [DOI] [PMC free article] [PubMed] [Google Scholar]
- 14.Akashi K, Traver D, Miyamoto T, Weissman IL. A clonogenic common myeloid progenitor that gives rise to all myeloid lineages. Nature. 2000;404:193–197. doi: 10.1038/35004599. [DOI] [PubMed] [Google Scholar]
- 15.Guibal FC, et al. Identification of a myeloid committed progenitor as the cancer-initiating cell in acute promyelocytic leukemia. Blood. 2009;114:5415–5425. doi: 10.1182/blood-2008-10-182071. [DOI] [PMC free article] [PubMed] [Google Scholar]
- 16.Bendall SC, et al. Single-cell trajectory detection uncovers progression and regulatory coordination in human B cell development. Cell. 2014;157:714–725. doi: 10.1016/j.cell.2014.04.005. [DOI] [PMC free article] [PubMed] [Google Scholar]
- 17.Marco E, et al. Bifurcation analysis of single-cell gene expression data reveals epigenetic landscape. Proc Natl Acad Sci U S A. 2014;111:E5643–E5650. doi: 10.1073/pnas.1408993111. [DOI] [PMC free article] [PubMed] [Google Scholar]
- 18.Auffray C, et al. CX3CR1+ CD115+ CD135+ common macrophage/DC precursors and the role of CX3CR1 in their response to inflammation. J Exp Med. 2009;206:595–606. doi: 10.1084/jem.20081385. [DOI] [PMC free article] [PubMed] [Google Scholar]
- 19.Orkin SH, Zon LI. Hematopoiesis: an evolving paradigm for stem cell biology. Cell. 2008;132:631–644. doi: 10.1016/j.cell.2008.01.025. [DOI] [PMC free article] [PubMed] [Google Scholar]
- 20.DeKoter RP, Singh H. Regulation of B lymphocyte and macrophage development by graded expression of PU.1. Science. 2000;288:1439–1441. doi: 10.1126/science.288.5470.1439. [DOI] [PubMed] [Google Scholar]
- 21.Zhang DE, et al. Absence of granulocyte colony-stimulating factor signaling and neutrophil development in CCAAT enhancer binding protein alpha-deficient mice. Proc Natl Acad Sci U S A. 1997;94:569–574. doi: 10.1073/pnas.94.2.569. [DOI] [PMC free article] [PubMed] [Google Scholar]
- 22.Yamanaka R, et al. Impaired granulopoiesis, myelodysplasia, and early lethality in CCAAT/enhancer binding protein epsilon-deficient mice. Proc Natl Acad Sci U S A. 1997;94:13187–13192. doi: 10.1073/pnas.94.24.13187. [DOI] [PMC free article] [PubMed] [Google Scholar]
- 23.Kurotaki D, et al. Essential role of the IRF8-KLF4 transcription factor cascade in murine monocyte differentiation. Blood. 2013;121:1839–1849. doi: 10.1182/blood-2012-06-437863. [DOI] [PMC free article] [PubMed] [Google Scholar]
- 24.Person RE, et al. Mutations in proto-oncogene GFI1 cause human neutropenia and target ELA2. Nat Genet. 2003;34:308–312. doi: 10.1038/ng1170. [DOI] [PMC free article] [PubMed] [Google Scholar]
- 25.Holtschke T, et al. Immunodeficiency and chronic myelogenous leukemia-like syndrome in mice with a targeted mutation of the ICSBP gene. Cell. 1996;87:307–317. doi: 10.1016/s0092-8674(00)81348-3. [DOI] [PubMed] [Google Scholar]
- 26.Brass AL, Zhu AQ, Singh H. Assembly requirements of PU.1-Pip (IRF-4) activator complexes: inhibiting function in vivo using fused dimers. EMBO J. 1999;18:977–991. doi: 10.1093/emboj/18.4.977. [DOI] [PMC free article] [PubMed] [Google Scholar]
- 27.Lara-Astiaso D, et al. Immunogenetics. Chromatin state dynamics during blood formation. Science. 2014;345:943–949. doi: 10.1126/science.1256271. [DOI] [PMC free article] [PubMed] [Google Scholar]
- 28.Saleque S, Kim J, Rooke HM, Orkin SH. Epigenetic regulation of hematopoietic differentiation by Gfi-1 and Gfi-1b is mediated by the cofactors CoREST and LSD1. Mol Cell. 2007;27:562–572. doi: 10.1016/j.molcel.2007.06.039. [DOI] [PubMed] [Google Scholar]
- 29.Spooner CJ, Cheng JX, Pujadas E, Laslo P, Singh H. A recurrent network involving the transcription factors PU.1 and Gfi1 orchestrates innate and adaptive immune cell fates. Immunity. 2009;31:576–586. doi: 10.1016/j.immuni.2009.07.011. [DOI] [PMC free article] [PubMed] [Google Scholar]
- 30.Voehringer D, van Rooijen N, Locksley RM. Eosinophils develop in distinct stages and are recruited to peripheral sites by alternatively activated macrophages. J Leukoc Biol. 2007;81:1434–1444. doi: 10.1189/jlb.1106686. [DOI] [PubMed] [Google Scholar]
Associated Data
This section collects any data citations, data availability statements, or supplementary materials included in this article.


