Abstract
Thirst motivates animals to drink in order to maintain fluid balance. Traditionally, thirst has been viewed as a homeostatic response to changes in the blood volume or tonicity1–3. However, most drinking behavior is regulated too rapidly to be controlled by blood composition directly and instead appears to anticipate homeostatic imbalances before they arise4–11. How this is achieved remains unknown. Here we reveal an unexpected role for the subfornical organ (SFO) in the anticipatory regulation of thirst. We show by monitoring deep-brain calcium dynamics that thirst-promoting SFO neurons respond to inputs from the oral cavity during eating and drinking, which they then integrate with information about the composition of the blood. This integration allows SFO neurons to predict how ongoing food and water consumption will alter fluid balance in the future and then adjust behavior preemptively. Complementary optogenetic manipulations show that this anticipatory modulation is necessary for drinking in multiple contexts. These findings provide a neural mechanism to explain longstanding behavioral observations, including the prevalence of drinking during meals10,11, the rapid satiation of thirst7–9, and the fact that oral cooling is thirst-quenching12–14.
Deviations of blood volume or osmolarity from their set points are detected by specialized neurons within the circumventricular organs (CVOs) of the brain1–3. Activation of these neurons generates thirst, which motivates animals to find and consume water and thereby restore fluid balance.
Nevertheless, many aspects of drinking behavior cannot be explained by this textbook homeostatic model15 because their regulation precedes rather than responds to changes in the blood4–11. For example, drinking quenches thirst tens of minutes before ingested water reaches the circulation and alters the composition of the blood, implying that thirst is sated before homeostasis is restored. Yet somehow animals calibrate their water consumption to precisely match their physiologic need7–9. Conversely, most drinking occurs during meals, as a result of prandial thirst that develops long before the ingested food has been absorbed and altered the blood tonicity10,11. These observations imply that much normal drinking behavior is anticipatory in nature, meaning that the brain predicts impending changes in fluid balance and adjusts behavior preemptively. How this is achieved remains unknown.
The CVOs are the brain regions most strongly associated with fluid balance1–3. fMRI studies failed to detect rapid modulation of these structures during drinking16,17, leading to the belief that the integratory circuits for thirst reside in higher brain centers3,18 and that the CVOs function only as passive sensors of blood composition1–3. However, this conclusion is complicated by the fact that the CVOs contain a diversity of intermingled neural cell types19,20, which cannot be discriminated by functional imaging. Importantly, current models for the thirst circuitry have never been tested by recording the dynamics of identified neurons in awake, behaving animals.
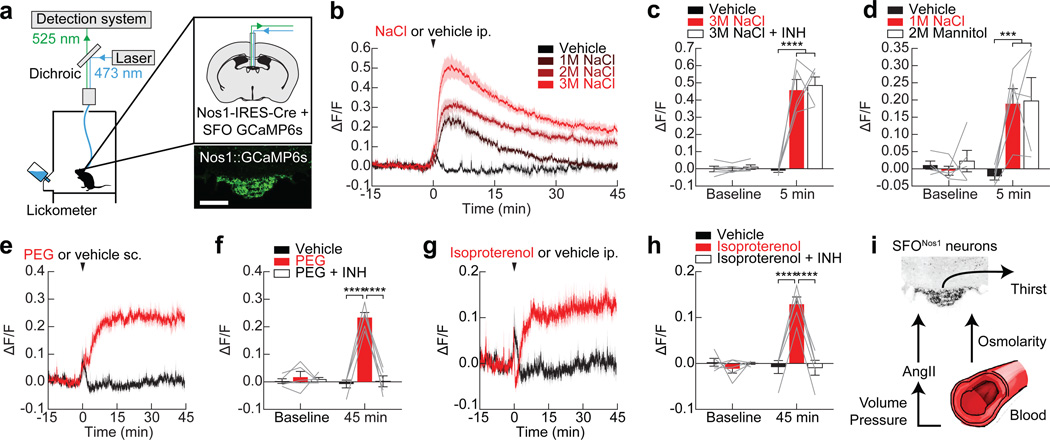
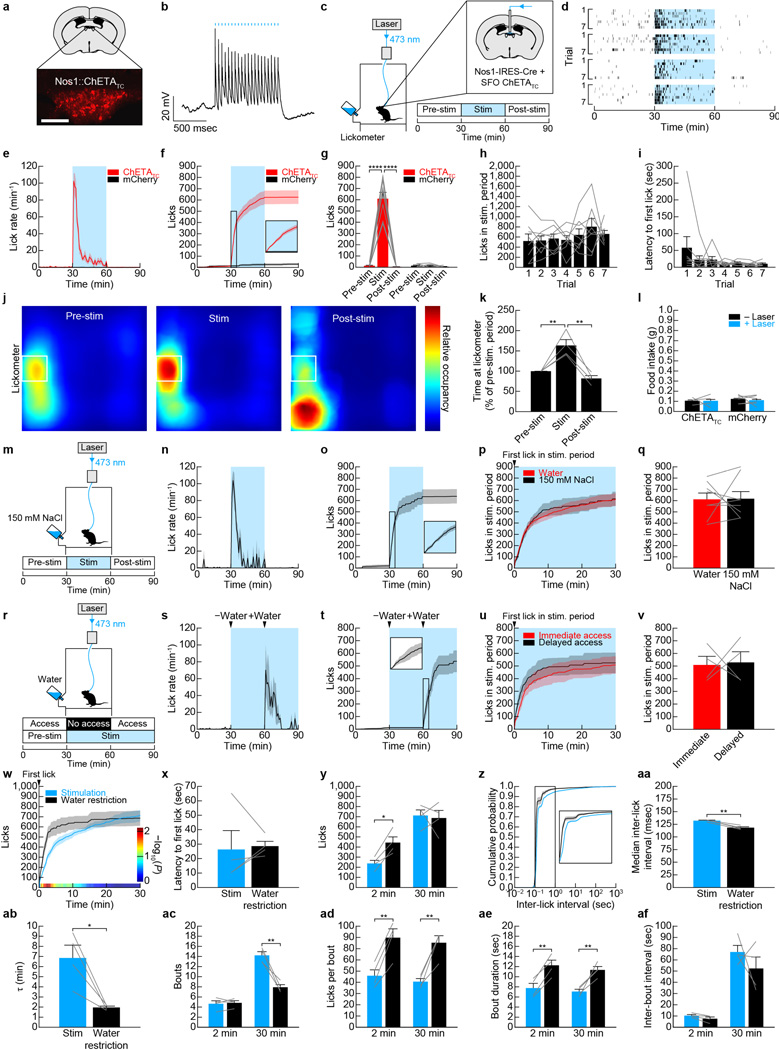
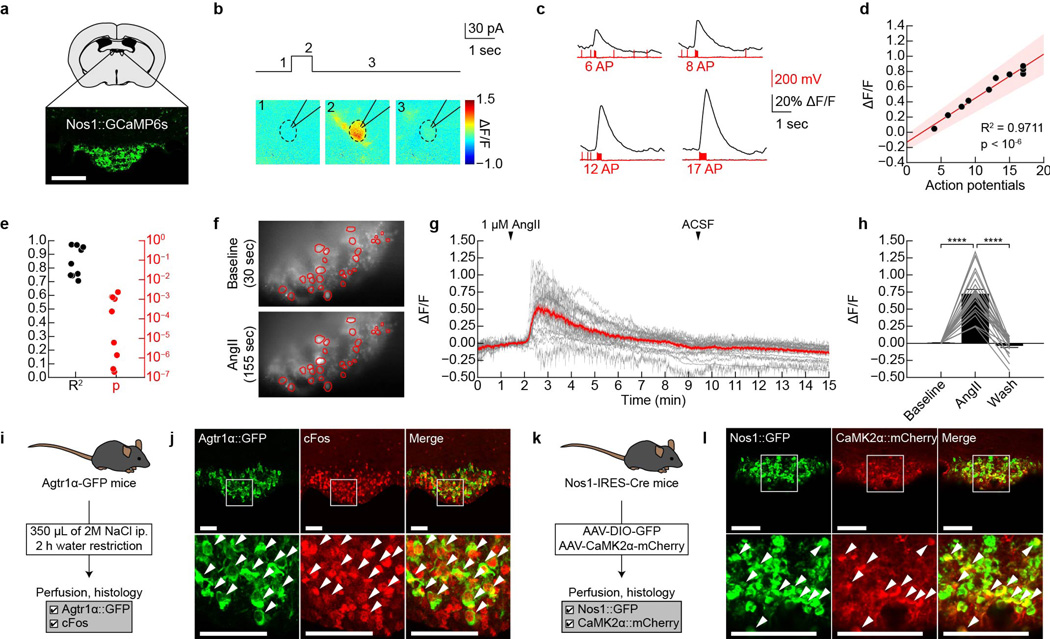
To investigate thirst circuits in vivo, we focused on the subfornical organ (SFO), a CVO that is strongly implicated in the control of drinking behavior21. Optogenetic activation of SFO excitatory neurons expressing nitric oxide synthase 1 (Nos1) promotes voracious drinking in water-sated mice19,22. We replicated this (Extended Data Fig. 1) and then targeted GCaMP6s to SFONos1 neurons for calcium imaging. We first confirmed in slice that GCaMP6s faithfully reported SFONos1 neuron activity induced by current injection or application of angiotensin (Extended Data Fig. 2). We then installed fiber optics above the SFO for recordings of population activity by fiber photometry23 in awake, behaving mice (Fig. 1a).
Figure 1. Mechanisms of homeostatic regulation of SFONos1 neurons.
a, Schematic of fiber photometry setup (scale bar, 100 µm). b, SFONos1 neurons are activated by injection of NaCl. c, Angiotensin blockers (INH) do not abolish the response to NaCl. d, SFONos1 neurons are similarly activated by equiosmotic mannitol and NaCl. e, SFONos1 neurons are activated by injection of PEG. f, Angiotensin blockers abolish the this response. g, SFONos1 neurons are activated by injection of isoproterenol. h, Angiotensin blockers abolish the this response. i, Schematic summarizing the mechanisms by which SFONos1 neurons monitor the blood. Statistical analyses are described in Methods and in Extended Data Table 1. n = 5 mice for all experiments.
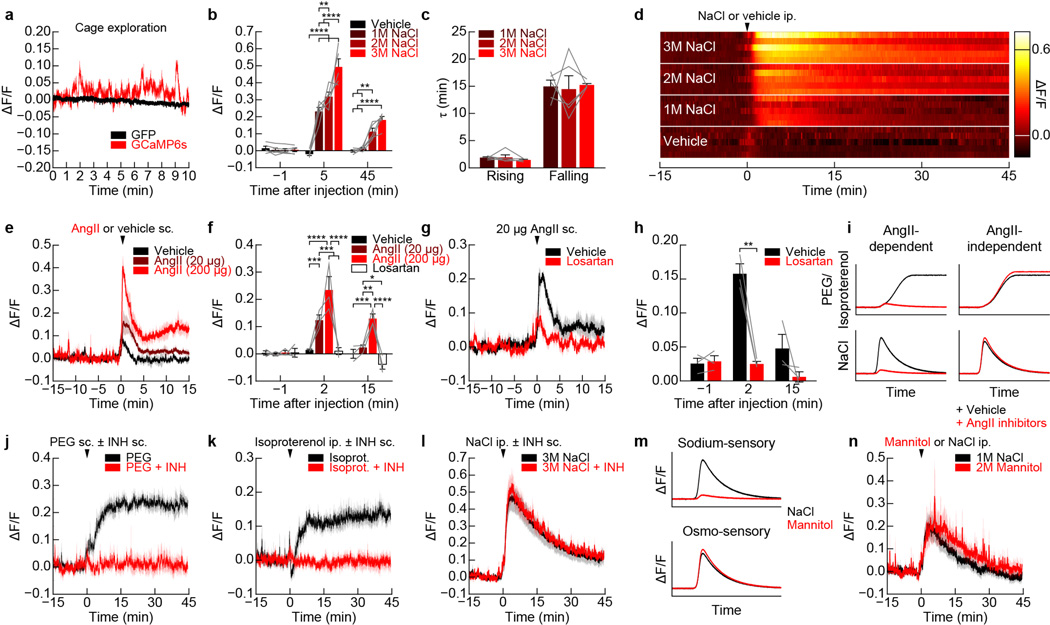
To define the regulation of SFONos1 neurons in vivo, we recorded GCaMP fluorescence responses to a series of systemic challenges24. Peripheral injection of angiotensin (Extended Data Fig. 3) or hypertonic saline (Fig. 1b) rapidly and dose-dependently activated SFONos1 neurons. The response to hypertonic saline was mediated by an osmosensory (rather than sodium-sensory) mechanism, because injection of equiosmotic mannitol25 induced a similar response (Fig. 1d). Challenge with polyethylene glycol (PEG), which induces hypovolemia26, or isoproterenol, which induces hypotension24, resulted in slower and more sustained activation of SFONos1 neurons (Fig. 1e,g). The responses to PEG and isoproterenol were abolished by pretreatment with angiotensin blockers (Fig. 1f,h), whereas the response to osmotic challenge was unaffected (Fig. 1c). Thus SFONos1 neurons sense the osmolarity, volume, and pressure of the blood via a combination of angiotensin-dependent and -independent mechanisms (Fig. 1i and Extended Data Fig. 3).
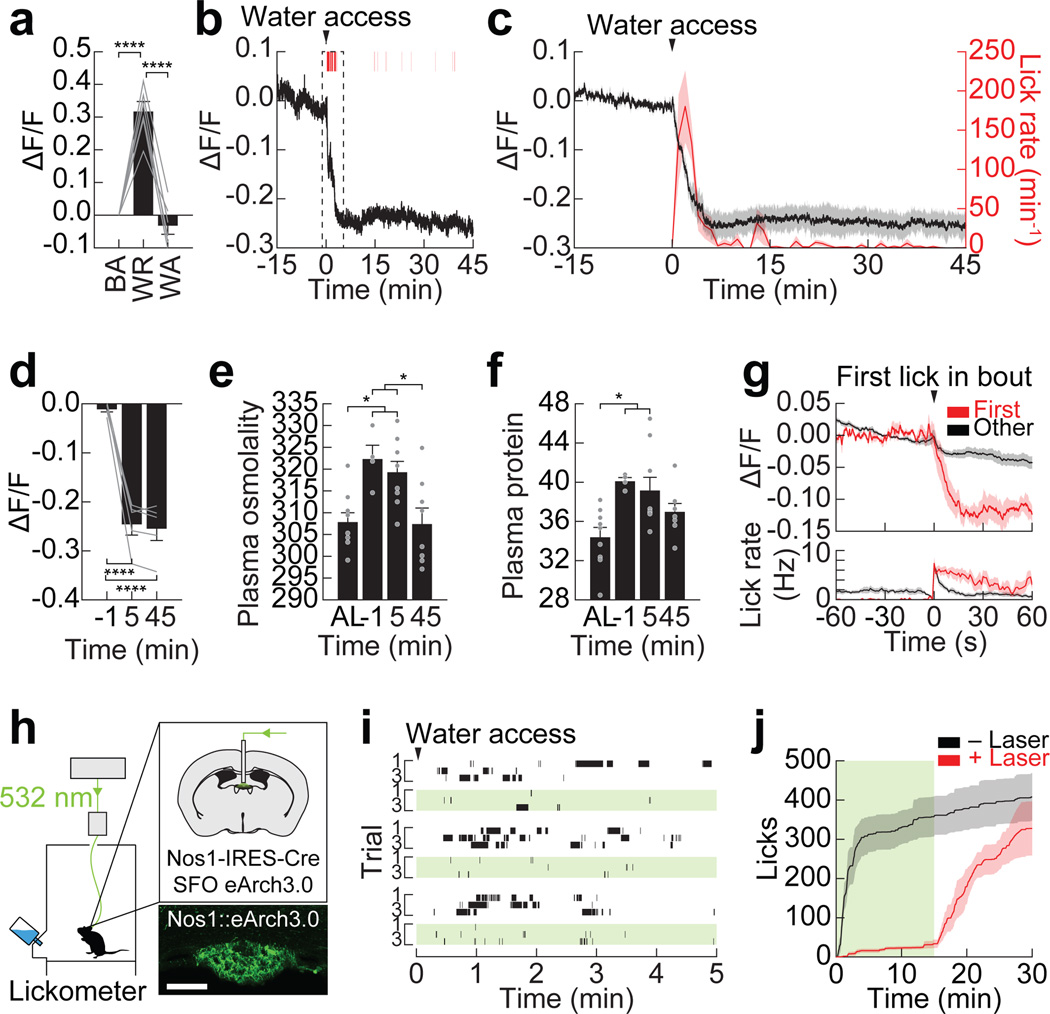
Consistent with this homeostatic regulation, overnight water restriction strongly activated SFONos1 neurons (Fig. 2a). When water was made available, mice drank avidly and, surprisingly, SFONos1 neurons were inhibited within 1 min (Fig. 2b–d). This inhibition was time-locked to the act of drinking, with activity beginning to decline the moment of the first lick (Fig. 2g) and stabilizing whenever drinking was paused. Drinking continued until the precise moment at which SFONos1 neuron activity returned to baseline, at which point drinking terminated. These responses were much too fast to be mediated by changes in the blood, which we confirmed directly by measuring plasma volume and osmolarity along a time-course of rehydration (Fig. 2e,f). Thus, contrary to current models, thirst is not quenched by the reverse of the process that generates it1–3. Instead, drinking resets thirst-promoting SFO neurons in a way that anticipates the future restoration of homeostasis. Importantly, this anticipatory feedback provides a mechanism to explain how animals can match ongoing water consumption to the level of physiologic need, a longstanding observation that has lacked a clear neural basis7–9.
Figure 2. SFONos1 neurons receive rapid anticipatory modulation and are necessary for drinking.
a, SFONos1 neurons are activated by water restriction (WR), and their activity returns to baseline (BA) after water access (WA; n = 6 mice). b, Representative recording showing rapid inhibition of SFONos1 neurons during drinking following water restriction (1 of 5 mice; red lines, licks; red boxes, bouts). c, Averaged traces showing SFONos1 neuron activity and lick rate (n = 5 mice). d, Quantification (n = 5 mice). e, Plasma osmolality (mOsm/kg) is elevated by water restriction and is unchanged by 5 min after re-access (n = 4–9 mice per group; AL, ad libitum). f, Plasma protein concentration (mg/mL) is elevated by water restriction and is unchanged by 5 min after re-access (n = 4–9 mice per group). g, PSTH around first lick in first bout or all other bouts (n = 5 mice). h, Schematic of optogenetic setup for silencing SFONos1 neurons (scale bar, 100 µm). i, Representative rasters of drinking following water restriction (3 of 5 mice; black lines, licks; green boxes, laser on). j, Averaged traces showing cumulative licks following water restriction (n = 5 mice; green box, laser on). Statistical analyses are described in Methods and in Extended Data Table 1.
To investigate whether this rapid inhibition of SFONos1 neurons is sufficient to explain thirst satiation, we used optogenetic silencing to replay this inhibition in thirsty animals. Of note, prior studies found that SFO ablation does not completely block drinking1, but interpretation of these lesion experiments is complicated by the fact that the SFO contains intermingled thirst-driving and -suppressing cell types19,20. We targeted the inhibitory opsin eArch3.0 to SFONos1 neurons (Fig. 2h) and confirmed that this can silence SFONos1 neurons in vitro (Extended Data Fig. 4). We then water restricted mice overnight and measured subsequent drinking behavior. Strikingly, silencing SFONos1 neurons abolished drinking in dehydrated animals (Fig. 2i–j and Extended Data Fig. 4). This effect was rapidly reversible, as mice engaged in voracious drinking soon after silencing was terminated (latency 113 ± 17 sec). It was also specific to drinking, as silencing did not inhibit food intake after fasting (Extended Data Fig. 7). Thus SFONos1 neurons are necessary for water consumption, and, importantly, their rapid inhibition during drinking is sufficient to explain thirst satiation.
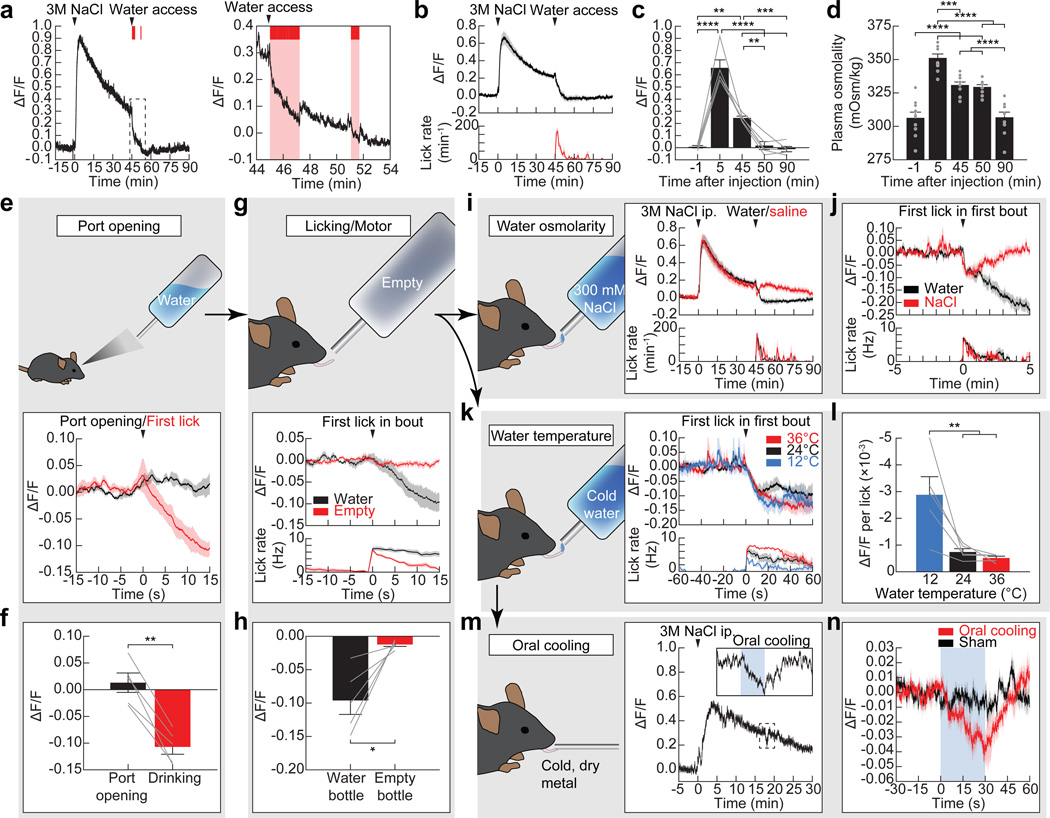
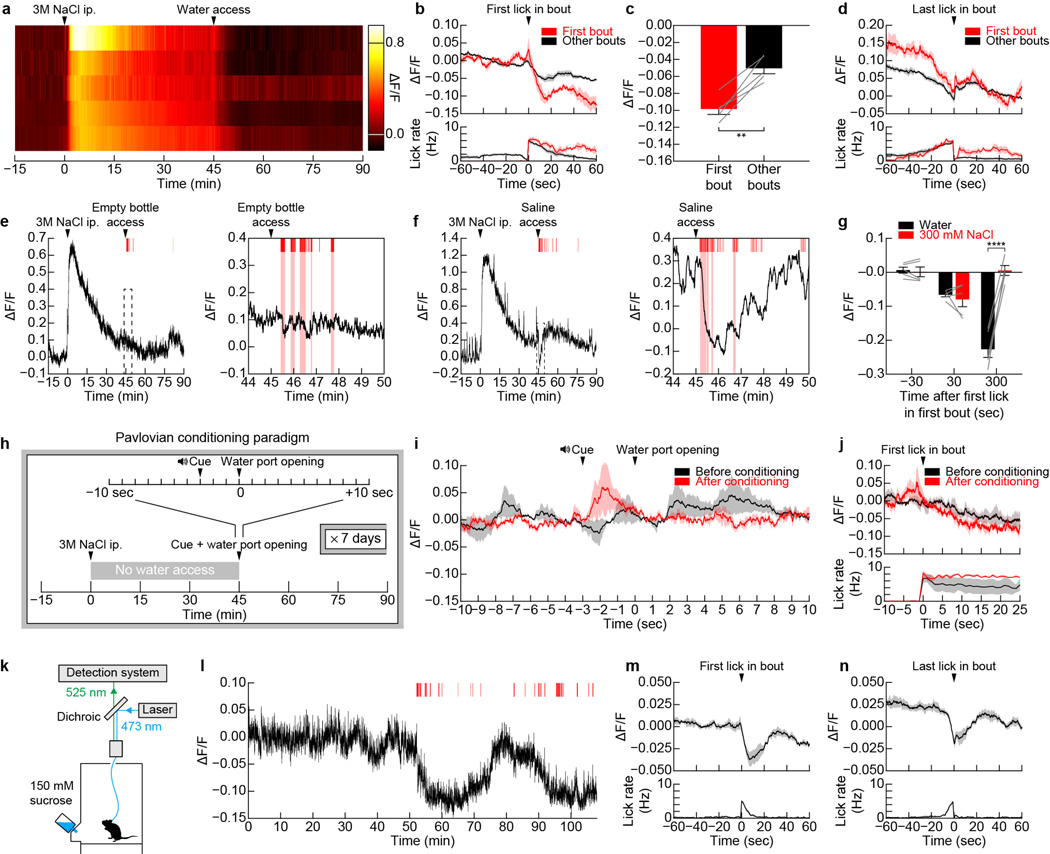
We sought to clarify the mechanism of rapid feedback to SFONos1 neurons during drinking. SFONos1 neuron activity was unaffected by allowing mice to see but not consume water (Fig. 3e,f) or by presenting sensory cues that had been paired with water access via Pavlovian conditioning (Extended Data Fig. 5). Thus SFONos1 neurons are not inhibited by the expectation of water availability alone, in contrast to ARCAgRP neurons that control hunger22,27,28. Similarly, the act of licking per se was insufficient, since SFONos1 neuron activity was not reduced in mice that performed several hundred “air licks” following presentation of an empty water bottle (Fig. 3g,h). This indicates that a signal tightly linked to the act of water ingestion itself, such as the sensation of liquid in the oral cavity, inhibits SFONos1 neurons.
Figure 3. Mechanisms of anticipatory regulation of SFONos1 neurons during drinking.
a, Representative recording showing rapid inhibition of SFONos1 neurons during drinking following salt challenge (1 of 8 mice; red lines, licks; red boxes, bouts). b, Averaged traces showing SFONos1 neuron activity and lick rate. c, Quantification. d, Plasma osmolality is elevated by salt challenge and is unchanged by 5 min after water re-access (n = 10 mice per group). e, SFONos1 neurons do not respond to the sight of water. f, Quantification. g, SFONos1 neurons do not respond to motor movements associated with licking. h, Quantification. i, SFONos1 neurons receive a post-ingestive error signal that reports the osmolarity of ingested fluids. j, PSTH around first lick in first bout. k, SFONos1 neurons were similarly inhibited regardless of water temperature. l, Drop in activity per lick was highly temperature-dependent. m, Representative recording showing rapid inhibition of SFONos1 neurons during oral cooling (1 of 5 mice; blue box, oral cooling). n, PSTH around placement of dry metal into oral cavity. Statistical analyses are described in Methods and in Extended Data Table 1. n = 5 mice for all photometry experiments.
To investigate this further, we tested whether drinking would inhibit SFONos1 neurons if the ingested liquid could not restore homeostasis. Mice were salt challenged and then provided access to water or hypertonic saline. Water consumption rapidly inhibited SFONos1 neurons (Fig. 3a–c and Extended Data Fig. 5), and this inhibition preceded any change in plasma osmolarity (Fig. 3d). Strikingly, consumption of hypertonic saline also rapidly inhibited SFONos1 neurons, with kinetics initially indistinguishable from water consumption (Fig. 3i,j). However, this initial decline was reversed after approximately one minute. This indicates that the rapid anticipatory response to drinking has at least two components: an immediate signal that tracks fluid ingestion and a delayed signal that reports on fluid tonicity, possibly generated by an esophageal or gastric osmosensor.
To further probe the oropharyngeal signals that regulate SFONos1 neurons, we investigated the role of water temperature. Humans experience cold drinks as more thirst-quenching14, and a similar preference is observed in rodents12,13. To test whether SFONos1 neurons contribute to this effect, we presented thirsty mice with access to water of different temperatures. We found that, regardless of temperature, mice consumed enough water to reduce the activity of their SFONos1 neurons to baseline (Fig. 3k). However, the reduction in SFONos1 neuron activity per lick was strongly temperature-dependent, with cold water inducing the largest decrease per lick and warm water the smallest (Fig. 3l). This suggests that the temperature dependence of thirst-quenching may be encoded in SFONos1 neuron activity. To test this directly, we measured the isolated effect of oral cooling on these neurons. We found that applying cold, but not room temperature, metal to the oral cavity of awake, thirsty mice was sufficient to rapidly inhibit SFONos1 neurons (Fig. 3m,n). Thus, temperature-dependent modulation of SFONos1 neurons may explain the enigmatic connection between oral cooling and thirst, including why thirsty rodents will avidly lick cold metal29 and humans report that sucking on ice chips rapidly relieves thirst14.
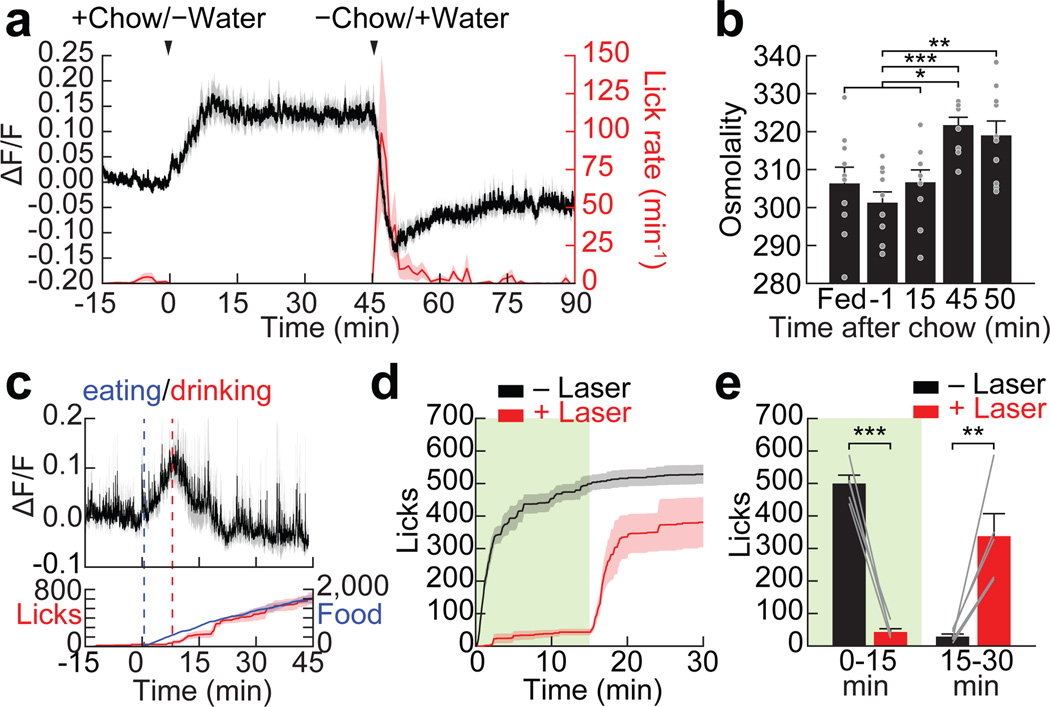
Eating is a potent stimulus for thirst, and many animals drink primarily during meals. However, the neural basis for prandial thirst is unknown, partly because feeding stimulates drinking before any change in the blood occurs10,11. To investigate the role of SFONos1 neurons, we fasted mice overnight and then provided access to food but not water. Remarkably, food consumption rapidly activated SFONos1 neurons, beginning at the onset of feeding and plateauing within 15 minutes (Fig. 4a). When water was presented, mice drank avidly and SFONos1 neurons were quickly inhibited. A similar activity pattern was observed when hungry mice were given simultaneous access to food and water (Fig. 4c). Activation of SFONos1 neurons during eating was not caused by changes in blood composition, because activation was complete before plasma osmolarity increased (Fig. 4b) and was unaffected by angiotensin blockers (Extended Data Fig. 6). Importantly, silencing SFONos1 neurons during these same protocols greatly reduced meal-associated water consumption (Fig. 4d,e) but not food intake (Extended Data Fig. 7), indicating that SFONos1 neurons are specifically necessary for prandial drinking. Thus modulation of SFONos1 neurons during feeding provides a mechanism to explain the coordination of eating and drinking, a widespread phenomenon that has lacked a clear neural substrate.
Figure 4. SFONos1 neurons are activated by eating and are required for prandial thirst.
a, SFONos1 neurons are rapidly activated by eating and inhibited by prandial drinking following overnight fasting (n = 6 mice). b, Plasma osmolality is elevated by eating by 45 min (but not 15 min) after chow access and is unchanged by 5 min after water re-access (n = 10 mice per group). c, SFONos1 neurons are rapidly modulated in fasted mice provided simultaneous access to chow and water (n = 5 mice). Food refers to time (s) spent interacting with food. d, Silencing SFONos1 neurons abolishes prandial thirst in fasted mice re-fed chow before water access (n = 5 mice; green box, laser on). e, Quantification (n = 5 mice). Statistical analyses are described in Methods and in Extended Data Table 1.
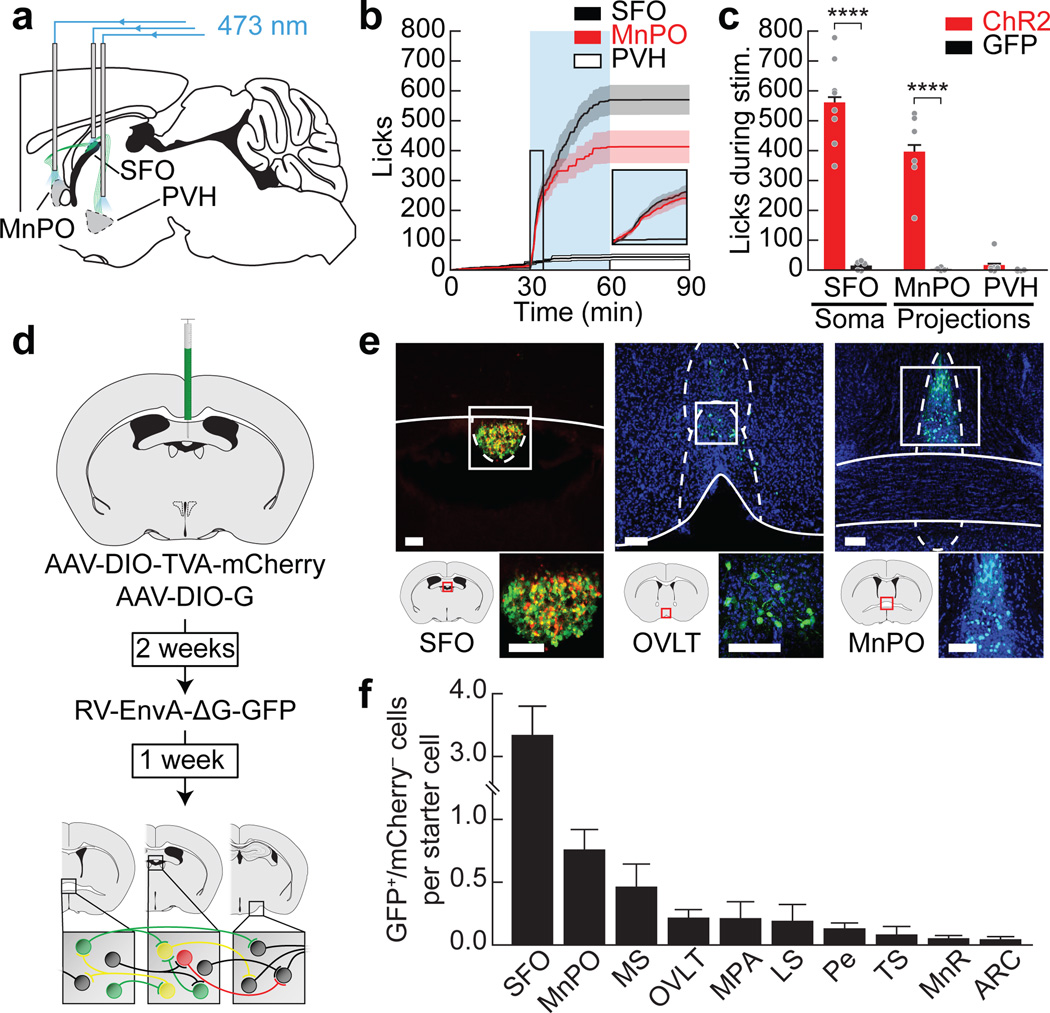
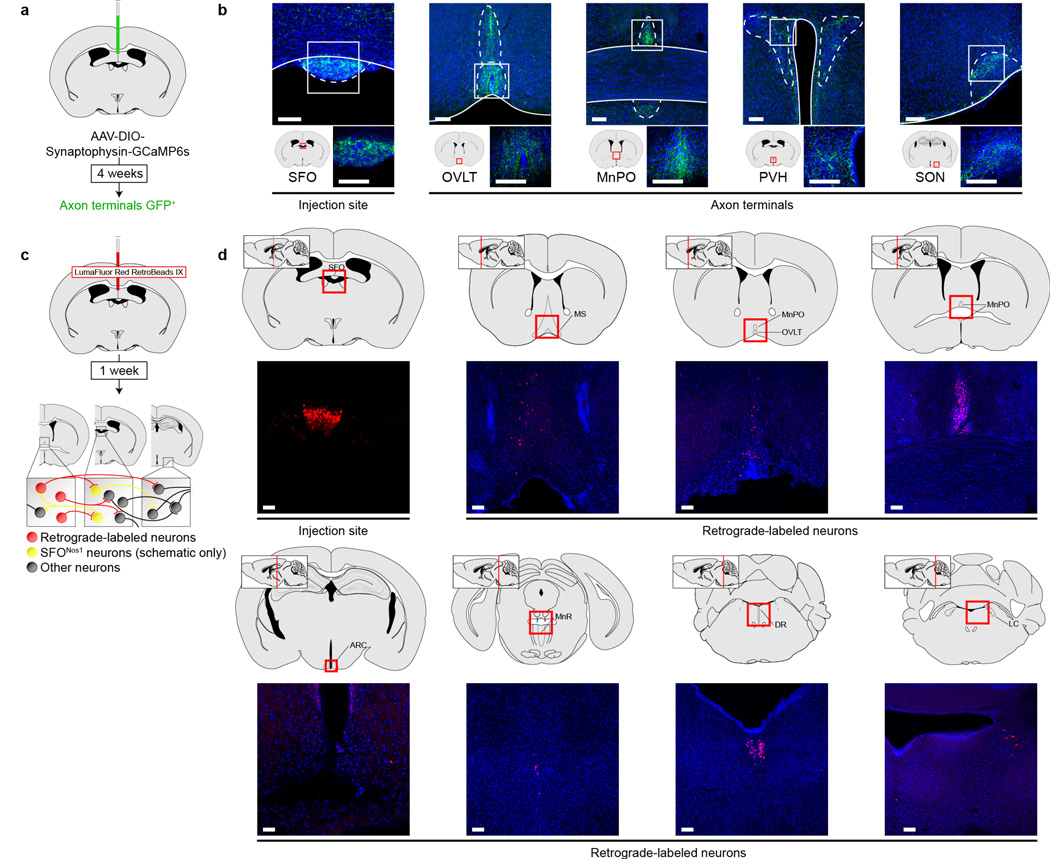
To better understand the circuit mechanisms underlying the regulation of drinking by SFONos1 neurons, we investigated the inputs and outputs of these cells. Projection mapping revealed that SFONos1 neurons densely innervate several hypothalamic nuclei associated with fluid balance30 (Extended Data Fig. 8). Optogenetic stimulation of projections to the median preoptic nucleus (MnPO), but not the paraventricular hypothalamus (PVH), was sufficient to drive voracious drinking (Fig. 5a–c). Intriguingly, examination of the monosynaptic inputs to SFONos1 neurons by retrograde rabies tracing revealed a partially overlapping set of structures (Fig. 5d–f and Extended Data Fig. 8). Elucidation of the cell-type-specific connectivity between these structures will be an important area for future investigation.
Figure 5. Structure of the SFONos1 neuron-associated thirst circuit.
a, Schematic of optogenetic setup for activating SFONos1 neuron somas or axon terminals in the MnPO or PVH. b, Averaged traces showing cumulative licks during photostimulation (n = 6–8 mice per group). c, Quantification (n = 4–8 mice per group). d, Schematic of viral strategy for identifying monosynaptic inputs to SFONos1 neurons. e, Representative images showing SFO injection site (red, mCherry; green, GFP) and monosynaptically connected neurons (green, GFP; blue, DAPI) in the organum vasculosum of the lamina terminalis (OVLT) and MnPO (1 of 6 mice; scale bars, 100 µm). f, Quantification (MS, medial septum; MPA, medial preoptic area; LS, lateral septum; Pe, periventricular hypothalamus; TS, triangular septum; MnR, median raphe; ARC, arcuate nucleus; n = 6 mice). Statistical analyses are described in Methods and in Extended Data Table 1.
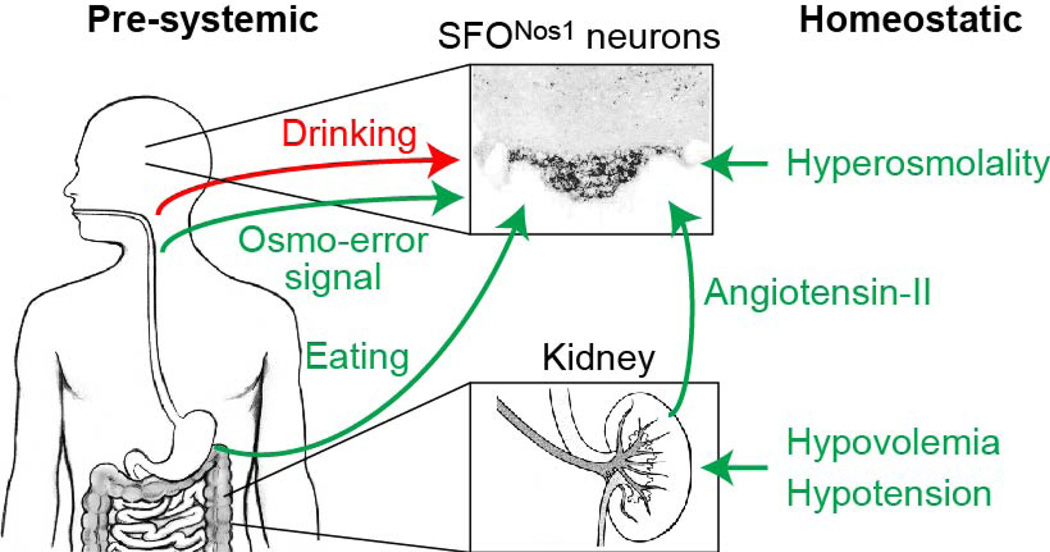
Ingestive behavior is regulated by a combination of anticipatory and homeostatic cues4–6. Interoceptive neurons within the CVOs have been recognized for decades as critical sites for the homeostatic regulation of drinking1–3,21,24,26. By contrast, the neural substrates for the anticipatory regulation of drinking have remained obscure, despite abundant evidence that such mechanisms are critical for the control of behavior4–11. Here we have demonstrated that the anticipatory signals for thirst unexpectedly converge on the same homeostatic neurons that monitor the composition of the blood (Extended Data Fig. 9). This convergence provides a straightforward mechanism for the brain to compare the needs of the body with the anticipated effects of ongoing food and water consumption and then adjust behavior preemptively. This in turn explains longstanding behavioral observations, including the speed of thirst satiation (Fig. 2), the fact that oral cooling is thirst-quenching (Fig. 3), and the widespread coordination of eating and drinking (Fig. 4). These findings reveal that the CVOs, long viewed as merely passive sensors of the blood, receive a second class of anticipatory signals that enable their dynamic regulation of behaviour.
Methods
Experimental protocols were approved by the University of California, San Francisco IACUC following the NIH guidelines for the Care and Use of Laboratory Animals.
Reagents
Nos1-IRES-Cre mice (Nos1tm1(cre)Mgmj, strain 017526), Agrp-IRES-Cre mice (Agrptm1(cre)LowJ, strain 012899), and wild type mice (C57BL/6J, strain 000664) were obtained from the Jackson Laboratory. Agtr1α-GFP mice (Tg(Agtr1a-EGFP)NZ44Gsat, strain 033059) were obtained from MMRRC. Adult mice (>4 weeks old) of both genders were used for experiments.
Recombinant AAVs expressing ChETATC (AAV5.EF1α.DIO.hChR2(E123T/T159C).P2A.mCherry; AAV5.CaMK2α.hChR2(E123T/T159C).P2A.mCherry), ChR2/H134R (AAV5.CaMK2α.hChR2(H134R).YFP), eArch3.0 (AAV5.EF1α.DIO.eArch3.0.YFP), mCherry (AAV5.EF1α.DIO.mCherry), and GFP (AAV5.CaMK2α.GFP) were obtained from the UNC Vector Core. Recombinant AAVs expressing GCaMP6s (AAV1.hSyn.FLEX.GCaMP6s; AAV5.hSyn.FLEX.GCaMP6s) and eArch3.0 (AAV5.CBA.FLEX.eArch3.0.GFP) were obtained from the Penn Vector Core. Recombinant EnvA-pseudotyped G-deficient Rabies virus expressing GFP (RV.EnvA.ΔG.GFP) was obtained from the Salk Institute.
Plasmids encoding Synaptophysin-GCaMP6s and GFP-RPL10a fusion proteins were generated in-house. Recombinant AAVs containing these plasmids (AAV5.EF1α.DIO.Synaptophysin.GCaMP6s; AAV2.EF1α.FLEX.GFP.RPL10a) were commercially produced by the UNC Vector Core. Rabies helper viruses (AAV1.CAG.DIO.TVA.mCherry; AAV1.CAG.DIO.G) were obtained from the lab of N. Shah.
Stereotaxic surgery
For SFO injections, 100–200 nL of virus was injected at one site (−0.50 mm anteroposterior (AP); 0 mm mediolateral (ML); −2.75 mm dorsoventral (DV) relative to bregma). For ARC injections, 1 µL of virus total was injected at two sites (−1.85 mm AP; −0.3 mm ML; −5.7 and −5.8 mm DV). Mice were allowed 2–4 weeks for viral expression and recovery from surgery before behavioral testing.
For soma photostimulation experiments, recombinant AAVs expressing ChETATC, mCherry, or GFP were stereotaxically injected into the SFO of Nos1-IRES-Cre mice and wild type mice. In the same surgery, a fiberoptic cannula was implanted unilaterally above the SFO (−2.25 mm DV).
For terminal photostimulation experiments, recombinant AAVs expressing hChR2/H134R or GFP were injected into the SFO of wild type mice. In the same surgery, a fiberoptic cannula was implanted unilaterally above the MnPO (+0.45 mm AP; +0 mm ML; −3.7 mm DV) or PVH (−0.75 mm AP; +0.2 mm ML; −3.9 mm DV).
For photoinhibition experiments, recombinant AAVs expressing eArch3.0 or mCherry were injected into the SFO of Nos1-IRES-Cre mice. In the same surgery, a fiberoptic cannula was implanted unilaterally above the SFO (−2.25 mm DV).
For photometry experiments, recombinant AAVs expressing GCaMP6s or GFP were injected into the SFO of Nos1-IRES-Cre mice and into the ARC of Agrp-IRES-Cre. In the same surgery, a fiberoptic cannula was implanted unilaterally above the SFO (−2.95 mm DV) or ARC (−5.7 mm DV).
For projection-mapping experiments, recombinant AAVs expressing synaptophysin-GCaMP6s were injected into the SFO of Nos1-IRES-Cre mice. After four weeks, mice were sacrificed and processed for histology.
For rabies tracing experiments, recombinant AAVs expressing TVA and G were injected into the SFO of Nos1-IRES-Cre mice. After two weeks, recombinant EnvA-pseudotyped G-deficient rabies virus expressing GFP was injected into the SFO. After one additional week, mice were sacrificed and processed for histology.
For retrobeads tracing experiments, red RetroBeads IX (LumaFluor) were injected into the SFO of wild type mice. After one week, mice were sacrificed and processed for histology.
Slice electrophysiology and calcium imaging
Acute forebrain slices were prepared from 8- to 15-week-old Nos1-IRES-Cre mice expressing ChETATC, eArch3.0, or GCaMP6s for 2–4 weeks. Fluorescent cells in the SFO were identified for whole-cell patch clamp recordings. Slices were sectioned in ice-cold oxygenated (95% O2 / 5% CO2) cutting saline containing (in mM) 26 NaHCO3, 1.25 NaH2PO4, 3 KCl, 10 glucose, 210 sucrose, 2 CaCl2, 2 MgCl2. Slices were then transferred to oxygenated artificial cerebrospinal fluid (ACSF) containing (in mM) 125 NaCl, 25 NaHCO3, 1.25 NaH2PO4, 2.5 KCl, 15 glucose, 2 CaCl2, 1 MgCl2 and incubated at 34°C for 30 min. Slices were then stored at room temperature until used. During experiments, slices were placed in a recording chamber and superfused with oxygenated ACSF. Glass pipettes for recording (3–8 MΩ) were pulled from borosilicate glass capillary (O.D. 1.5 mm, I.D. 0.86 mm, Sutter Instrument) and filled with internal solution containing (in mM) 125 K gluconate, 10 KCl, 4 NaCl, 4 Mg3ATP2, 0.3 Na3ATP, 5 Na2-phosphocreatine, 10 HEPES. Whole-cell recordings were made at 28°C using an Axopatch 700B amplifier (Molecular Devices). Data acquisition (filtered at 5 kHz and digitized at 10 kHz) and pulse generation were performed using a Digidata 1550 (Molecular Devices) and pClamp software (version 10.5, http://www.moleculardevices.com).
For channelrhodopsin validation, cells were photostimulated under current clamp mode using an LED light source (Lambda HPX, Sutter Instruments) pulsing light at 5–40 Hz through a 470 nm excitation filter set (U-N41 017, E.X. 470 nm, B.S. 495 nm, E.M. 5, Olympus).
For archaerhodopsin validation, cells were activated using currents ranging from 0 pA to 45 pA (ΔI = 5 pA) for 3 sec in duration injected under current clamp mode. During current injection, cells were photosilenced using an LED light source (Lambda HPX, Sutter Instruments) sending constant light through a 500 nm excitation filter set (49003, E.X. 500 nm, B.S. 515 nm, E.M. 5, Chroma Technology).
For calcium imaging validation, cells were activated using currents (30 pA) ranging from 100 msec to 1 sec (Δt = 100 msec) in duration injected under current clamp mode. Calcium imaging was performed simultaneously using a digital CCD camera (Hamamatsu, ORCA-ER) mounted on an upright microscope (Olympus, BX51). Micro-manager software (version 1.4, https://www.micro-manager.org) was used as microscope control interface. After loading, cells were imaged (10 msec exposure time; 10 Hz) using an LED light source (Lambda HPX, Sutter Instruments) sending constant light through a 470 nm excitation filter set (U-N41 017, E.X. 470 nm, B.S. 495 nm, E.M. 5, Olympus). We have previously validated the use of GCaMP6s to image calcium signals in ARCAgRP neurons27.
To visualize the responsiveness of SFONos1 neurons to angiotensin II (AngII), 1 µM AngII was bath-applied using a slow perfusion system (2 mL/min) during imaging. Data analysis followed the basic logic described previously2. Regions of interest (ROIs) were selected using the polygon selection tool in ImageJ with cell nucleus included. The plot z-axis profile function in ImageJ was then used to measure the mean value of each ROI versus frame number. Neuropil fluorescence was selected and estimated using the same protocol. Only regions located near the cell with no detectable fluorescent neural processes were used. The true fluorescence signal of each cell was estimated with function27: Fcell_true(t) = Fcell_measured(t) − r × Fneuropil(t), where r = 0.7.
Photostimulation in vivo
All experiments were performed in behavioral chambers (Coulbourn Instruments, Habitest Modular System) and video recorded using cameras installed above each cage. Experiments were performed during the light cycle to control for circadian factors and performed in a well-lit environment illuminated with white light. Water consumption was monitored with an optical lickometer (Colbourn Instruments). Mice were acclimated to the behavioral chamber for at least 15 min prior to the beginning of each testing session.
To test whether acute photostimulation could induce drinking, mice were provided constant access to water and monitored for 30 min (pre-stim), then photostimulated for 30 min (stim, 10 ms pulses at 20 Hz for 1 sec every 4 sec, 20–25 mW) using a DPSS 473 nm laser (Shanghai Laser and Optics Century), then monitored for another 30 min (post-stim).
For saline drinking experiments, the same paradigm was used except that mice were provided access to 150 mM NaCl in water.
For delayed-access experiments, the same paradigm was used except that stimulation lasted 60 min instead of 30 min. Water access was removed after 30 min pre-stim period and water re-access was provided 30 min later.
For water restriction experiments, mice were water-restricted for 24 h in their home cages, acclimated to the behavioral chamber for 15 min, then provided access to water for 30 min. To compare photostimulation to water restriction, all sessions were aligned to the first lick in the stim or water access period.
For food consumption experiments, mice were fed ad libitum in their home cages, acclimated to the behavioral chamber for 15 min, then provided a single pellet of chow without simultaneous access to water for 30 min. After 30 min, chow was removed and the amount consumed measured.
Photoinhibition in vivo
All experiments were performed in behavioral chambers (Coulbourn Instruments, Habitest Modular System) and video recorded using cameras installed above each cage. Experiments were performed during the light cycle to control for circadian factors and performed in a well-lit environment illuminated with white light. Water consumption was monitored with an optical lickometer (Colbourn Instruments). Mice were acclimated to the behavioral chamber for at least 15 min prior to the beginning of each testing session.
To test whether acute silencing could inhibit drinking, mice were water-restricted for 24 h in their home cages, acclimated to the behavioral chamber for 15 min, then provided access to water for 15 min with or without optical silencing (10–15 mW) using a DPSS 532 nm laser (Shanghai Laser and Optics Century), then monitored for another 15 min without optical silencing. Trials with and without photoinhibition (“−laser” and “+laser”) were interleaved.
To test whether acute optical silencing could inhibit prandial drinking in fasted mice, mice were fasted for 24 h in their home cages, acclimated to the behavioral chamber for 15 min, then provided a single pellet of chow under one of two experimental conditions: (1) no water access and no laser for 45 min, chow removal, then water access ± laser for 30 min, (2) no water access ± laser for 2 h. In experimental condition 2, chow was removed and the amount consumed measured every 15 min.
Fiber photometry
Construction of the rig for performing fiber photometry has been previously described27. The signal was output to a lock-in amplifier (Stanford Research System, SR810) with time constant 30 msec to allow filtering of noise at higher frequency. Signal was then digitized with LabJack U6-Pro and recorded using software provided by LabJack (http://labjack.com/support/software) with 250 Hz sampling rate.
All experiments were performed in behavioral chambers (Coulbourn Instruments, Habitest Modular System) and video recorded using cameras installed above each cage. Experiments were performed during the light cycle to control for circadian factors and performed in a well-lit environment illuminated with white light. Mice were acclimated to the behavioral chamber for at least 15 min with access to 24°C water prior to the beginning of each testing session. Photometry data were subjected to minimal processing consisting of only within-trial fluorescence normalization.
For pharmacological experiments, mice were acclimated to the behavioral chamber for 15 min, then given an injection and monitored for 45 min. Angiotensin-II (20 µg/mouse, 200 µg/mouse), losartan (100 mg/kg), captopril (50 mg/kg), and PEG (40%) were administered subcutaneously, and NaCl (1 M, 2 M, 3 M), mannitol (2 M), and isoproterenol (100 mg/kg) were administered intraperitoneally. All subcutaneous injections were given in a total volume of 400 µL with PBS as vehicle, and all intraperitoneal injections were given in a total volume of 150 µL with PBS as vehicle. To block angiotensin signaling, losartan was administered 30 min prior to angiotensin-II, and losartan + captopril (described as “angiotensin blockers” and “INH”) were administered simultaneously to PEG/NaCl/isoproterenol/chow access. Losartan is a selective angiotensin type 1 receptor (AT1R) antagonist, and captopril is an angiotensin converting enzyme (ACE) inhibitor. Mice were not provided access to water unless otherwise noted.
For water restriction experiment in Fig. 2a, mice were placed in the behavioral chamber and calcium signals recorded for 10 min on day one (“baseline”). Mice were then returned to their home cages and water-restricted for 24 h. After 24 h of water restriction, mice were placed in the behavioral chamber and calcium signals again recorded for 10 min on day two (“restriction”). Mice were then returned to their home cages and immediately provided access to water. After 1 h of water re-access, mice were placed in the behavioral chamber and calcium signals again recorded for 10 min (“re-access”). Photometry settings, including laser power and time constant, were the same for every mouse and every recording session. The reported fluorescence was calculated as the median fluorescence of minutes 5–10 of each recording.
For other water restriction experiments, mice were water-restricted for 48 h in their home cages, acclimated to the behavioral chamber for 15 min, then provided access to water for 45 min. For all experiments, the opening of a guillotine port cued water access.
For salt-loading experiments, mice were acclimated to the behavioral chamber for 15 min, then given an intraperitoneal injection of 150 µL 3 M NaCl. After 45 min, mice were provided access for 45 min to a bottle that was either empty, contained 12°C, 24°C, or 36°C water, or contained 24°C 300 mM NaCl in water. Quantification of PSTHs in Fig. 3f,h refers to ΔF/F at 15 sec.
For oral cooling experiments, mice were given an intraperitoneal injection of 150 µL 3 M NaCl. After 10–15 min, a piece of dry metal (ice-cold, “oral cooling”; room temperature, “sham”) was placed in the oral cavity, held for 30 sec, then removed. This process was repeated after >60 sec wait with metal of the other temperature. The temperature order was counter-balanced across trials.
For sucrose drinking experiments, mice were provided access to food and water ad libitum before testing. Mice were acclimated to the behavioral chamber for 15 min, then provided ad libitum access to 150 mM sucrose for >2 h.
For fasting-refeeding experiments, mice were fasted for 24 h in their home cages, acclimated to the behavioral chamber for 15 min, then provided a single pellet of chow either with or without simultaneous access to water for 45 min. After 45 min, chow was removed and the amount consumed measured, and mice were immediately provided access to water for 45 min.
For Pavlovian conditioning experiments, mice were acclimated to the behavioral chamber for 15 min, then given an intraperitoneal injection of 150 µL 3 M NaCl. After 45 min, an auditory cue was played (2.9 kHz, 300 msec; Colbourn Instruments), and three seconds later mice the water port was opened and mice were provided access to water for 45 min.
Data analysis
All data were analyzed with custom MATLAB code. Throughout the paper, a drinking bout is defined as any set of ten or more licks in which no inter-lick interval is greater than one second.
For photometry data, all responses were normalized to baseline using the function: ΔF/F = (F – F0)/F0, where F0 is the median fluorescence of the baseline period. The baseline period for full experiments was 15 min before time zero, and the baseline period for peristimulus time histograms around drinking bouts was 60 sec before the first lick or 60 sec after the last lick in a bout (15 sec for cue and empty bottle plots). Time zero was defined as the moment the mouse was returned to the behavioral chamber following injection, the moment of water access, or the moment of chow access. The time constant, τ, was estimated as before27. In bar graphs quantifying ΔF/F, the median fluorescence of a 1 sec window around the indicated time is reported, and 1 min before time zero is reported as baseline.
For rabies tracing experiments, mice were transcardially perfused with PBS followed by formalin. Brains were post-fixed overnight in formalin and placed in 20% sucrose for 24 h. Free-floating sections (40 µm) were prepared with a cryostat and half of sections were immediately mounted and imaged by direct fluorescence with a Zeiss LSM 700 confocal microscope. Quantification was performed using the cell counter tool in ImageJ.
Plasma osmolality
For water restriction experiments, wild type mice were water-restricted for 24 h, then provided access to water at t = 0. For salt-loading experiments, wild type mice were given an intraperitoneal injection of 150 µL 3 M NaCl at t = 0, then provided access to water at t = 45 min. For fasting-refeeding experiments, wild type mice were fasted for 24 h, then provided a single pellet of chow without simultaneous access to water at t = 0. At t = 45 min, chow was removed, and mice were immediately provided access to water. At a single time-point per session (hydrated, 0 min, 5 min, 45 min for water restriction experiments; 0 min, 5 min, 45 min, 50 min, 90 min for salt-loading experiments; fed, 0 min, 15 min, 45 min, 50 min for fasting-refeeding experiments), 125 µL of blood was collected from the tail vein using EDTA-coated capillary tubes (RAM Scientific). Plasma was isolated by centrifugation, and osmolality was measured using a freezing point osmometer (Fiske Associates). Mice were allowed one week for recovery between sessions.
Plasma protein
Wild type mice were water-restricted for 24 h, then provided access to water at t = 0. At a single time-point per session (hydrated, 0 min, 5 min, 45 min), 125 µL of blood was collected from the tail vein using EDTA-coated capillary tubes (RAM Scientific). Plasma was isolated by centrifugation, and plasma protein concentration was measured using a BCA protein assay kit (Thermo Fisher Scientific). Mice were allowed one week for recovery between sessions. Plasma protein concentration is inversely proportional to plasma volume.
Immunohistochemistry
Mice were transcardially perfused with PBS followed by formalin. Brains were post-fixed overnight in formalin and placed in 20% sucrose for 24 h. Free-floating sections (40 µm) were prepared with a cryostat, blocked (3% BSA, 2% NGS, and 0.1% Triton-X in PBS for 2 h), then incubated with primary antibody (chicken anti-GFP, Abcam, ab13970, 1:1000; rat anti-RFP, ChromoTek, 5f8, 1:2000; rabbit anti-cFos, Santa Cruz Biotech, sc52, 1:1000) overnight at 4°C (two nights for cFos staining). Sections were then washed, incubated with secondary antibody (Alexa Fluor 488 goat anti-chicken, Life Technologies, a11039, 1:1000; Alexa Fluor 568 goat anti-rat, Life Technologies, a11077, 1:1000; Alexa Fluor 568 goat anti-rabbit, Life Technologies, a11011, 1:1000) for 2 h at room temperature, mounted, and imaged with a Zeiss LSM 700 confocal microscope. Sections stained for cFos underwent unmasking before blocking (1% H2O2 + 1% NaOH in PBS for 10 min; 0.3% glycine in PBS for 10 min; 0.03% SDS in PBS for 10 min).
Statistics
Values are reported as mean ± s.e.m. (error bars or shaded area). The shaded area in Extended Data Fig. 2d represents the 95% confidence interval for the line-of-best-fit. Statistical analyses and linear regressions were performed using Matlab or Prism. P-values for pair-wise comparisons were performed using a two-tailed Student’s t-test. P-values for comparisons across multiple groups were performed using ANOVA and corrected for multiple comparisons using the Holm-Šídák method. *P < 0.05, **P < 0.01, ***P < 0.001, ****P < 0.0001. Result sheets of statistical tests from Prism detailing (wherever applicable) estimates of variance within each group, comparison of variances across groups, etc. are available upon request. Animals for fiber photometry experiments were excluded if there was no response (<10%) to 3 M NaCl injection ip. (SFONos1 neurons) or to 60 µg ghrelin injection ip. (ARCAgRP neurons). Animals for optogenetics experiments were excluded based on histology (expression of ChETATC/hChR2(H134R)/eArch3.0 in SFO) and fiberoptic placement. We observed few and sparse virally infected cells outside the SFO. These criteria were pre-established. No statistical method was used to predetermine sample size. Randomization and blinding were not used.
Extended Data
Extended Data Figure 1. Optogenetic activation of SFONos1 neurons is sufficient to promote drinking, but negative feedback inhibits excessive drinking during optogenetically- and dehydration-induced drinking.
Panels a–l demonstrate that optogenetic activation of SFONos1 neurons rapidly and specifically promotes drinking. a, Expression of mCherry in SFONos1 neurons from AAV5-EF1α-DIO-ChETATC-2A-mCherry (scale bar, 100 µm). b, Representative recording showing rapid firing of SFONos1 neuron in response to photostimulation (20 Hz) in acute slice (1 of 3 cells; blue lines, stimulation). c, Schematic of optogenetic setup for activating SFONos1 neurons. d, Rasters of drinking in response to optogenetic stimulation for seven trials each for four SFONos1::ChETATC mice (black lines, licks; blue boxes, stimulation). e, Averaged traces showing lick rate (n = 6 SFONos1::mCherry mice and 8 SFONos1::ChETATC mice). f, Averaged traces showing cumulative licks (n = 6 SFONos1::mCherry mice and 8 SFONos1::ChETATC mice). g, Quantification of drinking during stimulation protocol (****P < 0.0001, two-way repeated-measures ANOVA, n = 6 SFONos1::mCherry mice and 8 SFONos1::ChETATC mice). h, Licks during stimulation period across seven consecutive trials (n.s., one-way repeated-measures ANOVA, n = 8 mice). i, Latency to first lick during stimulation period across seven consecutive trials (n.s., one-way repeated-measures ANOVA, n = 8 mice). j, Heatmaps showing location of SFONos1::ChETATC mice during stimulation protocol (n = 4 mice). k, Quantification of time spent at lickometer during stimulation protocol (**P < 0.01, one-way repeated-measures ANOVA, n = 4 mice). l, Activation of SFONos1 neurons did not induce feeding (n.s., two-way repeated-measures ANOVA, n = 6 SFONos1::mCherry mice and 4 SFONos1::ChETATC mice). Panels m–q demonstrate that osmotic dilution does not inhibit excessive drinking during optogenetically-induced drinking. m, SFONos1::ChETATC mice were stimulated, but with access to 150 mM NaCl instead of water. n, Lick rate (n = 8 mice). o, Cumulative licks (n = 8 mice). p, Comparison to stimulation with water access (n = 8 mice). q, Quantification (n.s., two-tailed Student’s t-test, n = 8 mice). Panels r–v demonstrate that channelrhodopsin failure does not explain the negative feedback that inhibits excessive drinking during optogenetically-induced drinking. r, SFONos1::ChETATC mice were stimulated, but with delayed access to water instead of immediate access. s, Lick rate (n = 4 mice). t, Cumulative licks (n = 4 mice). u, Comparison to stimulation with water access (n = 4 mice). v, Quantification (n.s., two-tailed Student’s t-test, n = 4 mice). Panels w–af demonstrate that a negative feedback mechanism also inhibits excessive drinking during dehydration-induced drinking. w, Comparison of optogenetically-induced and dehydration-induced drinking in SFONos1::ChETATC mice (n = 4 mice; P-value color bar represents result of independent two-tailed Student’s t-tests). x, Latency to first lick (n.s., two-tailed Student’s t-test, n = 4 mice). y, Cumulative licks (*P < 0.05, two-way repeated-measures ANOVA, n = 4 mice). z, Cumulative probability distribution for inter-lick interval, a measure of licking “speed” (n = 4 mice). aa, Median inter-lick interval (**P < 0.01, two-tailed Student’s t-test, n = 4 mice). ab, Time constant (τ) for cumulative licks (*P < 0.05, two-tailed Student’s t-test, n = 4 mice). ac, Number of drinking bouts (**P < 0.01, two-way repeated-measures ANOVA, n = 4 mice). ad, Number of licks per drinking bout (**P < 0.01, two-way repeated-measures ANOVA, n = 4 mice). ae, Bout duration (**P < 0.01, two-way repeated-measures ANOVA, n = 4 mice). af, Inter-bout interval (n.s., two-way repeated-measures ANOVA, n = 4 mice). Values are mean ± s.e.m. (error bars or shaded area).
Extended Data Figure 2. GCaMP6s faithfully reports SFONos1 neuron activity in acute slices.
a, Expression of GCaMP6s in SFONos1 neurons from AAV5-EF1α-FLEX-GCaMP6s (scale bar, 100 µm). b, Representative fluorescence images of a neuron given a 30 pA current injection for 700 msec in acute slice (1 of 9 cells). c, Representative traces showing calcium responses in response to 30 pA current injections of increasing duration to produce increasing numbers of action potentials (1 of 9 cells). d, Relationship between number of action potentials and ΔF/F for the representative neuron in panel c (shaded area denotes 95% confidence interval). e, R2 and P-value for linear relationship between number of action potentials and ΔF/F (n = 9 cells). Panels f–j demonstrate that SFONos1 neurons are homogeneously responsive to both angiotensin and salt challenge. f, Representative fluorescence images showing SFONos1 neuron activity before and during bath application of angiotensin (1 of 3 experiments; red circles, identified neurons). g, 24/27 (~90%) identified SFONos1 neurons were activated by bath application of angiotensin (red line, mean; grey lines, individual activated neurons). h, Quantification (****P < 0.0001, two-way repeated-measures ANOVA, n = 24 activated neurons). i, Experimental design to test if a single population of SFO neurons is responsive to both angiotensin and salt challenge. j, Co-localization of Agtr1α::GFP and salt challenge-induced cFos indicates that SFONos1 neurons are homogeneously responsive to both angiotensin and salt challenge (scale bars, 100 µm). k, Experimental design to test if a SFO neurons express the excitatory neuron marker CaMK2α. l, Co-localization of CaMK2α::mCherry and Nos1::GFP indicates that SFONos1 neurons are excitatory (scale bar, 100 µm). Values are mean ± s.e.m. (error bars or shaded area).
Extended Data Figure 3. Regulation of SFONos1 neurons by homeostatic signals.
a, Recordings from SFONos1::GCaMP6s mice as they explored a behavioral chamber without access to food or water revealed dynamic fluctuations in fluorescence around a stable baseline (1 of 8 mice); these fluctuations were absent from recordings from SFONos1::GFP mice (1 of 3 mice). b, Quantification of response to peripheral injection of NaCl (averaged traces in Fig. 1b; **P < 0.01, ****P < 0.0001, two-way repeated-measures ANOVA, n = 5 mice). c, Time constant (τ) of rising and falling phases of response to peripheral injection of NaCl (n.s., two-way repeated-measures ANOVA, n = 5 mice). d, Representative recordings for five mice showing response to peripheral injection of NaCl or vehicle. e, SFONos1 neurons are activated by peripheral injection of angiotensin in a dose-dependent manner (n = 3 mice). f, Quantification (*P < 0.05, **P < 0.01, ***P < 0.001, ****P < 0.0001, two-way repeated-measures ANOVA, n = 3 mice). g, The AT1R antagonist losartan abolished the response to peripheral injection of angiotensin (n = 3 mice). h, Quantification (**P < 0.01, two-way repeated-measures ANOVA, n = 3 mice). i, Schematic illustrating expected observations if activation of SFONos1 neurons in response to peripheral injection PEG/isoproterenol and NaCl is angiotensin-dependent. j, Angiotensin blockers abolished the response to peripheral injection of PEG (quantification in Fig. 1f; n = 5 mice). k, Angiotensin blockers abolished the response to peripheral injection of isoproterenol (quantification in Fig. 1h; n = 5 mice). l, Angiotensin blockers did not abolish the response to peripheral injection of NaCl (quantification in Fig. 1c; n = 5 mice). m, Schematic illustrating expected observations if activation of SFONos1 neurons in response to peripheral injection NaCl is sodium-sensory or osmo-sensory. n, SFONos1 neurons are similarly activated by peripheral injection of equimolar mannitol and NaCl (quantification in Fig. 1d; n = 5 mice). Values are mean ± s.e.m. (error bars or shaded area).
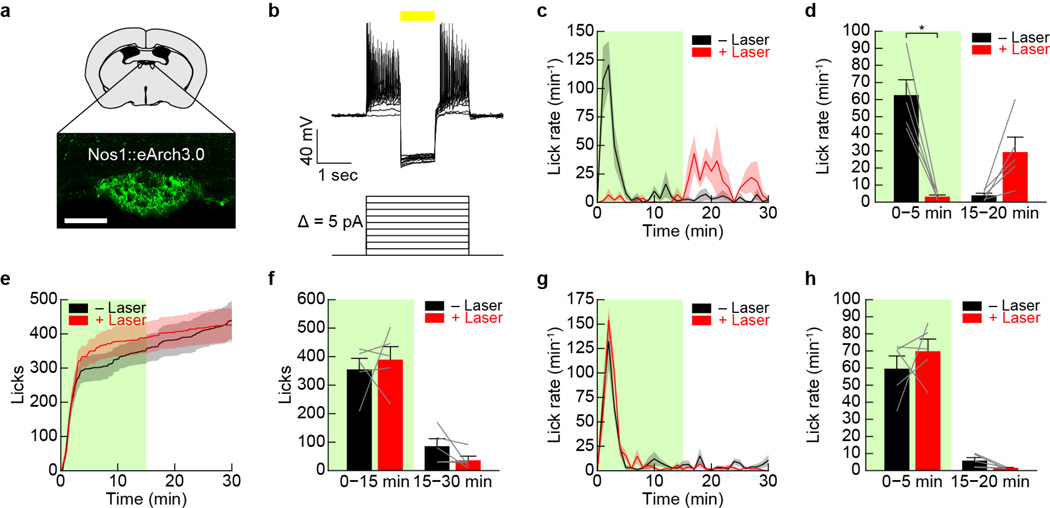
Extended Data Figure 4. SFONos1 neurons are necessary for drinking.
a, Expression of YFP in SFONos1 neurons from AAV5-EF1α-DIO-eArch3.0-YFP (scale bar, 100 µm). b, Representative recording showing firing of SFONos1 neurons is blocked in response to photosilencing in acute slice (1 of 3 cells; yellow line, laser). c, Averaged traces showing lick rate for experiment in Fig. 2j (n = 5 mice; green box, laser on). d, Quantification (*P < 0.05, two-way repeated-measures ANOVA, n = 5 mice). e, Averaged traces showing cumulative licks following water restriction for SFONos1::mCherry control mice (n = 5 mice; green box, laser on). f, Quantification (n.s., two-way repeated-measures ANOVA, n = 5 mice). g, Averaged traces showing lick rate following water restriction for SFONos1::mCherry control mice (n = 5 mice; green box, laser on). h, Quantification (n.s., two-way repeated-measures ANOVA, n = 5 mice). Values are mean ± s.e.m. (error bars or shaded area).
Extended Data Figure 5. Regulation of SFONos1 neurons by anticipatory signals.
a, Representative recordings for five mice showing activation of SFONos1 neurons during salt challenge and rapid inhibition of SFONos1 neurons during drinking. b, PSTH of SFONos1 neuron activity and lick rate around the first lick in either the first drinking bout or all other drinking bouts following salt challenge (n = 5 mice). c, The decrease in SFONos1 neuron activity was greatest during the first drinking bout (ΔF/F at 20 sec after first lick; **P < 0.01, two-tailed Student’s t-test, n = 5 mice). d, PSTH of SFONos1 neuron activity and lick rate around the last lick in either the first drinking bout or all other drinking bouts following salt challenge (n = 5 mice). e, Representative recording showing no inhibition of SFONos1 neurons during licking an empty bottle following salt challenge (1 of 5 mice; red lines, licks; red boxes, drinking bouts). f, Representative recording showing rapid inhibition followed by “re-setting” of SFONos1 neurons during drinking 300 mM NaCl following salt challenge (1 of 5 mice; red lines, licks; red boxes, drinking bouts). g, SFONos1 neurons receive a post-ingestive error signal that reports the osmolarity of ingested fluids (averaged traces in Fig. 3j; ****P < 0.0001, two-way repeated-measures ANOVA, n = 5 mice). Panels h–j demonstrate that SFONos1 neurons do not transmit a teaching signal in a Pavlovian conditioning paradigm. h, Schematic of Pavlovian conditioning paradigm. i, SFONos1 neurons were not inhibited by cue presentation after one week of Pavlovian conditioning (n = 3 mice). j, PSTH of SFONos1 neuron activity and lick rate around the first lick in the first drinking bout either before or after Pavlovian conditioning (n = 3 mice). Panels k–n demonstrate that SFONos1 neurons are modulated by rapid anticipatory signals during drinking in the absence of homeostatic need. k, The activity of SFONos1 neurons was recorded while fully hydrated mice were given ad libitum access to sucrose. l, Representative recording showing modulation of SFONos1 neurons during sucrose drinking (1 of 4 mice; red lines, licks). m, PSTH of SFONos1 neuron activity and lick rate around the first lick in all sucrose drinking bouts (n = 4 mice). n, PSTH of SFONos1 neuron activity and lick rate around the last lick in all sucrose drinking bouts (n = 4 mice). Values are mean ± s.e.m. (error bars or shaded area).
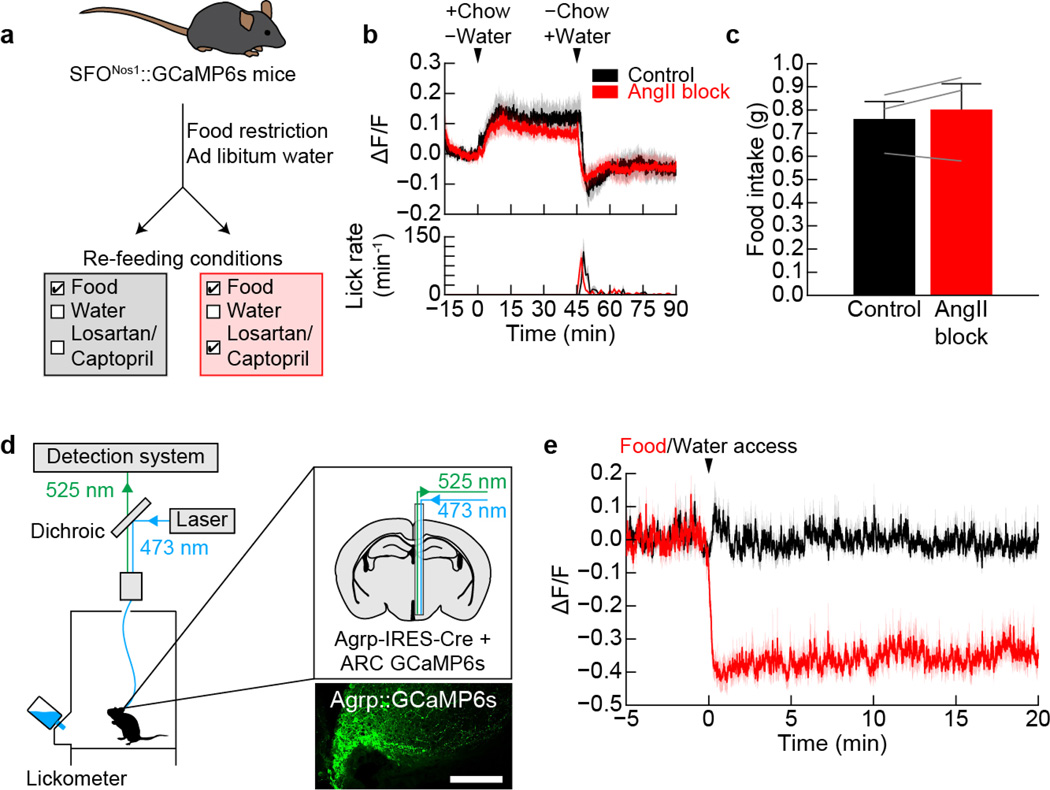
Extended Data Figure 6. Activation of SFONos1 neurons during eating does not require angiotensin signaling.
a, Experimental design to test if angiotensin signaling is necessary for prandial thirst. b, Angiotensin blockers (“INH”) did not inhibit eating-induced activation of SFONos1 neurons or prandial drinking (n = 3 mice). c, Angiotensin blockers did not effect food consumption (n.s., two-tailed Student’s t-test, n = 3 mice). Panels d–e demonstrate that ARCAgRP neurons that control hunger are not reciprocally modulated by eating and drinking. d, Schematic of fiber photometry setup for recording the activity of ARCAgRP neurons (scale bar, 100 µm). e, ARCAgRP neurons were rapidly inhibited when fasted mice were presented with chow, as previously reported27, but were unaffected when dehydrated mice were presented with water (n = 5 mice). Values are mean ± s.e.m. (error bars or shaded area).
Extended Data Figure 7. Silencing of SFONos1 neurons disinhibits feeding.
a, Experimental design to test if prandial thirst inhibits food intake. b, Mice provided simultaneous access to water consumed more food after overnight fasting than mice without simultaneous access to water (**P < 0.01, ****P < 0.0001, two-way ANOVA, n = 10 mice per group), consistent with previous reports that thirst can inhibit hunger in rats31. c, Experimental design to test if SFONos1 neurons mediate inhibition of food intake by prandial thirst. d, Silencing of SFONos1 neurons increased food intake when mice were provided access to chow without simultaneous access to water after overnight fasting (**P < 0.01, ****P < 0.0001, two-way repeated-measures ANOVA, n = 5 mice). Values are mean ± s.e.m. (error bars or shaded area).
Extended Data Figure 8. Projection mapping and retrograde tracing from SFO neurons.
a, Schematic of viral strategy for identifying projections from SFONos1 neurons using a fluorescent synaptophysin fusion protein. b, Representative images showing SFONos1 neuron somas in the SFO and axon terminals in the organum vasculosum of the lamina terminalis (OVLT), median preopotic nucleus (MnPO), paraventricular hypothalamus (PVH), and supraoptic nucleus (SON) (1 of 2 mice; green, GFP; blue, DAPI; scale bars, 100 µm). c, Schematic of strategy for retrograde tracing from SFO neurons using retrobeads. d, Representative images showing retrobeads injection site in the SFO and retrograde-labeled neurons in the medial septum (MS), OVLT, MnPO, arcuate nucleus (ARC), median raphe (MnR), dorsal raphe (DR), and locus coeruleus (LC) (1 of 2 mice; red, rhodamine; blue, DAPI; scale bars, 100 µm).
Extended Data Figure 9. Schematic for convergence of anticipatory and homeostatic signals at SFONos1 thirst neurons.
a, SFONos1 neurons monitor the composition of the blood by sensing plasma osmolarity and, via angiotensin, plasma volume and pressure. SFONos1 neurons predict the future state of the blood by integrating temperature-dependent inputs from the mouth and osmolarity-dependent inputs from the gut during drinking, and angiotensin- and osmolarity-independent inputs from the mouth/gut during eating.
Extended Data Table 1.
Summary of statistical analyses
| Figure | Sample size (n) | Statistical test | Values |
|---|---|---|---|
| 1c | 5 mice | two-way repeated-measures ANOVA factor one: time-point (baseline, 45 min) factor two: injection (vehicle, 3M NaCl, 3M NaCl + INH) post-hoc correction for multiple comparisons (Holm-Šídák) |
time-point: F(1,4) = 134.96,
P = 0.0003 injection: F(2,8) = 37.79, P < 0.0001 interaction: F(2,8) = 30.41, P = 0.0002 multiple comparisons: ****P < 0.0001 |
| 1d | 5 mice | two-way repeated-measures ANOVA factor one: time-point (baseline, 45 min) factor two: injection (vehicle, 1M NaCl, 2M mannitol) post-hoc correction for multiple comparisons (Holm-Šídák) |
time-point: F(1,4) = 21.29,
P = 0.0099 injection: F(2,8) = 4.74, P = 0.0438 interaction: F(2,8) = 13.21, P = 0.0029 multiple comparisons: ***P < 0.001 |
| 1f | 5 mice | two-way repeated-measures ANOVA factor one: time-point (baseline, 5 min) factor two: injection (vehicle, PEG, PEG + INH) post-hoc correction for multiple comparisons (Holm-Šídák) |
time-point: F(1,4) = 55.81,
P = 0.0017 injection: F(2,8) = 26.43, P = 0.0003 interaction: F(2,8) = 99.26, P < 0.0001 multiple comparisons: ****P < 0.0001 |
| 1h | 5 mice | two-way repeated-measures ANOVA factor one: time-point (baseline, 5 min) factor two: injection (vehicle, isoproterenol, isoproterenol + INH) post-hoc correction for multiple comparisons (Holm-Šídák) |
time-point: F(1,4) = 8.30,
P = 0.0450 injection: F(2,8) = 72.70, P < 0.0001 interaction: F(2,8) = 47.00, P < 0.0001 multiple comparisons: ****P < 0.0001 |
| 2a | 6 mice | one-way repeated-measures ANOVA factor one: time-point (baseline, water restriction, water re-access) post-hoc correction for multiple comparisons (Holm-Šídák) |
time-point: F(2,10) = 77.85,
P < 0.0001 multiple comparisons: ****P < 0.0001 |
| 2d | 5 mice | one-way repeated-measures ANOVA factor one: time-point (baseline, 5 min, 45 min) post-hoc correction for multiple comparisons (Holm-Šídák) |
time-point: F(2,8) = 131.40,
P < 0.0001 multiple comparisons: ****P < 0.0001 |
| 2e | ad lib.: 9 mice −1 min: 4 mice 5 min: 9 mice 45 min: 8 mice |
one-way ANOVA factor one: time-point (ad lib., −1 min, 5 min, 45 min) post-hoc correction for multiple comparisons (Holm-Šídák) |
time-point: F(3,26) = 6.20,
P = 0.0025 multiple comparisons: *P < 0.05 |
| 2f | ad lib.: 9 mice −1 min: 4 mice 5 min: 9 mice 45 min: 8 mice |
one-way ANOVA factor one: time-point (ad lib., −1 min, 5 min, 45 min) post-hoc correction for multiple comparisons (Holm-Šídák) |
time-point: F(3,26) = 4.93,
P = 0.0076 multiple comparisons: *P < 0.05 |
| 3c | 5 mice | one-way repeated-measures ANOVA factor one: time-point (baseline, 5 min, 45 min, 50 min, 90 min) post-hoc correction for multiple comparisons (Holm-Šídák) |
time-point: F(4,16) = 64.35,
P < 0.0001 multiple comparisons: **P < 0.01, ***P < 0.001, ****P < 0.0001 |
| 3d | 10 mice per group | one-way ANOVA factor one: time-point (−1 min, 5 min, 45 min, 50 min, 90 min) post-hoc correction for multiple comparisons (Holm-Šídák) |
time-point: F(4,45) = 35.80,
P < 0.0001 multiple comparisons: ***P < 0.001, ****P < 0.0001 |
| 3f | 5 mice | two-tailed paired Student’s t-test | t(4) = 7.08, P = 0.0021 |
| 3h | 5 mice | two-tailed paired Student’s t-test | t(4) = 3.61, P = 0.0225 |
| 3k | 5 mice | one-way repeated-measures ANOVA factor one: water temp. (12°C, 24°C, 36°C) post-hoc correction for multiple comparisons (Holm-Šídák) |
water temp.: F(2,8) = 11.71,
P = 0.0042 multiple comparisons: **P < 0.01 |
| 4b | 10 mice per group | one-way ANOVA factor one: time-point (fed, −1 min, 5 min, 45 min, 50 min) post-hoc correction for multiple comparisons (Holm-Šídák) |
time-point: F(4,45) = 7.05,
P = 0.0002 multiple comparisons: *P < 0.05, **P < 0.01, ***P < 0.001 |
| 4e | 5 mice | two-way repeated-measures ANOVA factor one: time-bin (0–15 min, 15–30 min) factor two: laser ("−laser" trials, "+laser" trials) post-hoc correction for multiple comparisons (Holm-Šídák) |
time-bin: F(1,4) = 5.21,
P = 0.0845 laser: F(1,4) = 2.67, P = 0.1777 interaction: F(1,4) = 196.00, P = 0.0002 multiple comparisons: **P < 0.01, ***P < 0.001 |
| 5c | SFOGFP: 5 mice SFOChR2: 8 mice MnPOGFP: 4 mice MnPOChR2: 6 mice PVHGFP: 4 mice PVHChR2: 7 mice |
two-way ANOVA factor one: brain region (SFO, MnPO, PVH) factor two: vector (GFP, ChR2) post-hoc correction for multiple comparisons (Holm-Šídák) |
brain region: F(2,28) = 27.02,
P < 0.0001 vector: F(1,28) = 97.24, P < 0.0001 interaction: F(2,28) = 24.11, P < 0.0001 multiple comparisons: ****P < 0.0001 |
Acknowledgments
C.A.Z. is supported by an NSF Graduate Research Fellowship (Grant No. 1144247) and a UCSF Discovery Fellowship. Z.A.K. is a New York Stem Cell Foundation-Robertson Investigator and acknowledges support from the New York Stem Cell Foundation, American Diabetes Association, Rita Allen, McKnight, Sloan, Brain and Behavior Research, Klingenstein, and Program for Breakthrough Biological Research Foundations. This work was supported by an NIH New Innovator Award (DP2-DK109533), R01-DK106399, and R01-NS094781, as well as the UCSF Diabetes and Obesity Centers (U01 DK089541).
Footnotes
Author Contributions
C.A.Z. and Z.A.K. conceived the project and designed the experiments. C.A.Z., Y.-C.L., D.E.L., L.G., E.L.H., G.D., and Y.C. performed stereotaxic surgery and histology. Y.-C.L. conducted acute slice experiments. C.A.Z. and Y.C. conducted photometry experiments. C.A.Z. conducted optogenetics experiments. C.A.Z. and D.E.L. conducted plasma composition experiments. Y.C. generated the synaptophysin-GCaMP6s construct. C.A.Z. analyzed the data. C.A.Z. and Z.A.K. prepared the manuscript with input from all authors.
The authors declare no competing financial interests.
References
- 1.Lind RW, Thunhorst RL, Johnson AK. The subfornical organ and the integration of multiple factors in thirst. Physiol Behav. 1984;32:69–74. doi: 10.1016/0031-9384(84)90072-6. [DOI] [PubMed] [Google Scholar]
- 2.McKinley MJ, Johnson AK. The physiological regulation of thirst and fluid intake. News Physiol Sci. 2004;19:1–6. doi: 10.1152/nips.01470.2003. [DOI] [PubMed] [Google Scholar]
- 3.Bourque CW. Central mechanisms of osmosensation and systemic osmoregulation. Nat Rev Neurosci. 2008;9:519–531. doi: 10.1038/nrn2400. [DOI] [PubMed] [Google Scholar]
- 4.Berridge KC. Motivation concepts in behavioral neuroscience. Physiol Behav. 2004;81:179–209. doi: 10.1016/j.physbeh.2004.02.004. doi:10.1016/j.physbeh.2004.02.004. [DOI] [PubMed] [Google Scholar]
- 5.Woods SC, Ramsay DS. Homeostasis: beyond Curt Richter. Appetite. 2007;49:388–398. doi: 10.1016/j.appet.2006.09.015. [DOI] [PMC free article] [PubMed] [Google Scholar]
- 6.Stricker EM, Hoffmann ML. Presystemic signals in the control of thirst, salt appetite, and vasopressin secretion. Physiol Behav. 2007;91:404–412. doi: 10.1016/j.physbeh.2007.04.007. [DOI] [PubMed] [Google Scholar]
- 7.Thrasher TN, Nistalherrera JF, Keil LC, Ramsay DJ. Satiety and Inhibition of Vasopressin Secretion after Drinking in Dehydrated Dogs. American Journal of Physiology. 1981;240:E394–E401. doi: 10.1152/ajpendo.1981.240.4.E394. [DOI] [PubMed] [Google Scholar]
- 8.Bellows RT. Time Factors in Drinking In Dogs. American Journal of Physiology. 1939;125:87–97. [Google Scholar]
- 9.Adolph EF, Barker JP, Hoy PA. Multiple Factors in Thirst. American Journal of Physiology. 1954;78:538–562. doi: 10.1152/ajplegacy.1954.178.3.538. [DOI] [PubMed] [Google Scholar]
- 10.Oatley K, Toates FM. Passage of Food through Gut of Rats and Its Uptake of Fluid. Psychonomic Science. 1969;16:225-&. [Google Scholar]
- 11.Fitzsimons TJ, Lemagnen J. Eating as a Regulatory Control of Drinking in Rat. Journal of Comparative and Physiological Psychology. 1969;67:273-&. doi: 10.1037/h0026772. [DOI] [PubMed] [Google Scholar]
- 12.Deaux E. Thirst satiation and the temperature of ingested water. Science. 1973;181:1166–1167. doi: 10.1126/science.181.4105.1166. [DOI] [PubMed] [Google Scholar]
- 13.Kapatos G, Gold RM. Tongue Cooling during Drinking: A Regulator of Water Intake in Rats. Science. 1972;176:685–686. doi: 10.1126/science.176.4035.685. [DOI] [PubMed] [Google Scholar]
- 14.Eccles R, Du-Plessis L, Dommels Y, Wilkinson JE. Cold pleasure. Why we like ice drinks, ice-lollies and ice cream. Appetite. 2013;71:357–360. doi: 10.1016/j.appet.2013.09.011. [DOI] [PubMed] [Google Scholar]
- 15.Kandel ER. Principles of neural science. 5th. McGraw-Hill; 2013. [Google Scholar]
- 16.Egan G, et al. Neural correlates of the emergence of consciousness of thirst. Proceedings of the National Academy of Sciences of the United States of America. 2003;100:15241–15246. doi: 10.1073/pnas.2136650100. [DOI] [PMC free article] [PubMed] [Google Scholar]
- 17.Farrell MJ, et al. Cortical activation and lamina terminalis functional connectivity during thirst and drinking in humans. Am J Physiol Regul Integr Comp Physiol. 2011;301:R623–R631. doi: 10.1152/ajpregu.00817.2010. [DOI] [PubMed] [Google Scholar]
- 18.McKinley MJ, Denton DA, Oldfield BJ, De Oliveira LB, Mathai ML. Water intake and the neural correlates of the consciousness of thirst. Semin Nephrol. 2006;26:249–257. doi: 10.1016/j.semnephrol.2006.02.001. [DOI] [PubMed] [Google Scholar]
- 19.Oka Y, Ye M, Zuker CS. Thirst driving and suppressing signals encoded by distinct neural populations in the brain. Nature. 2015;520:349–352. doi: 10.1038/nature14108. [DOI] [PMC free article] [PubMed] [Google Scholar]
- 20.Grob M, Trottier JF, Drolet G, Mouginot D. Characterization of the neurochemical content of neuronal populations of the lamina terminalis activated by acute hydromineral challenge. Neuroscience. 2003;122:247–257. doi: 10.1016/j.neuroscience.2003.07.005. [DOI] [PubMed] [Google Scholar]
- 21.Simpson JB, Routtenberg A. Subfornical organ: site of drinking elicitation by angiotensin II. Science. 1973;181:1172–1175. doi: 10.1126/science.181.4105.1172. [DOI] [PubMed] [Google Scholar]
- 22.Betley JN, et al. Neurons for hunger and thirst transmit a negative-valence teaching signal. Nature. 2015;521:180–185. doi: 10.1038/nature14416. [DOI] [PMC free article] [PubMed] [Google Scholar]
- 23.Gunaydin LA, et al. Natural neural projection dynamics underlying social behavior. Cell. 2014;157:1535–1551. doi: 10.1016/j.cell.2014.05.017. [DOI] [PMC free article] [PubMed] [Google Scholar]
- 24.Rowland NE. Brain mechanisms of mammalian fluid homeostasis: insights from use of immediate early gene mapping. Neurosci Biobehav Rev. 1998;23:49–63. doi: 10.1016/s0149-7634(97)00068-7. [DOI] [PubMed] [Google Scholar]
- 25.Szczepanska-Sadowska E, Kozlowski S. Equipotency of hypertonic solutions of mannitol and sodium chloride in eliciting thirst in the dog. Pflugers Arch. 1975;358:259–264. doi: 10.1007/BF00587222. [DOI] [PubMed] [Google Scholar]
- 26.Fitzsimons JT. Drinking by rats depleted of body fluid without increase in osmotic pressure. J Physiol. 1961;159:297–309. doi: 10.1113/jphysiol.1961.sp006809. [DOI] [PMC free article] [PubMed] [Google Scholar]
- 27.Chen Y, Lin YC, Kuo TW, Knight ZA. Sensory detection of food rapidly modulates arcuate feeding circuits. Cell. 2015;160:829–841. doi: 10.1016/j.cell.2015.01.033. [DOI] [PMC free article] [PubMed] [Google Scholar]
- 28.Mandelblat-Cerf Y, et al. Arcuate hypothalamic AgRP and putative POMC neurons show opposite changes in spiking across multiple timescales. Elife. 2015;4 doi: 10.7554/eLife.07122. [DOI] [PMC free article] [PubMed] [Google Scholar]
- 29.Mendelson J, Chillag D. Tongue cooling: a new reward for thirsty rodents. Science. 1970;170:1418–1421. doi: 10.1126/science.170.3965.1418. [DOI] [PubMed] [Google Scholar]
- 30.Miselis RR, Shapiro RE, Hand PJ. Subfornical organ efferents to neural systems for control of body water. Science. 1979;205:1022–1025. doi: 10.1126/science.472723. [DOI] [PubMed] [Google Scholar]
Extended Data References
- 31.Hsiao S, Trankina F. Thirst-hunger interaction. I. Effects of body-fluid restoration on food and water intake in water-deprived rats. J. Comp. Physiol. Psychol. 1969;69:448–453. doi: 10.1037/h0028192. [DOI] [PubMed] [Google Scholar]


