Abstract
This is the fifth article of a series on fundamental concepts in biostatistics and research. In this article, the author reviews the fundamental concepts in diagnostic testing, prior probability and predictive value, and how they relate to the concept of high-value care. The topics are discussed in common language with a minimum of jargon and mathematics. Emphasis is given to conceptual understanding. A companion article preceding this one focused on sensitivity and specificity.
Keywords: sensitivity, specificity, positive predictive value, negative predictive value, pretest probability, testing, diagnostic testing, harms, high-value care
The term high-value care encompasses the minimization of unnecessary costs and testing, and the maximization of quality. High-value care requires the healthcare provider to perform tests judiciously. A general concept in high-value care is that a diagnostic test discriminates most efficiently between disease and non-disease when the likelihood1 of disease approximates 50% (1). As we move away from that intermediate point, the test tends to add less value and increases the number of false positive (FP) and false negative (FN) results. Patterns of testing associated with high numbers of incorrect results increase cost unnecessarily and may result in harms such as misdiagnosis and missed diagnosis.
Prior likelihood of disease
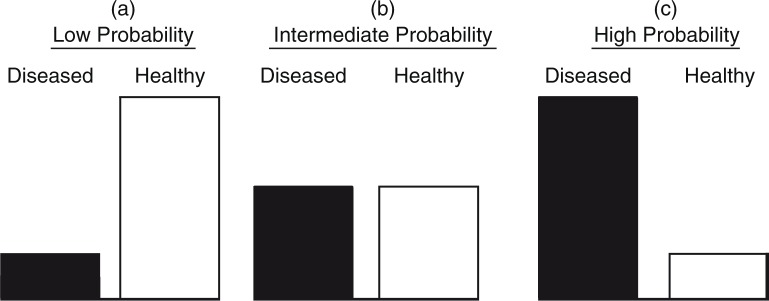
Judicious testing requires the ordering practitioner to consider the likelihood of disease in the presenting patient. Such judgment requires the assessment of multiple factors, such as prevalence of the disease in the population and in the patient's ethnic group or gender. Similarly, signs and symptoms associated with the disease increase the probability of disease. After assessing all relevant factors, the ordering practitioner establishes or intuits a pretest probability of disease. For a few diagnoses, research has documented clear guidelines for approximating a numerical pretest probability of disease based on various factors (2–4). However, in the vast majority of cases, one must settle for placing a patient into one of the three categories: high, low, or intermediate probability of disease. Although not well defined, intermediate probability suggests a likelihood of disease between 30 and 70% (Fig. 1). Similarly, screening test recommendations take into consideration the likelihood of disease. For example, the United States Preventative Services Task Force advocates many screening tests based upon the presence or absence of risk factors.
Fig. 1.
Prior probability of disease. In the figure, three common clinical scenarios are graphically depicted. (a) There is a low suspicion of the sought after disease. (b) There is moderate suspicion of the sought after disease. The likelihood of disease is an even coins toss. (c) The disease is thought to be very likely.
Testing in patients with high, low, and intermediate likelihood of disease
The practitioner's initial assessment of likelihood of disease should drive testing. Tests should be considered tools that assist in further defining the initial approximation of disease, particularly when the pretest probability of disease is moderate. In the face of intermediate pretest probability of disease, strategic testing is utilized to push the approximation of disease in one direction or the other. For example, a person with a 60% likelihood of disease may be submitted to testing. A positive test result may move the approximation to 80% warranting further investigation. On the contrary, a negative result might move the approximation to 40%. Based on factors such as the morbidity of the disease under consideration and the availability of an effective intervention, the clinician must make a decision if further testing or treatment is warranted.
However, the utility of testing tends to be low when there is a high or low pretest likelihood of disease. In these scenarios, testing only minimally affects the initial approximation. Therefore, patients with high or low pretest likelihood of disease may not benefit from testing. Testing in these patients tends to confirm the obvious when consistent with the practitioner's initial assessment. When the result is contrary to the initial assessment, there is an increased risk that the practitioner is facing an FP or FN test result. In this situation, the common response is more (unnecessary) testing, increasing the risk related to possible invasive tests and the costs, worry and expenditure of time resulting from further evaluation.
Sensitivity and specificity
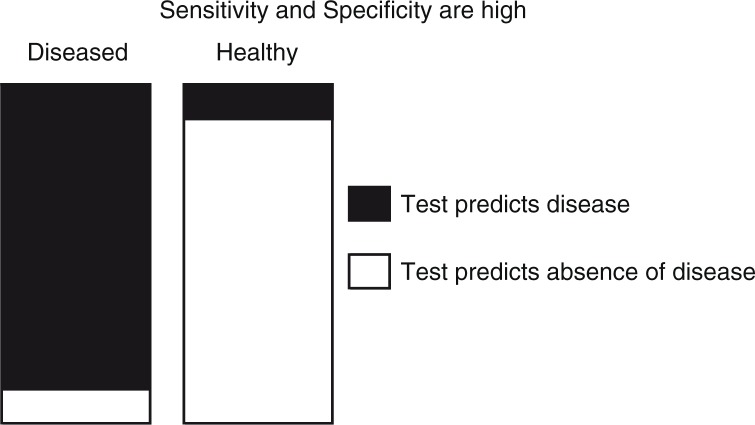
In making a decision to order a test, the diagnostician must consider its sensitivity and specificity. A test's performance is evaluated in terms of its predictive accuracy in patients with and without disease. The performance of the test in one group is independent of its performance in the other group. Sensitivity is a measure of how well the test predicts positive in persons with disease, whereas the specificity predicts how well it predicts negative in persons without disease (5). The significance of a positive (or negative) test result can be predicted based on the 1) sensitivity, 2) specificity, and 3) pretest probability of disease. Figure 2 demonstrates the results of testing in an intermediate likelihood of disease with relatively high sensitivity and specificity. In such a situation, positive and negative results tend to be accurate.
Fig. 2.
Distribution of test results when the prior probability of the sought after disease is 50%. It illustrates that when the sensitivity is high, there are relatively few diseased persons who test negative (white). Similarly, when specificity is high few healthy persons test positive (black). Therefore, a positive test result is truly likely to represent disease, and a negative result is truly likely to represent the absence of disease.
Positive results and the test threshold
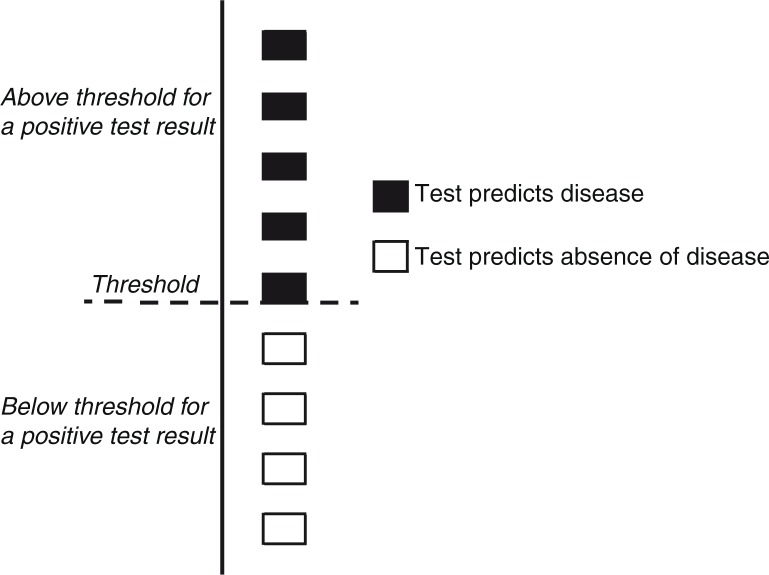
While some tests are qualitative and report as positive or negative, other diagnostic tests are associated with a threshold value (cut-point) to define a positive result for a quantitative value. The clinician interprets the result. For example, a fasting glucose of 126 mg/dL and a hemoglobin A1C of 6.5% are commonly used as thresholds of positivity for the diagnosis of type 2 diabetes mellitus (Fig. 3). However, knowing a threshold value alone, without a knowledge of pretest probability and test performance characteristics, does not allow the clinician to fully assess the results.
Fig. 3.
Threshold (or cut-point) predicts the presence or absence of disease. Various tests use a numeric threshold value to categorize results as positive or negative. In this figure, five of nine persons have values above the threshold while four fall below. This simplistic figure does not differentiate true positive from false positives or true negatives from false negatives.
Interpreting a positive or negative result
After considering the pretest probability of disease and the performance of the test in the disease population (sensitivity) and the non-disease population (specificity), the clinician may predict the likelihood of each of the four possible results: true positive (TP), false positive (FP), true negative (TN), and false negative (FN). The positive predictive value (PPV) defines the likelihood that a positive test result truly represents disease. The negative predictive value (NPV) is similar:
Intermediate probability example
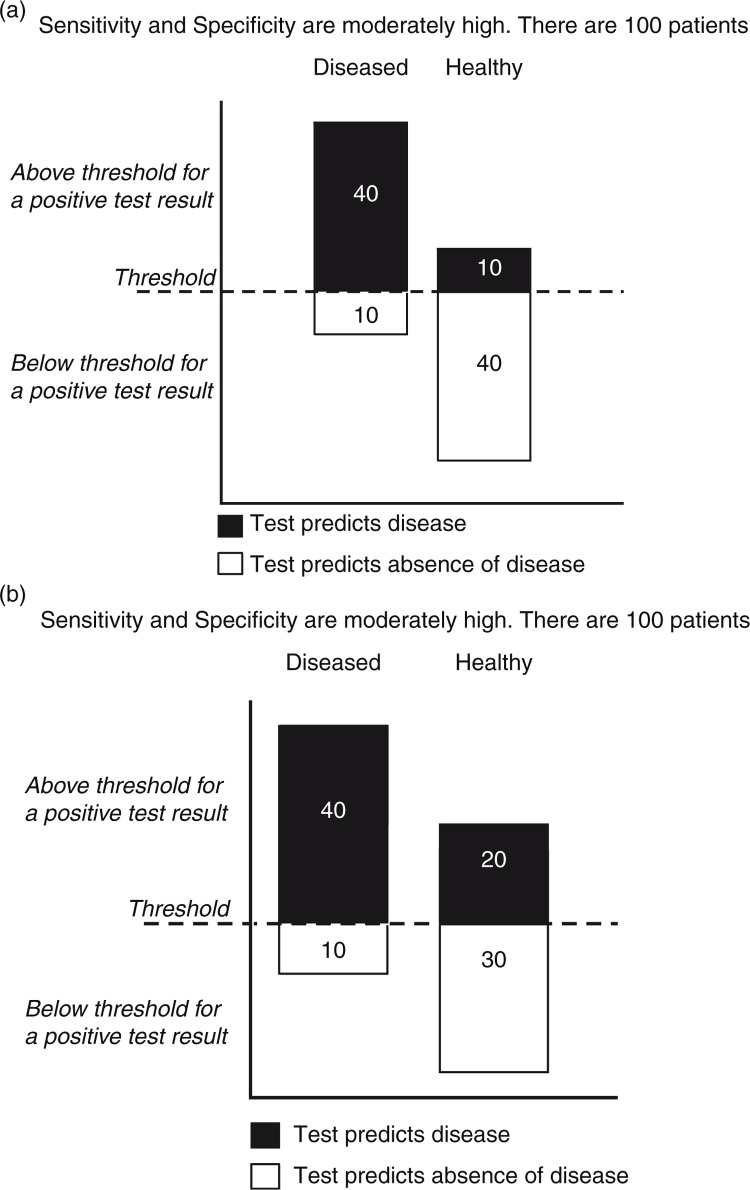
Figure 4a illustrates test results when there is an intermediate probability of disease. The sensitivity and specificity are moderate at 80% each. Still in this situation, positives are predominately TPs. While the prior probability of disease is 50%, a positive test result is expected in 50 persons and 40 of these will be TP. The PPV in this situation is 80% (40/50×100%). This helps the clinician by shifting a patient from the intermediate to the high likelihood category.
Fig. 4.
(a) Distribution of test results relative to a threshold value when the prior probability of the sought after disease is 50%. This figure depicts the distribution of test results above and below a threshold value when the likelihood of disease is intermediate. In this example, a positive test result is four times as likely to represent a true positive. Of 50 positive test results, 40 are positive, yielding a positive predictive value of 80%. This is a significant improvement over the prior (pretest) probability of 50%. (b) Poor specificity and intermediate prior probability of disease. If the test utilized has a poor specificity, then a positive test result will be difficult to interpret. Tests with poor specificity result in a large number of false positives lowering the positive predictive value. In the above case, the positive predictive value has dropped to 66% (40/60×100) compared with 80% in (a) due to a specificity of 60% (30/50×100).
Figure 4b demonstrates a common problem occurring when the test specificity is poor: a high number of FP results lead to a low PPV. In the example, the pretest probability of disease is intermediate (50%) and the sensitivity is 80%, as in the prior example. However, the specificity is only 60%. This suggests that 40% of persons without disease will have an FP (100–60%) (5). A positive test result in this situation reveals a PPV of only 66% (40/60×100%), insufficient to shift the patient out of the intermediate probability group.
Low probability example
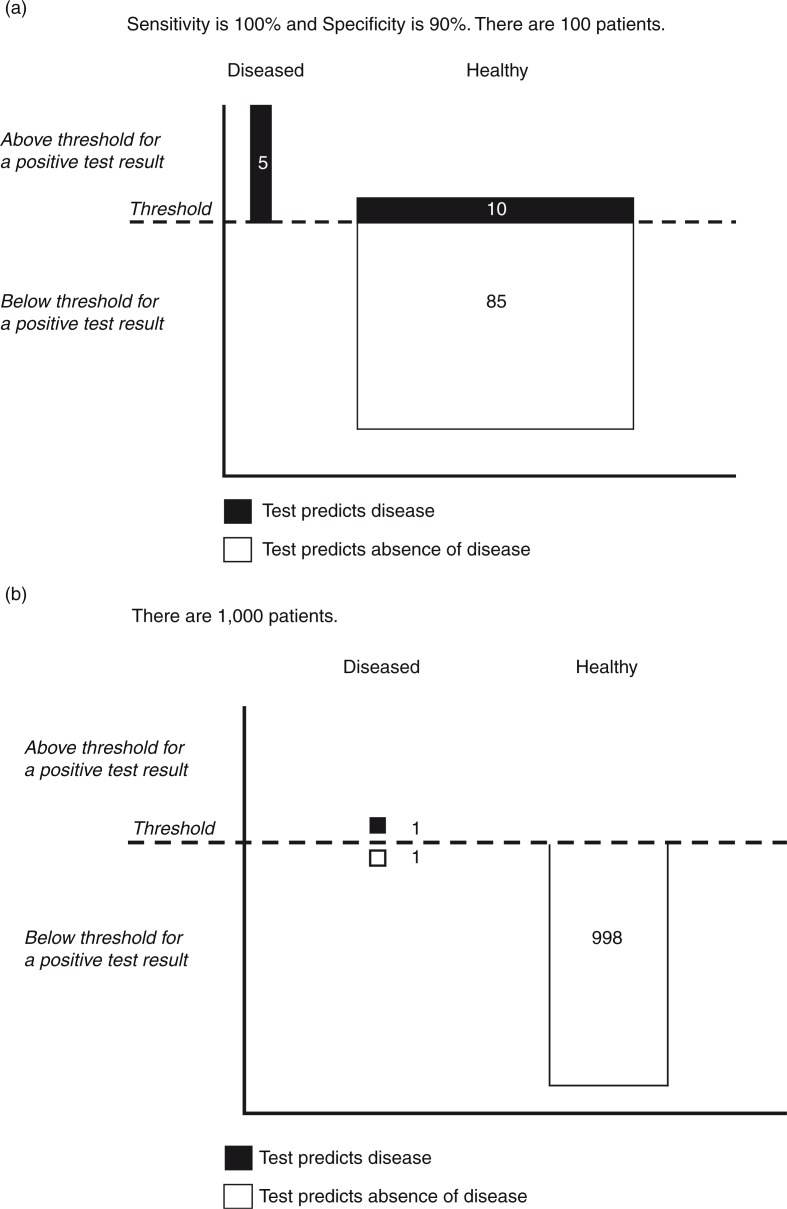
A common problem occurs when a clinician orders a test on a patient with a low likelihood of disease. In this case, the number of patients without disease far exceeds the number with disease. The result is a large number of FP results in healthy patients. This dilutes the total number of positive results and results in a low PPV. Figure 5a illustrates the case where the prior probability of disease is 5%. The specificity is high at 90% and for illustration, we assume 100% sensitivity. In this situation, every person with disease is captured by the test. Unfortunately, even with high specificity, there is a large number of FPs (10) due to the large number of healthy persons (95). The PPV is only 33% (5/15), illustrating that positive results are often misleading when there is a low pretest probability of disease.
Fig. 5.
(a) Distribution of test results relative to a threshold value when the prior probability of the sought after disease is low (5%). In a situation in which the prior probability of disease is low, the likelihood that a positive test result is a false positive goes up dramatically. In this case, the likelihood of disease is 5%. Despite a perfect sensitivity and a high specificity, a positive test result is twice as likely to be a false positive. (b) Special situation: specificity of 100% and low prior probability of disease. Screening for rare diseases may be effective in situations in which the screening test never has a false-positive result (100% specificity). In this situation, every positive result is a true positive and the prior likelihood of disease becomes irrelevant. However, testing large numbers of persons to identify a rare disease is inefficient and may be prohibitive in terms of cost and other harms.
A special exception to this general rule occurs when the specificity approaches 100% (Fig. 5b). At 100% specificity, there are no FP results. Hence, every positive is a TP. The PPV will be 100% (PPV=TP/(TP+FP)×100=TP/(TP+0)×100=100%, hence the well-known axiom that a high specificity test can be used to ‘rule in’ a diagnosis (6). Keep in mind that 100% PPV does not mean that every person with disease is identified; it simply means that every positive result is a TP. High specificity tests may be useful in screening populations unlikely to have disease. However, from a perspective of high-value care, the cost, inconvenience, and harms associated with testing in a large population may outweigh the benefits even with 100% PPV.
High probability example
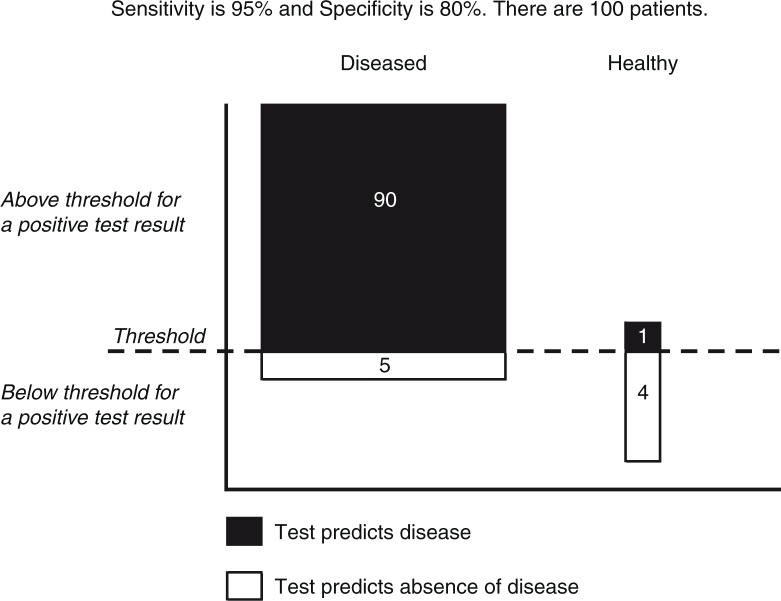
Figure 6 illustrates the situation in which the clinician is very confident that the patient has the disease. In this situation, 95% of patients have disease. Sensitivity is high at 95% and specificity is moderately high at 80%. A positive test result in this situation does not materially affect confidence. The PPV is 99% representing certainty; however, it is only 4% greater than the pretest likelihood (95%) and does not change the categorization of the patient (high likelihood of disease). Hence, subsequent management should be the same. The patient has been exposed to the risk, cost, and inconvenience of a test that does not impact care. Additionally, in the unlikely event that a negative result occurs, the patient may be exposed to additional (unnecessary) testing or delay in appropriate therapy.
Fig. 6.
Distribution of test results relative to a threshold value when the prior probability of the sought after disease is high (95%). In the situation in which a prior probability is high, a test generally adds little. In this case, the prior probability is 95%. A positive test adds only 4% to the positive predictive value (90/91=0.99=99%). Numbers in the illustration are rounded to the closest digit.
Analogous to the explanation given in ‘Low Probability Example’ section a test with a sensitivity of 100% will have no FN results. Hence, every negative is a TN. The common wisdom therefore is that a test with very high sensitivity may be used to ‘rule out’ a diagnosis (6). Such tests have a high NPV.
PPV varies by practitioner
PPV is not solely a characteristic of the test or of the population, but rather results from the interplay of both these in combination with the clinician's pattern of test utilization. The overly careful clinician may order testing in patients with low pretest probability of disease resulting in increased FP results. The practitioner predisposed to order confirmatory testing may do so when the pretest likelihood of disease is already high. This may result in increased FN results. Both scenarios increase cost, confuse diagnostic decision-making, and demonstrate how test performance is impacted by practice habits of clinicians.
Summary
One component of high-value care is diagnostic testing. Prior to ordering a test, practitioners must carefully consider the pretest likelihood of disease and test performance characteristics in patients with and without disease. A test should be ordered only when the result may change the categorization of disease likelihood. Such practice characterizes evidence-based decision-making and results in reductions in costs, harms, and downstream testing.
Acknowledgments
The author gratefully acknowledges the contributions of Dharscika Arudkumaran and Rashek Kazi, whose thoughtful reviews and constructive criticisms contributed to the completion of this document. Additional thanks are extended to Kalim Qadri and Jason Zweig for proofreading the completed manuscript.
Footnotes
Pretest probability, prior probability, and prior likelihood of disease all refer to approximations of the likelihood of disease posited before testing results are considered.
Conflict of interest and funding
The author has not received any funding or benefits from industry or elsewhere to conduct this study.
References
- 1.Sackett DL, Hynes RB, Guyatt GH, Tugwell P. Clinical epidemiology: A basic science for clinical medicine. 2nd ed. Boston, MA: Little, Brown; 1991. [Google Scholar]
- 2.Pryor DB, Shaw L, McCants CB, Lee KL, Mark DB, Harrell FE, Jr, et al. Value of the history and physical in identifying patients at increased risk for coronary artery disease. Ann Intern Med. 1993;118(2):81–90. doi: 10.7326/0003-4819-118-2-199301150-00001. [DOI] [PubMed] [Google Scholar]
- 3.Pryor DB, Harrell FE, Jr, Lee KL, Califf RM, Rosati RA. Estimating the likelihood of significant coronary artery disease. Am J Med. 1983;75(5):771–80. doi: 10.1016/0002-9343(83)90406-0. [DOI] [PubMed] [Google Scholar]
- 4.Diamond GA, Forrester JS. Analysis of probability as an aid in the clinical diagnosis of coronary-artery disease. N Engl J Med. 1979;300(24):1350–8. doi: 10.1056/NEJM197906143002402. [DOI] [PubMed] [Google Scholar]
- 5.Cardinal LJ. Diagnostic testing: A key component of high-value care. J Community Hosp Intern Med Perspect. 2016;6(3):31664. doi: 10.3402/jchimp.v6.31664. [DOI] [PMC free article] [PubMed] [Google Scholar]
- 6.Straus SE, Richardson WS, Glasziou P, Haynes RB. Evidence-based medicine. Edinburgh: Elsevier Churchill Livingstone; 2005. [Google Scholar]


