

Abstract
Background
Diabetic kidney disease is the leading cause of stage 5 chronic kidney disease (CKD) in India. Renal replacement therapy (RRT) is accessible to very few patients because of socioeconomic deprivation. We studied the effect of diabetes and socioeconomic status on the outcome of patients on maintenance hemodialysis (MHD).
Methods
We retrospectively analyzed the outcome of 897 patients (629 males/268 females; mean age ± standard deviation 48.69 ± 14.27 years) initiated on MHD from 2003 to 2009 at five dialysis centers in south India. There were 335 type 2 diabetic patients and 562 non-diabetic patients. Group 1 comprised the self-paying patients (518 patients) and Group 2 included the TANKER Foundation charity dialysis patients (379 patients). We compared the 5-year survival rates of Group 1 versus Group 2 and also those of diabetic versus non-diabetic patients, using the Kaplan–Meier survival estimator.
Results
Of the 897 patients, 166 patients survived, 350 died, 234 were lost to follow-up, 137 had renal transplantation and 10 patients were transferred to peritoneal dialysis. The 5-year survival rates after censoring were 20.7 and 38.2% for diabetic and non-diabetic patients, respectively (P < 0.001). The survival rate of diabetic patients was significantly lower, compared with non-diabetic patients, in Group 2 (P < 0.001), but not significantly lower in Group 1 (P = 0.226).
Conclusions
Diabetic patients have poor survival rates on MHD, especially those from poor socioeconomic groups. Due to scarce RRT facilities and poor survival rates of diabetic patients, prevention, early detection and management of diabetic CKD patients should be the way to go forward.
Keywords: diabetic kidney disease, hemodialysis, socioeconomic class, survival analysis
Introduction
The prevalence of diabetes mellitus in India, where the total population is 1.25 billion people, is roughly 7.1%, and diabetes is four times more common in urban, compared with rural, India [1, 2]. The proportion of gross domestic product expenditure on health care in India by the government is a meager 1.3% [3]. The economic burden of diabetes care in India is enormous, and about 5–10% of the national health budget is spent on prevention and treatment of diabetes [4]. Screening programmes for early detection of diabetes mellitus are scarcely carried out.
Diabetic kidney disease is the most common cause of chronic kidney disease (CKD), according to the Indian CKD Registry, accounting for 31.3% of CKD cases [5]. Of the patients included in the Registry, 25.9 and 48.1% presented to nephrology care with CKD stages 4 and 5, respectively. Of note, most of the diabetic centers are located only in major cities, whereas the majority of the Indian population live in villages, and tier 2 and tier 3 cities [8]. Moreover, there are only about 1400 nephrologists in a country with a population of 1.25 billion, which approximates to one nephrologist per 1 million inhabitants [9]. Studies have shown that CKD is much more prevalent in patients with lower socioeconomic status [6, 7]. About 42.7% of the CKD patients in the Indian CKD Registry have a monthly income of less than Rs 5000 (US$ 74.09), which means that the need for renal replacement therapy (RRT) has an enormous financial impact on these patients [5].
Sustained RRT is available for less than 5% of the low-income group of patients [10]. The high costs of RRT, a lack of government financial support programs for end-stage renal disease (ESRD) patients and minimal health insurance coverage all restrict the affordability of RRT services to patients. The most widely used RRT modality is maintenance hemodialysis (MHD), although RRT facilities vary widely among private and government centers [10], and the prevalence of patients on MHD in India is 86 per million population, as of 2015 [11].
There is a paucity of multicentric data on survival rates of diabetic, compared with non-diabetic, patients on MHD in India. Previously we published limited data on the survival of MHD patients between 1999 and 2006, which showed a significant difference in survival among patients from different socioeconomic groups [10]. The aim of this retrospective analysis was to examine the survival rates of diabetic and non diabetic patients belonging to different socioeconomic groups who were initiated on MHD between 2003 and 2009, using data from five dialysis centers in India.
Materials and methods
We retrospectively analyzed the outcome of 897 patients (629 males and 268 females; mean age ± standard deviation 48.69 ± 14.27 years) who were initiated on MHD between 2003 and 2009 at five dialysis centers: Madras Medical Mission Hospital (MMM), Pondicherry Institute of Medical Science (PIMS) and three centers of the TANKER Foundation (http://www.tankerfoundation.org). Of the 897 patients, there were 335 type 2 diabetic patients and 562 non-diabetic patients. These 335 patients had been diagnosed with diabetic kidney disease by their referring doctors. However, it is possible a bias might have been present in the diagnosis of diabetic kidney disease in a minority of referrals, as renal biopsies were not performed to rule out other nephropathies. Hence, the type 2 diabetic patients included in this study could have diabetes mellitus either as a cause of renal disease or as a comorbidity.
We stratified patients into Group 1 (518 patients) and Group 2 (379 patients). Group 1 included patients from middle and higher socioeconomic classes who underwent hemodialysis at MMM and PIMS, both not-for-profit tertiary care centers. Group 2 included patients from lower socioeconomic classes who underwent hemodialysis either free of cost (80%) or at subsidized rates (20%) at three centers of the TANKER Foundation, a charitable trust. The cost of subsidized dialysis was Rs 365 (US$ 5.41) per session. Table 1 shows details of the dialysis membranes used and the frequencies and costs of dialysis at the study centers.
Table 1.
Characteristics of dialysis membranes, dialysis frequencies and dialysis costs in the study centers
| Center | Madras Medical Mission Hospital | Pondicherry Institute of Medical Science | TANKER Foundation |
|---|---|---|---|
| Number of patients | 241 | 277 | 379 |
| Dialysis membrane used | Polysulphone and cellulose acetate | Polysulphone and hemothane | Polysulphone |
| Membrane surface area (m2) | 1.3–1.8 | 1.2–1.4 | 1.1–1.3 |
| Frequency of dialysis | Twice or thrice weekly | Twice weekly | Twice weekly |
| Cost of dialysis per year (US$) | 2421–3229 | 1550–1705 | 848 |
| Cost of erythropoietin per year (US$) | 888 | 465–930 | 157 |
We collected the following clinical and biochemical parameters of the patients at presentation: systolic blood pressure (SBP) and diastolic blood pressure (DBP), body mass index (BMI), hemoglobin level, serum albumin, serum calcium, serum phosphorus, serum bicarbonate, blood urea and serum creatinine. Data on events such as transplantation, transfer to continuous ambulatory peritoneal dialysis (CAPD) and loss to follow-up were also collected as censored observations.
Data analysis was performed using SPSS version 20 (IBM Corporation, Armonk, NY, USA). Data for the above parameters were the mean of three readings, each taken before a dialysis session. The independent samples t-test was used to compare the mean values of the different baseline parameters between Groups 1 and 2 and between diabetic and non-diabetic patients. We compared the 5-year survival rates of Group 1 versus Group 2, and diabetic versus non-diabetic patients using the Kaplan–Meier survival estimator. We also compared the survival rates of diabetic versus non-diabetic patients in each socioeconomic group.
Results
Table 2 shows the comparison of clinical and biochemical parameters between diabetic and non-diabetic patients at presentation. Diabetic patients had higher age, compared with non-diabetic patients (P < 0.001). In addition, diabetic patients had lower DBP (P < 0.001), lower serum albumin (P = 0.053), higher bicarbonate (P = 0.047) and lower serum creatinine levels (P < 0.001), compared with non-diabetic patients. There were no statistically significant differences in SBP, BMI and hemoglobin, or in levels of serum albumin, serum calcium and serum phosphorus. Table 3 shows the comparison of clinical and biochemical parameters between Groups 1 and 2. There was a trend towards lower DBP (P = 0.057) and higher bicarbonate levels (P = 0.057) in Group 1, compared with Group 2, though not statistically significant.
Table 2.
Comparison of baseline parameters between diabetic and non-diabetic patients
| Parameter | Value |
P-value | |
|---|---|---|---|
| Diabetic patients (n = 335) | Non-diabetic patients (n = 562) | ||
| Age (years) | 56.288 ± 9.787 | 44.112 ± 14.575 | <0.001 |
| Sex | 240 males/95 females | 391 males/171 females | 0.476 |
| SBP (mmHg) | 147.516 ± 27.223 | 144.784 ± 27.544 | 0.218 |
| DBP (mmHg) | 81.440 ± 14.171 | 87.025 ± 15.754 | <0.001 |
| BMI (kg/m2) | 22.213 ± 5.145 | 21.682 ± 4.233 | 0.368 |
| Serum albumin (g/dL) | 3.437 ± 0.965 | 3.719 ± 1.915 | 0.053 |
| Hemoglobin (g/dL) | 8.662 ± 1.947 | 8.516 ± 2.137 | 0.388 |
| Corrected calcium (mg/dL) | 8.298 ± 1.300 | 8.392 ± 1.441 | 0.480 |
| Phosphorus (mg/dL) | 5.536 ± 2.117 | 5.651 ± 2.079 | 0.618 |
| Bicarbonate (mEq/L) | 20.778 ± 10.984 | 19.176 ± 5.317 | 0.047 |
| Urea (mg/dL) | 119.862 ± 66.453 | 122.319 ± 61.944 | 0.643 |
| Creatinine (mg/dL) | 7.504 ± 3.514 | 9.466 ± 4.413 | <0.001 |
Data are presented as mean ± standard deviation.
Table 3.
Comparison of baseline parameters between Groups 1 and 2
| Parameter | Mean |
P-value | |
|---|---|---|---|
| Group 1 (n = 518) | Group 2 (n = 379) | ||
| Age (years) | 50.438 ± 14.182 | 46.257 ± 14.056 | <0.001 |
| Sex | 367 males/151 females | 262 males/117 females | 0.625 |
| SBP (mmHg) | 145.335 ± 27.849 | 149.730 ± 24.042 | 0.195 |
| DBP (mmHg) | 84.497 ± 15.827 | 88.108 ± 10.813 | 0.057 |
| BMI (kg/m2) | 21.670 ± 4.655 | 22.620 ± 4.216 | 0.168 |
| Serum albumin (g/dL) | 3.634 ± 1.657 | 3.286 ± 0.666 | 0.270 |
| Hemoglobin (g/dL) | 8.530 ± 2.100 | 8.524 ± 1.807 | 0.976 |
| Calcium (mg/dL) | 8.377 ± 1.411 | 8.075 ± 0.861 | 0.233 |
| Phosphorus (mg/dL) | 5.625 ± 2.106 | 4.831 ± 1.505 | 0.179 |
| Bicarbonate (mEq/L) | 20.075 ± 8.551 | 17.735 ± 2.206 | 0.057 |
| Blood urea (mg/dL) | 126.388 ± 64.829 | 84.684 ± 30.686 | <0.001 |
| Serum creatinine (mg/dL) | 8.628 ± 4.152 | 8.612 ± 2.609 | 0.969 |
Data are presented as mean ± standard deviation.
Of the 897 patients, 166 patients survived, 350 patients died, 234 were lost to follow-up, 137 patients had renal transplant and 10 patients were transferred to CAPD. Of those patients lost to follow-up, 128 were from PIMS, 65 from the TANKER Foundation and 41 from MMM. Table 4 shows the outcomes of the diabetic and non-diabetic patients after initiation of MHD.
Table 4.
Outcomes of diabetic and non-diabetic patients initiated on MHD across study centers
| Diabetic patients | Non-diabetic patients | |
|---|---|---|
| Total no. of patients | 335 | 562 |
| No. of patients who died | 160 | 190 |
| No. of patients who survived | 52 | 114 |
| No. of renal transplants | 31 | 106 |
| No. of patients transferred to CAPD | 6 | 4 |
| No. of patients lost to follow-up | 86 | 148 |
The 5-year survival rate was 20.7% in diabetic patients, compared with 38.2% in non-diabetic patients (P < 0.001), as shown by the Kaplan–Meier curve comparing survival in Figure 1. The 5-year survival rate of patients in Group 2 was 25.5%, compared with 41.8% in Group 1 patients (P < 0.001), as shown by the Kaplan–Meier curve in Figure 2. Among the lower socioeconomic class patients (Group 2), the 5-year survival rate was 7.1% in diabetic patients and 35.3% in non-diabetic patients (P < 0.001) (Figure 3). Among the higher and middle socioeconomic class patients (Group 1), the 5-year survival rate was 38.9% in diabetic patients and 44.3% in non-diabetic patients (P = 0.226) (Figure 4). Using the Cox proportional hazard model, as shown in Table 5, higher age (P = 0.002), the presence of diabetes (P < 0.001) and a lower socioeconomic status (P < 0.001) were associated with lower survival rates.
Fig. 1.
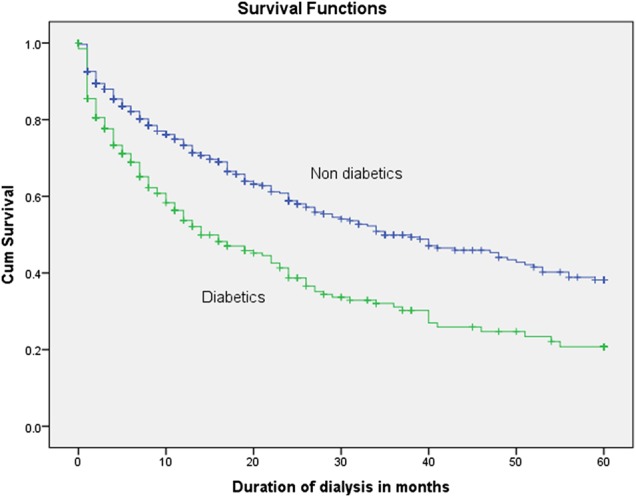
Survival rates of diabetic, compared with non-diabetic, patients (P < 0.001).
Fig. 2.

Survival rates of patients by socioeconomic group (P < 0.001).
Fig. 3.

Survival rates of diabetic, compared with non-diabetic, patients in the lower socioeconomic group (P < 0.001).
Fig. 4.
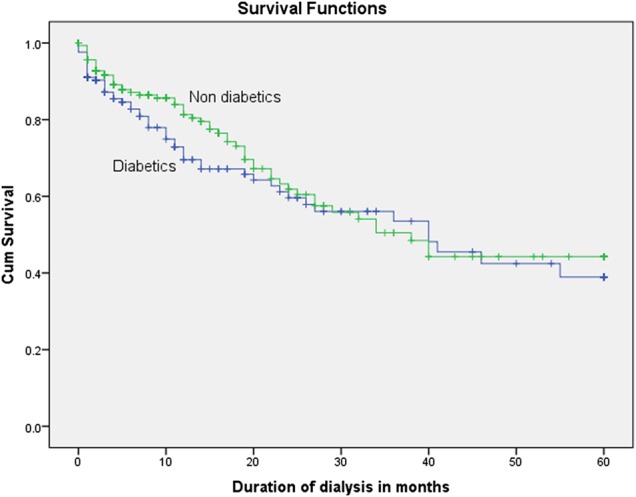
Survival rates of diabetic, compared with non-diabetic, patients in the middle and higher socioeconomic group (P = 0.226).
Table 5.
Cox proportional hazards regression model for predictors of survival in patients on MHD
| Variable | B | Standard error | P-value | Exp (B) * hazard ratio | 95% CI for Exp (B) |
|
|---|---|---|---|---|---|---|
| Lower | Upper | |||||
| Age | 0.015 | 0.005 | 0.002 | 1.015 | 1.005 | 1.024 |
| Socioeconomic class | 0.745 | 0.117 | <0.001 | 2.107 | 1.675 | 2.650 |
| Diabetes | 0.549 | 0.123 | <0.001 | 1.731 | 1.361 | 2.203 |
Discussion
Data from the Indian CKD Registry showed that diabetic kidney disease is the most common cause (31.3%) of CKD [5]. In our study, 37.3% of patients initiated on MHD were diagnosed with diabetic kidney disease, thus it is in agreement with the Registry data. Using the Cox proportional hazard model, we found that a higher age at initiation of dialysis, the presence of diabetes and a lower socioeconomic status were all associated with lower survival rates. For example, the 5-year survival rate was 20.7% in our diabetic patients, compared with 38.2% in the non-diabetic patients. Data on survival rates in patients with diabetic kidney disease in South Asia are scarce. A recent Indian prospective single-center study of 96 patients on MHD in a private tertiary care center reported a 2-year mortality rate of 19.8% [12]. Another retrospective analysis of 95 patients on MHD showed a median survival period of 410 days [13]. Here, we report 5-year survival rates from a large retrospective analysis of 897 patients from different socioeconomic groups who were initiated on MHD in five centers in south India from 2003 to 2009.
The 2014 United States Renal Data System reported that only 37.2% of patients with diabetic kidney disease survived 5 years after initiation of hemodialysis [14]. Racki et al. also reported poorer survival of diabetic, compared with non-diabetic, patients on MHD in Croatia (P = 0.0013) [15]. Lack of compliance to drug therapy to control the glycemic status, and thereby to slow the progression of kidney disease, is a major factor contributing to an increased mortality in diabetic kidney disease [16–18]. Survival rates of diabetic patients on MHD are poorer in India than in developed countries. The best and most cost-effective intervention that can be applied is early diagnosis and management of diabetes in the population, through large-scale screening and follow-up—which are lacking in India. Such an interventional strategy is supported by the Action in Diabetes and Vascular Disease: Preterax and Diamicron Modified Release Controlled Evaluation (ADVANCE) trial [19] and the UK Prospective Diabetes Study (UKPDS) [20]. In India, strategies to reduce the incidence of diabetic kidney disease include glycemic control, smoking cessation, lifestyle modification, patient education at the primary health-care level, avoidance of alternative medicines and herbs, use of angiotensin-converting enzyme inhibitors (ACEIs) or angiotensin receptor blockers (ARBs) and prevention of acute kidney injury. It is an alarming fact that over 40% of diabetic patients in India fail to attend their regular follow-up appointments [17].
In line with results from our previous study [10], the 5-year survival rate of patients in Group 2 was 25.5%, whereas that of Group 1 patients was 41.8%. On analyzing and comparing the survival rates of diabetic and non-diabetic patients on MHD, according to their socioeconomic groups, we found those diabetics belonging to Group 2 had the poorest 5-year survival rate of 7.1%, which was lower than that of non-diabetic patients in Group 2 at 35.3%. In Group 1, although survival rates for diabetic patients seem to be lower in the first 20 months, the overall survival difference, compared to non-diabetic patients in Group 1, was not statistically significant. This observation is based on better glycemic control and management of comorbidities provided to patients in the higher socioeconomic group. Diabetic patients on MHD from lower socioeconomic groups have the poorest survival, due to suboptimal care for undiagnosed cardiovascular disease, poor nutritional status, irregular dialysis schedules and poor compliance to dietary restrictions and glycemic management. Also, these patients do not have access to skilled multispecialty services. Patients undergoing MHD in a multispecialty hospital are seen by a nephrologist during every session and undergo detailed cardiovascular evaluation and pharmacotherapy, including beta blockers, ACEIs, ARBs, antiplatelet drugs and statins, with regular follow-up. They also have access to erythropoiesis-stimulating agents (ESAs), bicarbonate supplements, skilled renal dietitian services and other multispecialty care. In the last couple of years, economically advanced state governments have established free dialysis programs targeting a very small subset of eligible patients. Patients under the care of the TANKER Foundation fall into this category of patients eligible for free dialysis and ESAs from the state government of Tamil Nadu. However, these free dialysis programs can only cater for a very small subset of the population as resource availability is scarce.
Malnutrition is prevalent in 42–77% of the ESRD population in developing countries, which is strongly associated with increased mortality [21]. Serum albumin levels of <3.5 g/dL are associated with poor survival rates [22]. In our study, the mean serum albumin levels in Group 2 and diabetic patients were <3.5 g/dL. Hemoglobin levels were also low in patients on MHD, regardless of whether they were diabetic or non-diabetic. BMI was low in both diabetic and non-diabetic patients. This is probably due to widespread malnutrition in CKD patients in India.
An analysis of the cause of death showed cardiovascular disease as the most common cause in 60% of cases; other mortality cases also occurred outside the dialysis units, and hence their exact cause was not known. In the TANKER Foundation centers, 65 patients were lost to follow-up. It is likely that the majority of these 65 patients did not have access to RRT elsewhere, due to unaffordability of the treatment. The Indian CKD Registry does not include data on the follow-up of patients on RRT. Hence, there are very limited nationwide registry data available that examine the causes of death, which constitutes a major drawback in the evaluation of mortality in patients on MHD. Although the federal government has recently declared a policy of setting up hemodialysis centers across all 650 districts in India, the dearth of trained nephrologists will be a handicap in its implementation.
In developing countries like India, the cost of dialysis has an impact on the outcome of patients. The majority of patients, including those in hospital-based dialysis centers, have to cover the cost of treatment out of their own pocket, and hence the overall cost of assessment for cardiovascular disease, erythropoietin usage and hospitalization puts an enormous burden on the self-paying group of patients [3, 10].
Relative to the population increase of 44% between 1990 to 2013 in India, the number of years lived with disability due to diabetes per million people has increased by 55%, according to the Global Burden of Disease Study 2013 [23]. The increasing burden of diabetes, the scarcity of RRT services and poor survival rates of patients with diabetic kidney disease together imply that there is an urgent need to implement large-scale screening and awareness programs on diabetes mellitus in India. Results from our large retrospective multicenter study of patients on MHD from different socioeconomic classes clearly demonstrate that those patients with diabetic kidney disease belonging to a lower socioeconomic group have poorer survival rates.
A limitation of this study is that, as this is a retrospective analysis of individuals from different socioeconomic groups, data on cardiovascular comorbidities for patients in the lower socioeconomic group were not readily available.
Conclusion
Diabetic CKD patients from lower socioeconomic classes have poor survival rates on MHD. With available RRT resources being grossly inadequate to cater for the patient population requiring such treatment, there is an urgent need to screen diabetics for CKD, improve awareness and take appropriate steps to slow down the progression of CKD. As CKD is becoming a major cause of morbidity and mortality in India, government health-care expenditure must be increased accordingly to improve access to specialized RRT services for economically deprived patients.
Conflict of interest statement
None declared. The results presented in this paper have not been published previously in whole or in part, except in abstract format.
References
- 1.Shaw JE, Sicree RA, Zimmet PZ. Global estimates of the prevalence of diabetes for 2010 and 2030. Diabetes Res Clin Pract 2010; 87: 4–14 [DOI] [PubMed] [Google Scholar]
- 2.Kaveeshwar SA, Cornwall J. The current state of diabetes mellitus in India. Australas Med J 2014; 7: 45–48 [DOI] [PMC free article] [PubMed] [Google Scholar]
- 3.The World Bank. Healthcare expenditure, public (% of GDP). http://data.worldbank.org/indicator/SH.XPD.PUBL.ZS (9 March 2015, date last accessed)
- 4.Verma R, Khanna P, Mehta B. National programme on prevention and control of diabetes in India: need to focus. Australas Med J 2012; 5: 310–315 [DOI] [PMC free article] [PubMed] [Google Scholar]
- 5.Rajapurkar MM, John GT, Kirpalani AL et al. What do we know about chronic kidney disease in India: first report of the Indian CKD registry. BMC Nephrol 2012; 13: 10. [DOI] [PMC free article] [PubMed] [Google Scholar]
- 6.Wolf G, Busch M, Müller N et al. Association between socioeconomic status and renal function in a population of German patients with diabetic nephropathy treated at a tertiary centre. Nephrol Dial Transplant 2011; 26: 4017–4023 [DOI] [PubMed] [Google Scholar]
- 7.Secrest AM, Costacou T, Gutelius B et al. Associations between socioeconomic status and major complications in type 1 diabetes: the Pittsburgh epidemiology of diabetes complication (EDC) Study. Ann Epidemiol 2011; 21: 374–381 [DOI] [PMC free article] [PubMed] [Google Scholar]
- 8.Abraham G. The challenges of renal replacement therapy in Asia. Nat Clin Pract Nephrol 2008; 4: 643. [DOI] [PubMed] [Google Scholar]
- 9.Yasmeen A. Shortage of nephrologists hits patients hard. http://www.thehindu.com/todays-paper/tp-national/shortage-of-nephrologists-hits-patients-hard/article5697481.ece (21 July 2016, date last accessed) [Google Scholar]
- 10.Abraham G, Jayaseelan T, Matthew M et al. Resource settings have a major influence on the outcome of maintenance hemodialysis patients in South India. Hemodial Int 2010; 14: 211–217 [DOI] [PubMed] [Google Scholar]
- 11.Abraham G, Varughese S, Thandavan T et al. CKD in South Asia – an update. https://www.era-edta.org/newsletter_ndt_southasia_update.html (11 April 2016, date last accessed)
- 12.Chandrashekar A, Ramakrishnan S, Rangarajan D. Survival analysis of patients on maintenance hemodialysis. Indian J Nephrol 2014; 24: 206–213 [DOI] [PMC free article] [PubMed] [Google Scholar]
- 13.Sankarasubbaiyan S, Rajkumar A, Tangalvadi TA et al. Challenges and limitations of maintenance hemodialysis in urban South India. Hemodial Int 2007; 11: 485–491 [DOI] [PubMed] [Google Scholar]
- 14.United States Renal Data System. 2014 annual data report: Epidemiology of kidney disease in the United States. Bethesda, MD: National Institutes of Health, National Institute of Diabetes and Digestive and Kidney Diseases, 2014 [Google Scholar]
- 15.Racki S, Zaputović L, Vujicić B et al. Comparison of survival between diabetic and non-diabetic patients on maintenance hemodialysis: a single-centre experience. Diabetes Res Clin Pract 2007; 75: 169–175 [DOI] [PubMed] [Google Scholar]
- 16.Lewis J. Treating diabetic nephropathy: unfinished success is not failure. Clin J Am Soc Nephrol 2007; 2: 407–409 [DOI] [PubMed] [Google Scholar]
- 17.Nagpal J, Bhartia A. Quality of diabetes care in the middle- and high-income group populace: the Delhi Diabetes Community (DEDICOM) survey. Diabetes Care 2006; 29: 2341–2348 [DOI] [PubMed] [Google Scholar]
- 18.Hughes D, Manns B. Patient compliance with drug therapy for diabetic nephropathy. CMAJ 2000; 162: 1553–1554 [PMC free article] [PubMed] [Google Scholar]
- 19.Patel A, MacMahon S, Chalmers J et al. Intensive blood glucose control and vascular outcomes in patients with type 2 diabetes. N Engl J Med 2008; 358: 2560–2572 [DOI] [PubMed] [Google Scholar]
- 20.[No authors listed] Intensive blood-glucose control with sulphonylureas or insulin compared with conventional treatment and risk of complications in patients with type 2 diabetes (UKPDS 33). UK Prospective Diabetes Study (UKPDS) Group. Lancet 1998; 352: 837–853 [PubMed] [Google Scholar]
- 21.Abraham G, Varsha P, Mathew M et al. Malnutrition and nutritional therapy of chronic kidney disease in developing countries: the Asian perspective. Adv Ren Replace Ther 2003; 10: 213–221 [DOI] [PubMed] [Google Scholar]
- 22.Kaysen GA, Chertow GM, Adhikarla R et al. Inflammation and dietary protein intake exert competing effects on serum albumin and creatinine in hemodialysis patients. Kidney Int 2001; 60: 333–340 [DOI] [PubMed] [Google Scholar]
- 23.Global Burden of Disease Study 2013 Collaborators. Global, regional, and national incidence, prevalence, and years lived with disability for 301 acute and chronic diseases and injuries in 188 countries, 1990–2013: a systematic analysis for the Global Burden of Disease Study 2013. Lancet 2015; 386: 743–800 [DOI] [PMC free article] [PubMed] [Google Scholar]