Abstract
Insulin resistance plays a primary role in the development of type 2 diabetes and may be related to alterations in fat metabolism. Recent studies have suggested that local accumulation of fat metabolites inside skeletal muscle may activate a serine kinase cascade involving protein kinase C–θ (PKC-θ), leading to defects in insulin signaling and glucose transport in skeletal muscle. To test this hypothesis, we examined whether mice with inactivation of PKC-θ are protected from fat-induced insulin resistance in skeletal muscle. Skeletal muscle and hepatic insulin action as assessed during hyperinsulinemic-euglycemic clamps did not differ between WT and PKC-θ KO mice following saline infusion. A 5-hour lipid infusion decreased insulin-stimulated skeletal muscle glucose uptake in the WT mice that was associated with 40–50% decreases in insulin-stimulated tyrosine phosphorylation of insulin receptor substrate–1 (IRS-1) and IRS-1–associated PI3K activity. In contrast, PKC-θ inactivation prevented fat-induced defects in insulin signaling and glucose transport in skeletal muscle. In conclusion, our findings demonstrate that PKC-θ is a crucial component mediating fat-induced insulin resistance in skeletal muscle and suggest that PKC-θ is a potential therapeutic target for the treatment of type 2 diabetes.
Introduction
Skeletal muscle insulin resistance plays a primary role in the development of type 2 diabetes, the most common metabolic disease in the world (1, 2), and may be related to alterations in fat metabolism (3, 4). Previous studies have shown that local accumulation of fat metabolites inside skeletal muscle may activate a serine kinase cascade, involving serine phosphorylation of insulin receptor substrate–1 (IRS-1), leading to defects in insulin-mediated IRS-1–associated PI3K and glucose transport in skeletal muscle (5–7). The causal relationship between intramuscular fat and insulin resistance was further demonstrated in a recent study in which mice with inactivation of fatty acid transport protein 1 were protected from fat-induced accumulation of fat metabolites and insulin resistance in skeletal muscle (8). Additionally, we have shown that skeletal muscle insulin resistance mediated by a 5-hour lipid infusion was associated with increases in intramuscular fat metabolites (i.e., fatty acyl-CoA, diacylglycerol) and protein kinase C–θ (PKC-θ) activity, suggesting an important role for PKC-θ in mediating fat-induced insulin resistance in skeletal muscle (9). However, a recent study in transgenic mice with muscle-specific expression of a dominant-negative PKC-θ has shown age- and obesity-associated glucose intolerance (10). These data challenge the notion that PKC-θ plays an important role in fatty acid–mediated insulin resistance and suggest that it may even have a protective effect. To definitively examine the role of PKC-θ in the development of fat-induced insulin resistance in skeletal muscle, we performed hyperinsulinemic-euglycemic clamp studies in the homozygous PKC-θ null mice and WT littermates following a 5-hour lipid-heparin infusion. The advantage of this approach over other chronic models of insulin resistance is that fat-induced insulin resistance in skeletal muscle develops acutely, avoiding other confounding variables (e.g., obesity).
Results
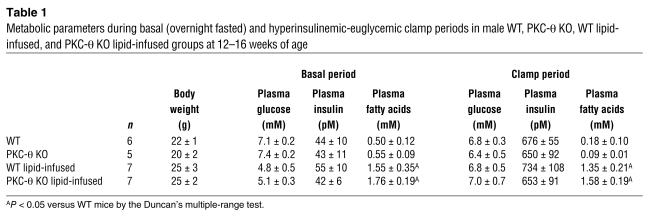
The basal (overnight-fasted) metabolic parameters (i.e., body weight, plasma glucose, insulin, fatty acids) of the WT and PKC-θ KO mice were similar, indicating that whole-body homozygous deletion of PKC-θ did not affect body weight or glucose homeostasis (Table 1). Plasma concentrations of fatty acids were similarly increased following a 5-hour lipid infusion in the WT and PKC-θ KO mice as compared with the saline-infused WT mice (controls) (Table 1). During the hyperinsulinemic-euglycemic clamps, plasma insulin concentration was raised to about 600 pM, while the plasma glucose concentration was maintained at about 6 mM by a variable infusion of glucose in all groups (Table 1). Plasma fatty acid concentrations were increased by 3-fold following a 5-hour lipid infusion and remained elevated during clamps in both lipid-infused groups as compared with the saline-infused WT and PKC-θ KO mice (Table 1).
Table 1.
Metabolic parameters during basal (overnight fasted) and hyperinsulinemic-euglycemic clamp periods in male WT, PKC-θ KO, WT lipid-infused, and PKC-θ KO lipid-infused groups at 12_16 weeks of age
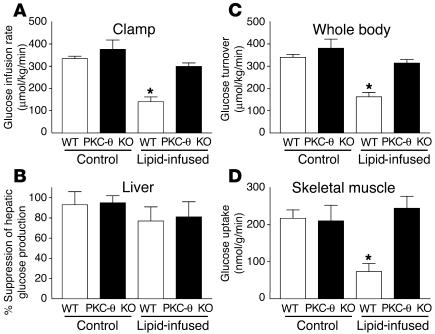
The glucose infusion rate required to maintain euglycemia increased rapidly in the WT and PKC-θ KO mice and reached a steady state within 90 minutes. None of the metabolic parameters during clamps differed between the WT mice and PKC-θ KO mice following saline infusion. Lipid infusion caused a markedly blunted insulin response during the clamps in the WT mice, as reflected by a 60% decrease in steady-state glucose infusion rate (140 ± 22 versus 334 ± 11 μmol/kg/min in the controls; P < 0.005) (Figure 1A). In contrast, the steady-state glucose infusion rate was not altered by lipid administration in the PKC-θ KO mice (299 ± 16 μmol/kg/min). Basal hepatic glucose production (HGP) and insulin-mediated suppression of HGP were not altered by either PKC-θ deletion or lipid infusion (Figure 1B).
Figure 1.
Tissue-specific insulin action in WT (white bars) and PKC-θ KO (black bars) mice with saline or lipid infusion. (A) Steady-state glucose infusion rate, obtained from averaged rates of 90_120 minutes of hyperinsulinemic-euglycemic clamps. (B) Insulin-mediated percentage suppression of basal hepatic glucose production. (C) Insulin-stimulated whole-body glucose turnover in vivo. (D) Insulin-stimulated skeletal muscle (gastrocnemius) glucose uptake in vivo. Values are mean ± SE for five to seven experiments. *P < 0.05 versus WT mice (control).
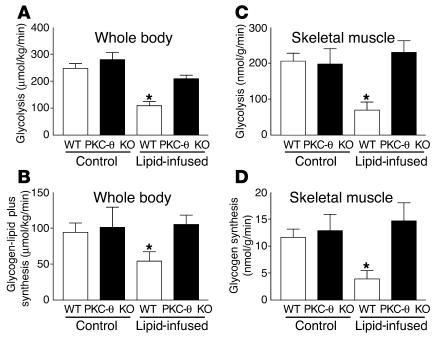
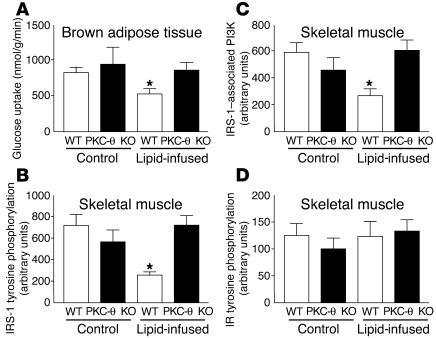
Lipid infusion decreased insulin-stimulated whole-body glucose turnover by about 50% in the WT mice, and this decrease was predominantly accounted for by an approximately 70% decrease in insulin-stimulated glucose uptake in skeletal muscle (gastrocnemius) (Figure 1, C and D). In contrast, lipid infusion did not affect insulin-stimulated whole-body glucose turnover or skeletal muscle glucose uptake in the PKC-θ KO mice (Figure 1, C and D). Insulin-stimulated whole-body glycolysis and glycogen plus lipid synthesis were reduced by about 40–60% upon lipid administration in the WT mice (Figure 2, A and B). In contrast, lipid infusion did not affect insulin-stimulated whole-body glucose metabolic flux in the PKC-θ KO mice (Figure 2, A and B). Similar to the pattern of fat-induced changes observed in the whole-body glucose metabolism, lipid infusion decreased insulin-stimulated glycolysis and glycogen synthesis in skeletal muscle by about 70% (for both) in the WT mice (Figure 2, C and D). Glucose transport is rate controlling for glucose utilization in skeletal muscle, and decreases in insulin-stimulated muscle glucose uptake may account for the parallel decreases in glycolysis and glycogen synthesis with the lipid infusion in the WT mice (11, 12). In contrast, these defects in insulin-stimulated skeletal muscle glucose metabolism were prevented in the PKC-θ KO mice (Figure 2, C and D). These findings indicate that PKC-θ inactivation prevented fat-induced whole-body insulin resistance that was mostly attributed to its protective role against fat-induced defects in insulin-stimulated glucose metabolism in skeletal muscle. Intracellular fatty acyl-CoA levels in skeletal muscle (quadriceps) were not different between the WT and PKC-θ KO mice following lipid infusion (13.2 ± 1.6 and 15.5 ± 1.8 nmol/g, respectively). Furthermore, insulin-stimulated glucose uptake in white adipose tissue was not altered by lipid infusion in the WT and PKC-θ KO mice (data not shown), whereas insulin-stimulated glucose uptake into brown adipose tissue showed a similar pattern of changes to that of skeletal muscle glucose uptake (Figure 3A).
Figure 2.
Insulin-stimulated whole-body and skeletal muscle (gastrocnemius) glucose metabolic flux in WT (white bars) and PKC-θ KO (black bars) mice with saline or lipid infusion. (A) Insulin-stimulated whole-body glycolysis in vivo. (B) Insulin-stimulated whole-body glycogen plus lipid synthesis in vivo. (C) Insulin-stimulated skeletal muscle glycolysis in vivo. (D) Insulin-stimulated skeletal muscle glycogen synthesis in vivo. Values are means ± SE for five to seven experiments. *P < 0.05 versus WT mice (control).
Figure 3.
Skeletal muscle (gastrocnemius) insulin signaling and glucose uptake in brown adipose tissue in WT (white bars) and PKC-θ KO (black bars) mice with saline or lipid infusion. (A) Insulin-stimulated glucose uptake in brown adipose tissue. (B) Insulin-stimulated tyrosine phosphorylation of IRS-1. (C) Insulin-stimulated IRS-1_associated PI3K activity. (D) Insulin-stimulated tyrosine phosphorylation of insulin receptor (IR). Values are means ± SE for five to seven experiments. *P < 0.05 versus WT mice (control).
Tyrosine phosphorylation of IRS-1 and subsequent activation of IRS-1–associated PI3K are important intracellular events of insulin signal transduction in skeletal muscle leading to increased activity of both glucose transport and glycogen synthase (13–15). Skeletal muscle insulin resistance induced by lipid infusion was associated with a 50% decrease in insulin-stimulated tyrosine phosphorylation of IRS-1 and a 40% decrease in insulin-mediated IRS-1–associated PI3K in the skeletal muscle of WT mice (Figure 3, B and C). In contrast, PKC-θ inactivation prevented lipid-induced defects in insulin-stimulated tyrosine phosphorylation of IRS-1 and IRS-1–associated PI3K in skeletal muscle (Figure 3, B and C). These findings suggest that the fat-induced defects in skeletal muscle insulin action may be secondary to the observed defects in skeletal muscle insulin signaling associated with activation of PKC-θ in the WT mice. Thus, the protective role of PKC-θ inactivation against the fat-induced defects in insulin action may also be secondary to that in skeletal muscle insulin signaling. Insulin-stimulated tyrosine phosphorylation of the skeletal muscle insulin receptor was not altered with the lipid infusion in the WT or PKC-θ KO mice (Figure 3D). This finding suggests that the fat-induced defect in muscle insulin signaling in the WT mice was not due to an alteration in plasma membrane or membrane-associated insulin receptors (16). It further suggests that the mechanism of blunted insulin signaling with the lipid infusion or high-fat feeding occurs downstream of the insulin receptor at the level of IRS-1.
Discussion
Although numerous studies have implicated PKC isoforms in the development of insulin resistance (5–9, 17–21), the role of any or all of these PKC isoforms in the development of insulin resistance is unclear in skeletal muscle, a major insulin-responsive organ (22). Recently, we have shown that increased intramuscular concentrations of fatty acyl-CoA and diacylglycerol in mice with muscle-specific overexpression of lipoprotein lipase were associated with skeletal muscle insulin resistance (5). Moreover, we and others have reported that a 5-hour lipid infusion increased intramuscular long-chain fatty acyl-CoA contents, which was associated with activation of PKC-θ and insulin resistance (6, 9, 18). Since PKC-θ is a serine kinase, its activation may lead to increased serine phosphorylation of IRS-1 (23). This may in turn interfere with IRS-1 tyrosine phosphorylation by the insulin receptor, as occurs upon treatment with TNF-α and okadaic acid, leading to decreased activation of PI3K (24, 25). Consistent with this notion, Griffin et al. (6) have also shown that activation of PKC-θ was associated with decreased tyrosine phosphorylation of IRS-1 in skeletal muscle. Thus, activation of PKC-θ by intracellular fatty acid–derived metabolites due to increased delivery of fatty acids into skeletal muscle may explain the defect in insulin-mediated IRS-1–associated PI3K and glucose transport in skeletal muscle following lipid infusion.
To definitively examine the role of PKC-θ in mediating fatty acid–induced insulin resistance in skeletal muscle, we performed hyperinsulinemic-euglycemic clamp studies in the PKC-θ KO mice and WT littermates following a 5-hour lipid-heparin infusion. Our results demonstrate that mice lacking PKC-θ were protected against fat-induced defects in skeletal muscle insulin signaling and action, further supporting the role of PKC-θ in mediating fatty acid–induced insulin resistance in skeletal muscle. Alternatively, other atypical PKC isoforms (e.g., PKC-ε) have been implicated in the development of insulin resistance (26), and alteration in other PKC isoforms may also contribute to our observations in the PKC-θ KO mice. Since our measurement of PKC-ε expression in the skeletal muscle of PKC-θ KO mice was not altered (data not shown), it is unlikely that other PKC isoforms contribute to any great extent to the protective effect against fat-induced insulin resistance in the PKC-θ KO mice.
Our findings are inconsistent with a recent study in which transgenic mice with muscle-specific expression of dominant-negative PKC-θ showed age-associated increases in adiposity, fasting and fed insulin levels, blunted results of glucose and insulin tolerance tests, and reduced insulin signaling in skeletal muscle (10). There are several potential explanations for this discrepancy: dominant-negative PKC-θ mice developed obesity, hyperinsulinemia, and glucose intolerance after 6–7 months of age (10). In contrast, our studies were conducted in the PKC-θ KO mice at 3–4 months of age, at which time their body weights as well as plasma glucose and insulin levels did not differ from those of the WT littermates. Thus, it is uncertain whether reduced glucose tolerance and skeletal muscle insulin signaling in the dominant-negative PKC-θ mice may be secondary to the obesity and may not be directly due to muscle-specific deletion of PKC-θ. Our approach of using acute lipid infusion to induce fatty acid–mediated insulin resistance avoided such confounding variables as obesity. Additionally, the discrepancy may be due to the difference between the deletion of PKC-θ versus dominant-negative expression of PKC-θ. Moreover, glucose intolerance in the dominant-negative PKC-θ mice may be partly attributed to altered hepatic glucose metabolism that may be associated with obesity, age, or both.
In conclusion, we have shown that an acute lipid challenge induced skeletal muscle insulin resistance by decreasing insulin-mediated IRS-1–associated PI3K and glucose uptake in skeletal muscle, and that PKC-θ inactivation protected against fat’s detrimental effect on insulin signaling and action in skeletal muscle. Our findings demonstrate that PKC-θ is a crucial component mediating fat-induced insulin resistance in skeletal muscle and suggest that PKC-θ is a potential therapeutic target for the treatment of type 2 diabetes.
Methods
Animals and surgery.
Male PKC-θ KO mice (generated on the C57BL/6J background strain, which was identical to the WT mice) and WT (C57BL/6J mice) littermates weighing about 24 g (12–16 weeks of age) were studied to examine the effects of lipid infusion on insulin action and signaling. To generate PKC-θ KO mice, the gene encoding the PKC-θ was inactivated by homologous recombination in embryonic stem cells by replacing the exon encoding the ATP-binding site of the kinase domain (amino acid residues 396–451) with the neomycin resistance gene, and positive clones were used to generate chimeric founder mice by microinjection into C57BL/6J blastocysts (27).
At least 4 days before hyperinsulinemic-euglycemic clamp experiments, mice were anesthetized with an intraperitoneal injection of ketamine (100 mg/kg body weight) and xylazine (10 mg/kg body weight), and an indwelling catheter was inserted in the left internal jugular vein (28). All procedures were approved by the Yale University Animal Care and Use Committee.
Hyperinsulinemic-euglycemic clamp in awake mice.
After the mice were fasted overnight, saline (WT and PKC-θ KO mice, n = 5–6) or lipid (5 ml/kg/h, Liposyn II, triglyceride emulsion, 20% wt/vol; Abbott Laboratories) and heparin (6 U/h; WT lipid and PKC-θ KO lipid groups, n = 7 for both) were infused for 5 hours (preinfusion period) to raise plasma fatty acid concentrations in the latter groups. A blood sample (80 μl) was collected at the end of the 5-hour lipid infusion period for measurement of basal concentrations of glucose, insulin, and fatty acids. HPLC-purified [3-3H]glucose (0.05 μCi/min; PerkinElmer Inc.) was infused during the 5-hour preinfusion period for saline- and lipid-infused groups to estimate the rate of basal hepatic glucose production. A 120-minute hyperinsulinemic-euglycemic clamp was conducted with a prime-continuous infusion of human insulin (Humulin; Eli Lilly and Co.) at a rate of 15 pmol/kg/min to raise plasma insulin concentration to within a physiological range (about 650 pM) (28). Blood samples (20 μl) were collected at 20-minute intervals for the immediate measurement of plasma glucose concentration, and 20% glucose was infused at variable rates to maintain plasma glucose at basal concentrations. Insulin-stimulated whole-body glucose turnover and metabolism were estimated using a prime-continuous infusion of [3-3H]glucose (10 μCi bolus, 0.1 μCi/min) throughout the clamps (28). To estimate insulin-stimulated glucose uptake in individual tissues, 2-deoxy-D-[1-14C]glucose (2-[14C]DG; PerkinElmer Inc.) was administered as a bolus (10 μCi) at 75 minutes after the start of the clamps. Blood samples (20 μl) were taken at 80, 85, 90, 100, 110, and 120 minutes after the start of the clamps for the determination of plasma [3H]glucose, 3H2O, and 2-[14C]DG concentrations. Additional blood samples (40 μl) were collected at the end of the clamps for measurement of plasma insulin and fatty acid concentrations. At the end of the clamp experiments, mice were anesthetized with sodium pentobarbital injection, and tissues were taken for biochemical analysis (28).
Glucose metabolism analysis and calculation.
Plasma glucose, insulin, and fatty acid concentrations were measured as previously described (28). Plasma concentrations of [3-3H]glucose, 2-[14C]DG, and 3H2O were determined as previously described (28). The radioactivity of 3H in tissue glycogen was determined by digesting tissue samples in KOH and precipitating glycogen with ethanol. For the determination of tissue 2-[14C]DG-6-phosphate (2-[14C]DG-6-P) content, tissue samples were homogenized, and the supernatants were subjected to an ion-exchange column to separate 2-[14C]DG-6-P from 2-[14C]DG. The intramuscular levels of fatty acyl-CoA were measured using liquid chromatography–tandem mass spectrometry. Rates of basal hepatic glucose production and insulin-stimulated whole-body glucose turnover were determined as the ratio of the [3H]glucose infusion rate (disintegrations per minute [dpm]/min) to the specific activity of plasma glucose (dpm/μmol) at the end of the basal period and during the final 30 minutes of the clamps, respectively. HGP during the hyperinsulinemic-euglycemic clamps was determined by subtracting the glucose infusion rate from the whole-body glucose turnover. Whole-body glycolysis and glycogen plus lipid synthesis were estimated as previously described (28). Glucose uptake in individual tissues was calculated from the plasma 2-[14C]DG profile, which was fitted with a double exponential curve using MLAB (Civilized Software Inc.) and tissue 2-[14C]DG-6-P content. Skeletal muscle glycogen synthesis and glycolysis were estimated as previously described (28).
Insulin signaling.
Tyrosine phosphorylation of IRS-1 and IRS-1–associated PI3K activity in skeletal muscle were measured by immunoprecipitating IRS-1 using antibodies to IRS-1 (provided by Morris White, Joslin Diabetes Center, Harvard Medical School, Boston, Massachusetts, USA) and assessing the incorporation of 32P into PI to yield phosphatidylinositol-3-monophosphate. Tyrosine phosphorylation of insulin receptor in skeletal muscle was measured using anti–phosphotyrosine antibody (Upstate Biotechnology Inc.).
Acknowledgments
Part of this study was conducted at the Yale Mouse Metabolic Phenotyping Center and was supported by grants from the United States Public Health Service (U24 DK-59635, to G.I. Shulman and J.K. Kim). This study was supported by grants from the American Diabetes Association (7-01-JF-05, to J.K. Kim) and the United States Public Health Service (R01 DK-40936 and P30 DK-45735, to G.I. Shulman) as well as the Distinguished Clinical Scientist Award of the American Diabetes Association (to G.I. Shulman). G.I. Shulman and D.R. Littman are investigators of the Howard Hughes Medical Institute. We are grateful to Aida Groszmann for technical assistance.
Footnotes
Nonstandard abbreviations used: 2-[14C]DG, 2-deoxy-d-[1-14C]glucose; 2-[14C]DG-6-P, 2-[14C]DG-6-phosphate; dpm, disintegrations per minute; HGP, hepatic glucose production; IRS-1, insulin receptor substrate–1; PKC-θ, protein kinase C–θ.
Conflict of interest: The authors have declared that no conflict of interest exists.
References
- 1.Shaw JE, Zimmet PZ, McCarty D, Courten MD. Type 2 diabetes worldwide according to the new classification and criteria. Diabetes Care. 2000;23(Suppl. 2):B5–B10. [PubMed] [Google Scholar]
- 2.Warram JH, Martin BC, Krolewski AS, Soeldner JS, Kahn CR. Slow glucose removal rate and hyperinsulinemia precede the development of type II diabetes in the offspring of diabetic patients. Ann. Intern. Med. 1990;113:909–915. doi: 10.7326/0003-4819-113-12-909. [DOI] [PubMed] [Google Scholar]
- 3.McGarry JD. What if Minkowski had been ageusic? An alternative angle on diabetes. Science. 1992;258:766–770. doi: 10.1126/science.1439783. [DOI] [PubMed] [Google Scholar]
- 4.Boden G, Shulman GI. Free fatty acids in obesity and type 2 diabetes: defining their role in the development of insulin resistance and beta-cell dysfunction. Eur. J. Clin. Invest. 2002;32(Suppl. 3):14–23. doi: 10.1046/j.1365-2362.32.s3.3.x. [DOI] [PubMed] [Google Scholar]
- 5.Kim JK, et al. Tissue-specific overexpres-sion of lipoprotein lipase causes tissue-specific insulin resistance. Proc. Natl. Acad. Sci. U. S. A. 2001;98:7522–7527. doi: 10.1073/pnas.121164498. [DOI] [PMC free article] [PubMed] [Google Scholar]
- 6.Griffin ME, et al. Free fatty acid–induced insulin resistance is associated with activation of protein kinase C θ and alterations in the insulin signaling cascade. Diabetes. 1999;48:1270–1274. doi: 10.2337/diabetes.48.6.1270. [DOI] [PubMed] [Google Scholar]
- 7.Schmitz-Peiffer C, et al. Alterations in the expression and cellular localization of protein kinase C isozymes epsilon and theta are associated with insulin resistance in skeletal muscle of the high-fat-fed rats. Diabetes. 1997;46:169–178. doi: 10.2337/diab.46.2.169. [DOI] [PubMed] [Google Scholar]
- 8.Kim JK, et al. Inactivation of fatty acid transport protein 1 prevents fat-induced insulin resistance in skeletal muscle. J. Clin. Invest. 2004;113:756–763. doi:10.1172/JCI200418917. doi: 10.1172/JCI18917. [DOI] [PMC free article] [PubMed] [Google Scholar]
- 9.Yu C, et al. Mechanism by which fatty acids inhibit insulin activation of insulin receptor substrate-1 (IRS-1)-associated phosphatidylinositol 3-kinase activity in muscle. J. Biol. Chem. 2002;277:50230–50236. doi: 10.1074/jbc.M200958200. [DOI] [PubMed] [Google Scholar]
- 10.Serra C, et al. Transgenic mice with dominant negative PKC-theta in skeletal muscle: a new model of insulin resistance and obesity. J. Cell. Physiol. 2003;196:89–97. doi: 10.1002/jcp.10278. [DOI] [PubMed] [Google Scholar]
- 11.Cline GW, et al. Impaired glucose transport as a cause of decreased insulin-stimulated muscle glycogen synthesis in type 2 diabetes. N. Engl. J. Med. 1999;341:240–246. doi: 10.1056/NEJM199907223410404. [DOI] [PubMed] [Google Scholar]
- 12.Ren JM, et al. Evidence from transgenic mice that glucose transport is rate-limiting for glycogen deposition and glycolysis in skeletal muscle. J. Biol. Chem. 1993;268:16113–16115. [PubMed] [Google Scholar]
- 13.Yamauchi T, et al. Insulin signaling and insulin actions in the muscles and livers of insulin-resistant, insulin receptor substrate 1-deficient mice. Mol. Cell. Biol. 1996;16:3074–3084. doi: 10.1128/mcb.16.6.3074. [DOI] [PMC free article] [PubMed] [Google Scholar]
- 14.Previs SF, Withers DJ, Ren J-M, White MF, Shulman GI. Contrasting effects of IRS-1 versus IRS-2 gene disruption on carbohydrate and lipid metabolism in vivo. J. Biol. Chem. 2000;275:38990–38994. doi: 10.1074/jbc.M006490200. [DOI] [PubMed] [Google Scholar]
- 15.Kahn CR. Insulin action, diabetogenes, and the cause of type II diabetes. Diabetes. 1994;43:1066–1084. doi: 10.2337/diab.43.8.1066. [DOI] [PubMed] [Google Scholar]
- 16.Watarai T, et al. Alteration of insulin-receptor kinase activity by high fat feeding. Diabetes. 1988;37:1397–1404. doi: 10.2337/diab.37.10.1397. [DOI] [PubMed] [Google Scholar]
- 17.Shulman GI. Cellular mechanisms of insulin resistance. J. Clin. Invest. 2000;106:171–176. doi: 10.1172/JCI10583. [DOI] [PMC free article] [PubMed] [Google Scholar]
- 18.Chalkley SM, Hettiarachchi M, Chisholm DJ, Kraegen EW. Five-hour fatty acid elevation increases muscle lipids and impairs glycogen synthesis in the rat. Metabolism. 1998;47:1121–1126. doi: 10.1016/s0026-0495(98)90287-6. [DOI] [PubMed] [Google Scholar]
- 19.Itani SI, Ruderman NB, Schmieder F, Boden G. Lipid-induced insulin resistance in human skeletal muscle is associated with changes in diacylglycerol, protein kinase C, and IkappaB-alpha. Diabetes. 2002;51:2005–2011. doi: 10.2337/diabetes.51.7.2005. [DOI] [PubMed] [Google Scholar]
- 20.Shmueli E, Alberti KG, Record CO. Diacylglycerol/protein kinase C signaling: a mechanism for insulin resistance? J. Intern. Med. 1993;234:397–400. doi: 10.1111/j.1365-2796.1993.tb00761.x. [DOI] [PubMed] [Google Scholar]
- 21.Avignon A, et al. Chronic activation of protein kinase C in soleus muscles and other tissues of insulin-resistant type II diabetic Goto-Kakizaki (GK), obese/aged, and obese/Zucker rats. Diabetes. 1996;45:1396–1404. doi: 10.2337/diab.45.10.1396. [DOI] [PubMed] [Google Scholar]
- 22.Shulman GI, et al. Quantitation of muscle glycogen synthesis in normal subjects and subjects with non-insulin-dependent diabetes by 13C nuclear magnetic resonance spectroscopy. N. Engl. J. Med. 1990;322:223–228. doi: 10.1056/NEJM199001253220403. [DOI] [PubMed] [Google Scholar]
- 23.De Fea K, Roth RA. Protein kinase C modulation of insulin receptor substrate-1 tyrosine phosphorylation requires serine 612. Biochemistry. 1997;36:12939–12947. doi: 10.1021/bi971157f. [DOI] [PubMed] [Google Scholar]
- 24.Rui L, et al. Insulin/IGF-1 and TNF-α stimulate phosphorylation of IRS-1 at inhibitory Ser307 via distinct pathways. J. Clin. Invest. 2001;107:181–189. doi: 10.1172/JCI10934. [DOI] [PMC free article] [PubMed] [Google Scholar]
- 25.Tanti J-F, Gremeaux T, Obberghen EV, Marchand-Brustel YL. Serine/threonine phosphorylation of insulin receptor substrate 1 modulates insulin receptor signaling. J. Biol. Chem. 1994;269:6051–6057. [PubMed] [Google Scholar]
- 26.Itani SI, Zhou Q, Pories WJ, MacDonald KG, Dohm GL. Involvement of protein kinase C in human skeletal muscle insulin resistance and obesity. Diabetes. 2000;49:1353–1358. doi: 10.2337/diabetes.49.8.1353. [DOI] [PubMed] [Google Scholar]
- 27.Sun Z, et al. PKC-theta is required for TCR-induced NF-kappaB activation in mature but not immature T lymphocytes. Nature. 2000;404:402–407. doi: 10.1038/35006090. [DOI] [PubMed] [Google Scholar]
- 28.Kim H-J, et al. Differential effects of interleukin-6 and -10 on skeletal muscle and liver insulin action in vivo. Diabetes. 2004;53:1060–1067. doi: 10.2337/diabetes.53.4.1060. [DOI] [PubMed] [Google Scholar]


