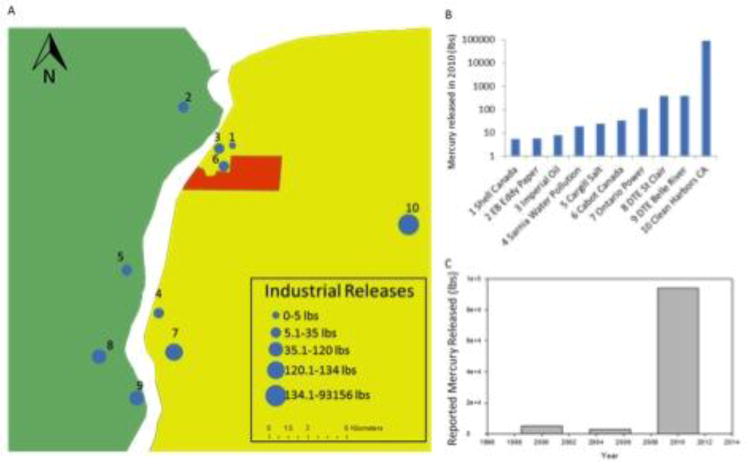
Figure 3. Mercury releases reported by facilities within “Chemical Valley”.
Data was obtained from Canada’s National Pollutant Release Inventory (NPRI) and the U.S. Toxics Release Inventory (TRI). (A) Map of facilities that reported releasing mercury within the ‘Chemical Valley’ region in the 2010 reporting year. Mercury releasing facilities are represented on the map by dots and are numbered to correspond with Panel B. Facilities with large dots representing those that released more mercury according to the legend. (B) Bar graph of mercury released (lbs) by the region’s top 10 facilities. (C) Total mercury releases within ‘Chemical Valley’ in the years 2000, 2005, and 2010 based on NPRI and TRI data.

