High-coverage whole-genome sequence studies have so far focused on a limited number1 of geographically restricted populations 2–5, or targeted at specific diseases, e.g. cancer6. Nevertheless, the availability of high-resolution genomic data has led to the development of new methodologies for inferring population history7–9 and refuelled the debate on the mutation rate in humans10.
Here we present the Estonian Biocentre human Genome Diversity Panel (EGDP), a dataset of 483 high-coverage human genomes from 148 populations worldwide, including 379 new genomes from 125 populations, which we group into Diversity and Selection Sets (ED1-2; SI1:1.1-7). We analyse this dataset to refine estimates of continent-wide patterns of heterozygosity, long- and short-distance gene flow, archaic admixture, and changes in effective population size through time. We find a genetic signature in present-day Papuans suggesting that at least 2% of their genome originates from an early and largely extinct expansion of anatomically modern humans (AMH) Out-of-Africa (xOoA). Together with evidence from the Western Asian fossil record11, and admixture between AMHs and Neanderthals predating the main Eurasian expansion12, our results contribute to the mounting evidence for the presence of AMH out of Africa earlier than 75kya. We also screen for signals of positive or balancing selection.
The paths taken by AMHs out of Africa (OoA) have been the subject of considerable debate over the past two decades. Fossil and archaeological evidence13,14, and craniometric studies15 of African and Asian populations, demonstrate that Homo sapiens was present outside of Africa ca. 120-70 kya11. However, this colonization has been viewed as a failed expansion OoA16 since genetic analyses of living populations have been consistent with a single OoA followed by serial founder events17.
Ancient DNA (aDNA) sequencing studies have found support for admixture between early Eurasians and at least two archaic human lineages18,19, and suggests modern human reached Eurasia at around 100kya12. In addition, aDNA from modern humans suggests population structuring and turnover, but little additional archaic admixture, in Eurasia over the last 35-45 thousand years20–22. Overall, these findings indicate that the majority of human genetic diversity outside Africa derives from a single dispersal event that was followed by admixture with archaic humans18,23.
We used ADMIXTURE to analyse the genetic structure in our Diversity Set (ED1). We further compared the individual-level haplotype similarity of our samples using fineSTRUCTURE (ED3). Despite small sample sizes, we inferred 106 genetically distinct populations forming 12 major regional clusters, corresponding well to the 148 self-identified population labels. This clustering forms the basis for the groupings used in the scans of natural selection. Similar genetic affinities are highlighted by plotting the outgroup f3 statistic9 in the form f3(X, Y; Yoruba), which here measures shared drift between a non-African population X and any modern or ancient population Y from Yoruba as an African outgroup (SI1:2.2.6, ED4).
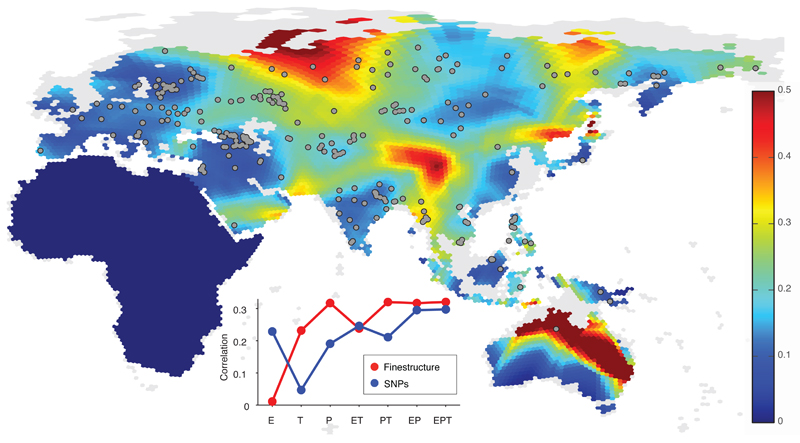
Our sampling allowed us to consider geographic features correlated with gene flow by spatially interpolating genetic similarity measures between pairs of populations (SI1:2.2.2). We considered several measures and report gradients of allele frequencies in Figure 1, which was compared to gene flow patterns from EEMS24 as a validation (ED5). Controlling for pairwise geographic distance, we find a correlation between these genetic gradients and geographic and climatic features such as precipitation and elevation (inset of Figure 1, SI1:2.2.2).
Figure 1. Genetic barriers across space.
Spatial visualisation of genetic barriers inferred from genome-wide genetic distances, quantified as the magnitude of the gradient of spatially interpolated allele frequencies (value denoted by colour bar; grey areas have been land during the last glacial maximum but are currently under water). Here we used a spatial kernel smoothing method based on the matrix of pairwise average heterozygosity a matlab script that plots the hexagons of the grid with a colour coding to represent gradients Inset: partial correlation between magnitude of genetic gradients and combinations of different geographic factors, elevation (E), temperature (T) and precipitation (P), for genetic gradients from fineSTRUCTURE (red) and allele frequencies (blue). This analysis (SI1:2.2.2 for details) shows that genetic differences within this region display some correlation with physical barriers such as mountain ranges, deserts, forests, and open water (such as the Wallace line).
We screened for evidence of selection by first focusing on loci that showed the highest allelic differentiation among groups (SI1:3). We then performed positive and purifying selection scans (Methods), and find some candidate loci that replicate previously known and functionally-supported findings (SI2:3.3.4-I, SI1:3.1, ED6; SI2:3.1-IV,VI). Additionally, we infer more purifying selection in Africans in genes involved in pigmentation (bootstrapping p value - bpv for RX/Y-scores <0.05) (ED6) and immune response against viruses (bpv<0.05), whilst further purifying selection was indicated on olfactory receptor genes in Asians (bpv p<0.05) (SI2:3.1.1-II). Our scans for ancient balancing selection found a significant enrichment (FDR <0.01) of antigen processing/presentation, antigen binding, and MHC and membrane component genes (SI1:3.2, SI2:3.3.2-I-III). The HLA (HLA-C)-associated gene (BTNL2) was the top highest scoring candidate in eight of 12 geographic regions for the HKA test (SI2:3.3.1-I). Our positive selection scans, variant-based analyses (SI1:3.2 and 3.2) and gene enrichment studies also suggest new candidate loci (SI1:3.4; SI2:3.5-I-VI), a subset of which is highlighted in Table SI2:3-I.
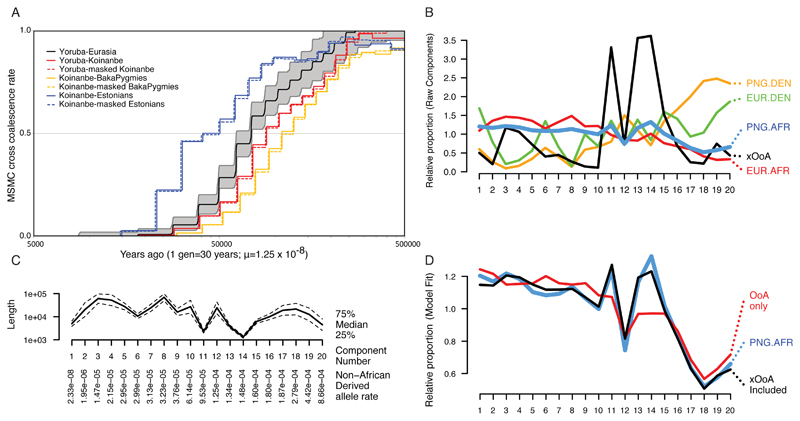
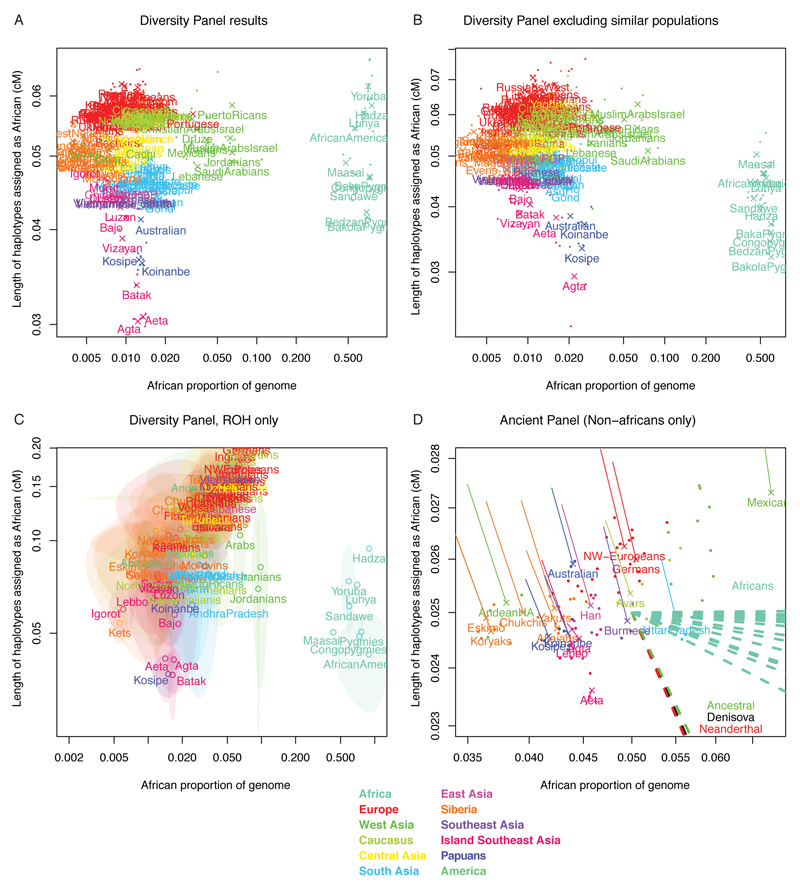
Using fineSTRUCTURE, we find in the genomes of Papuans and Philippine Negritos more short haplotypes assigned as African than seen in genomes for individuals from other non-African populations (ED7). This pattern remains after correcting for potential confounders such as phasing errors and sampling bias (SI1:2.2.1). These shorter shared haplotypes would be consistent with an older population split25. Indeed, the Papuan-Yoruban median genetic split time (using MSMC) of 90 kya predates the split of all mainland Eurasian populations from Yorubans at ~75 kya (SI2:2.2.3-I, ED4, Figure 2A). This result is robust to phasing artefacts (ED8, See Methods). Furthermore, the Papuan-Eurasian MSMC split time of ~40 kya is older than splits between West Eurasian and East Asian populations at ~30 kya (ED4). The Papuan split times from Yoruba and Eurasia are therefore incompatible with a simple bifurcating population tree model.
Figure 2. Evidence of an xOoA signature in the genomes of modern Papuans.
Panel A: MSMC split times plot. The Yoruba-Eurasia split curve shows the mean of all Eurasian genomes against one Yoruba genome. The grey area represents top and bottom 5% of runs. We chose a Koinanbe genome as representative of the Sahul populations. Panels B-D: Decomposition of Papuan haplotypes inferred as African by fineSTRUCTURE. Panel B: Semi-parametric decomposition of the joint distribution of haplotype lengths and non-African derived allele rate per SNP, showing the relative proportion of haplotypes in K=20 components of the distribution, ordered by non-African derived allele rate, relative to the overall proportion of haplotypes in each component. The four datasets produced by considering haplotypes inferred as (African/Denisova) in (Europeans/Papuans) are shown with our inferred "extra Out-of-Africa xOoA" component. Panel C: The properties of the components in terms of non-African derived allele rate, on which the components are ordered, and length.
Panel D: The reconstruction of haplotypes inferred as African in the genomes of Papuan individuals, using a mixture of all other data (red) and with the addition of the xOoA signature (black).
At least two main models could explain our estimates of older divergence dates for Sahul populations from Africa than mainland Eurasians in our sample: 1) Admixture in Sahul with a potentially un-sampled archaic human population that split from modern humans either before or at the same time as did Denisova and Neanderthal; or 2) Admixture in Sahul with a modern human population (xOoA) that left Africa after the split between modern humans and Neanderthals, but before the main expansion of modern humans in Eurasia (main OoA).
We consider support for these two non-mutually exclusive scenarios. Because the introgressing lineage has not been observed with aDNA, standard methods are limited in their ability to distinguish between these hypotheses. Furthermore we show (SI1:2.2.7) that single-site statistics, such as Patterson’s D 9,18 and sharing of non-African Alleles (nAAs), are inherently affected by confounding effects due to archaic introgression in non-African populations23. Our approach therefore relies on multiple lines of evidence using haplotype-based MSMC and fineSTRUCTURE comparisons (which we show should have power at this time scale26; SI2.2.13).
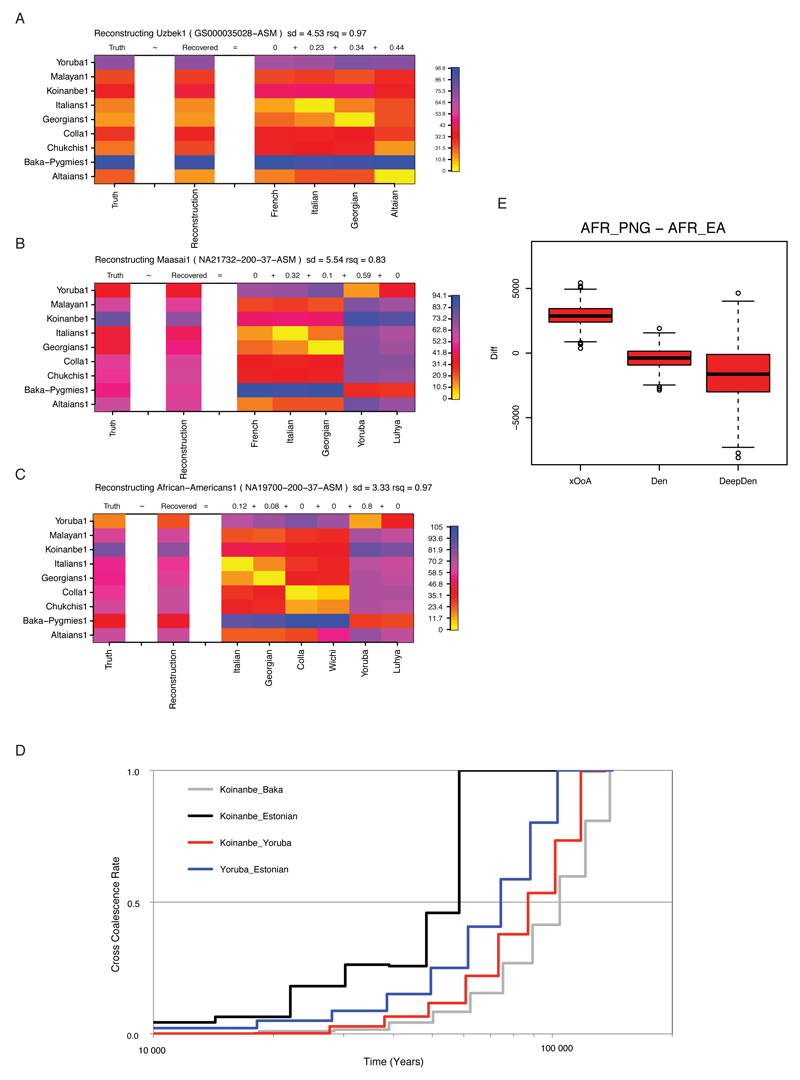
We located and masked putatively introgressed27 Denisova haplotypes from the genomes of Papuans, and evaluated phasing errors by symmetrically phasing Papuans and Eurasians genomes (Methods). Neither modification (Figure 3A, SI1:2.2.9, SI2:2.2.9-I) changed the estimated split time (based on MSMC) between Africans and Papuans (Methods, SI1:2.2.8, ED8, Table 2.2.8-I). MSMC dates behave approximately linearly under admixture (ED8), implying that the hypothesised lineage may have split from most Africans around 120 kya (SI1:2.2.4 and 2.2.8).
We compared the effect on the MSMC split times of a xOoA or a Denisova lineage in Papuans by extensive coalescent simulations (SI1:2.2.8). We could not simulate the large Papuan-African and Papuan-Eurasian split times inferred from the data, unless assuming an implausibly large contribution from a Denisova-like population. Furthermore, while the observed shift in the African-Papuan MSMC split curve can be qualitatively reproduced when including a 4% genomic component that diverged 120 kya from the main human lineage within Papuans, a similar quantity of Denisova admixture does not produce any significant effect (ED8). This favours a small presence of xOoA lineages rather than Denisova admixture alone as the likely cause of the observed deep African-Papuan split. We also show (Methods) that such a scenario is compatible with the observed mtDNA and Y chromosome lineages in Oceania, as also previously argued13,28.
We further tested our hypothesised xOoA model by analyzing haplotypes in the genomes of Papuans that show African ancestry not found in other Eurasian populations. We re-ran fineSTRUCTURE adding the Denisova, Altai Neanderthal and the Human Ancestral Genome sequences29 to a subset of the Diversity Set. FineSTRUCTURE infers haplotypes that have a most recent common ancestor (MRCA) with another individual. Papuan haplotypes assigned as African had, regardless, an elevated level of non-African derived alleles (i.e. nAAs fixed ancestral in Africans) compared to such haplotypes in Eurasians. They therefore have an older mean coalescence time with our African samples.
Due to the deep divergence between the sampled Denisova and the one introgressed into modern humans, it is possible that some archaic haplotypes have a MRCA with an African instead of Denisova and are assigned as “African”. We can resolve the coalescence time, and hence origin, of these haplotypes by their sequence similarity with modern Africans. To account for the archaic introgression we modelled these genomic segments as a mixture of haplotypes assigned a) as African or b) as Denisova in Eurasians and c) haplotypes assigned as Denisova in Papuans. These haplotypes are modelled (see Methods, ED9) in terms of the distribution of length and mutation rate measured as a density of non-African derived alleles. Since Eurasians (specifically Europeans) have not experienced Denisova admixture, this approach disentangles lineages that coalesce before the human/Denisova split from those that coalesce after.
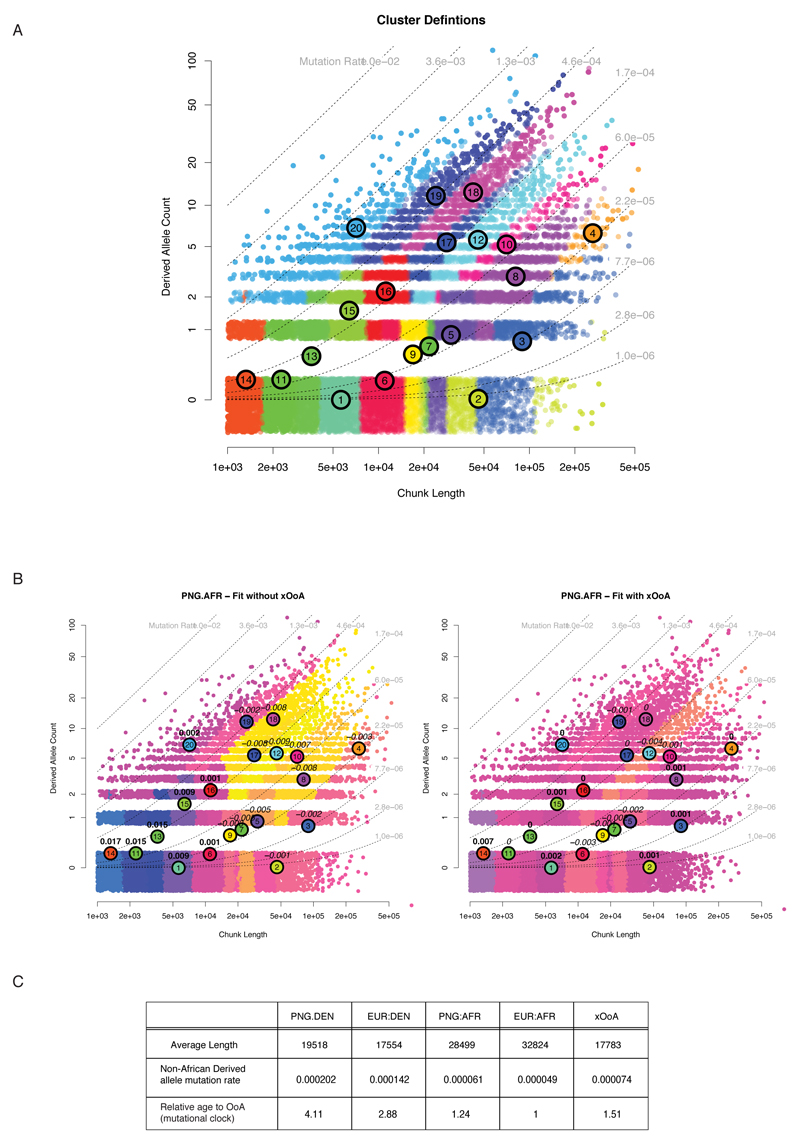
We found that the xOoA signature (Figure 2B-D; SI1:2.2.10) was necessary to account for the number of short haplotypes with “moderate” nAAs density in the data (i.e. proportion of non-African derived sites higher than that of Eurasian haplotypes assigned as African but significantly lower than that of those assigned Denisova in either Eurasians or Papuans). Consistent with our MSMC findings (SI1:2.2.4), xOoA haplotypes have an estimated MRCA 1.5 times older than the Eurasian haplotypes in Papuan genomes, while the Denisovan haplotypes in Papuans are 4 times older than the Eurasian haplotypes. Adding up the contributions across the genome (Methods) leads to a genome-wide estimate of 1.9% xOoA (95% CI 1.5-3.3) in Papuans, which we view as a lower bound.
Our results consistently point towards a contribution from a modern human source for derived29 alleles that are found in the genome sequence of Papuans but not in Africans. Possible confounders could involve a shorter generation time in Papuan and Philippine Negrito populations30, different recombination processes, or alternative demographic histories that have not been investigated here. We therefore strongly encourage the development of new model-based approaches that can investigate further the haplotype patterns described here.
In conclusion, our results suggest that while the genomes of modern Papuans derive primarily from the main expansion of modern humans out of Africa, we estimate that at least 2% of their genome sequence reflects an earlier, otherwise extinct, dispersal (ED10).
The inferred date of the xOoA split time (~120 kya) is consistent with fossil and archaeological evidence for an early expansion of Homo sapiens from Africa13,14. Furthermore, the recently identified modern human admixture into the Altai Neanderthal before 100 kya12 is consistent with a modern human presence outside Africa well before the main OoA split time ( ~75 kya). Further studies will confirm whether the Papuan genetic signature reported here and the one observed in Altai Neanderthals reflect the same xOoA human group, as well as clarify the timing and route followed during such an early expansion. The high similarity between Papuans and the Altai Neanderthal reported in ED1 may indeed reflect a shared xOoA component. Further studies are needed to explore this model and suggest that understanding human evolutionary history will require the recovery of aDNA from additional fossils, and further archaeological investigations in under-explored geographical regions.
Data availability
The newly sequenced genomes are part of the Estonian Biocentre human Genome Diversity Panel (EGDP) and were deposited in the ENA archive under accession number PRJEB12437 and are also freely available through the Estonian Biocentre website (www.ebc.ee/free_data).
Methods
Data Preparation
We analyse a set of genomes sequenced by the same technology (Complete Genomics Inc.) which results in minimal platform differences between batches of samples analysed by slight modifications of CG proprietary pipeline (ED2; SI 1.6). We see good concordance between CG sequence and Illumina genotyping array results for the same samples with minor reference bias in the latter data (ED2; SI 1.6). In the final dataset, we retained only one second (Australians, to make use of all the available samples)- and five third-degree relatives pairs (SI2:1.7-I). All genomes were annotated against the Ensembl GRCh37 database and compared to dbSNP Human Build 141 and Phase 1 of the 1000 Genomes Project dataset29 (SI1:1.1-6). We found 10,212,117 new SNPs, 401,911 of which were exonic. As expected from our sampling scheme, existing lists of variable sites have been extended mostly by the Siberian, South-East Asian and South Asian genomes, which contribute 89,836 (22.4%), 63,964 (15.9%) and 40,758 (10.1%) of the new exonic variants detected in this study.
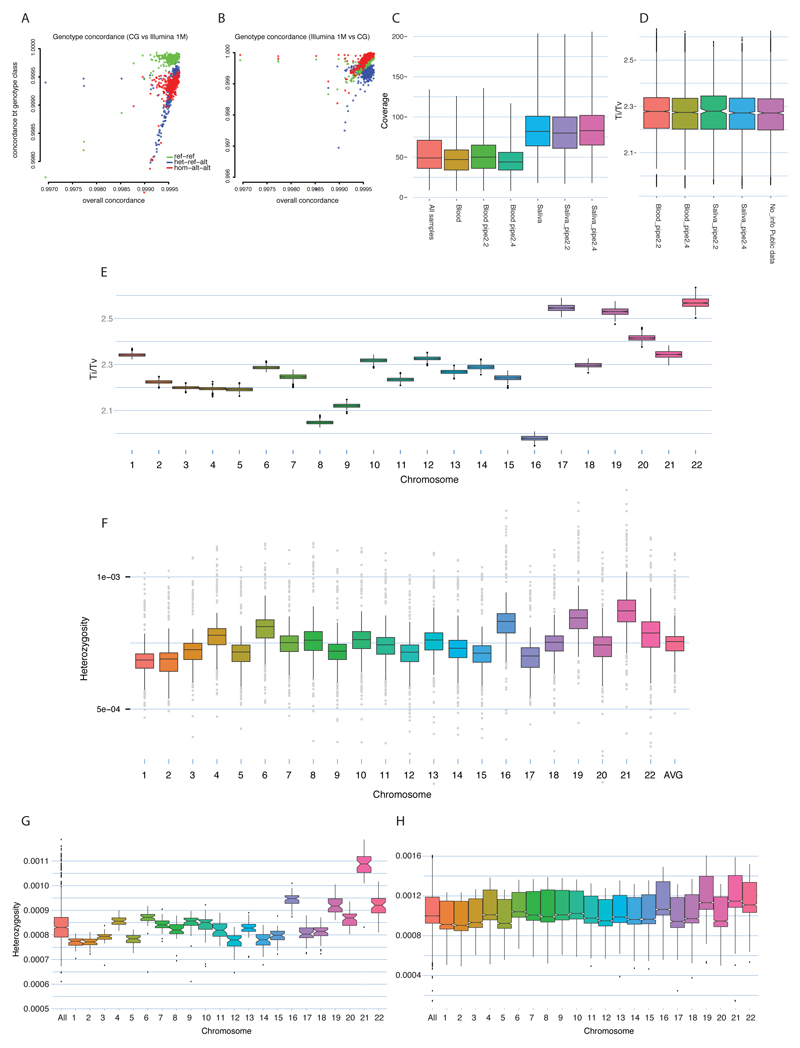
Compared to the genome-wide average, we see fewer heterozygous sites on chromosomes 1 and 2, and an excess on chromosomes 16, 19 and 21 (ED2). This pattern is independent of simple potential confounders, such as rough estimates of recombination activity and gene density (SI1:1.8), and mirrors the inter-chromosomal differences in divergence from chimpanzee31, suggesting large-scale differences in mutation rates among chromosomes. We confirmed this general pattern using 1000 Genomes Project data (SI1:1.8).
The “ancient genome diversity panel” consisted of 106 samples from the main Diversity panel along with Altai Neanderthal, Denisova and the Modern Human reference genome. Sites that are heterozygous in archaic humans were removed.
Geographic gradient analyses
We used a Gaussian kernel smoothing (based on the shortest distance on land to each sample) to interpolate genetic patterns across space. Averaging over all markers, we obtained an expression for the mean square gradient of allele frequencies in terms of the matrix of genetic distance between pairs of samples (SI1:2.2.2). This provides a simple way to identify spatial regions that contribute strongly to genetic differences between samples, and can be used, in principle, for any measure of genetic difference (for fineSTRUCTURE data, we used negative shared haplotype length as a measure of differentiation).
To quantify the link between the magnitude of genetic gradients (from fineSTRUCTURE and allele frequency data) and geographic factors, we fitted a generalised linear model to the sum of genetic magnitude gradients on the shortest paths between samples to elevation, minimum quarterly temperature, and annual precipitation summed in the same way, controlling for path length and spatial random effects (SI1:2.2.2), and calculated partial correlations between genetic gradient magnitudes and geographic factors.
Finestructure Analysis
FineSTRUCTURE32 was run as described in SI1:S2.2.1. Within the 106 genetically distinct genetic groups, labels were typically genetically homogeneous - 113 of the 148 population labels (76%) were assigned to only one ‘genetic cluster’. Similarly, genetic clusters were typically specific to a label, with 66 of the 106 ‘genetic clusters’ (62%) containing only one population label.
Correction for phasing errors
To check whether phasing errors could produce the shorter Papuan haplotypes, we focussed on regions of the genome that had an extended (>500Kb) run of homozygosity. We ran ChromoPainter for each individual on only these regions, meaning each individual was only painted where it had been perfectly phased. This did not change the qualitative features (SI1:2.2.1).
Removal of similar samples
Papuans are genetically distinct from other populations due to tens of thousands of years of isolation. We wanted to check whether the length of haplotypes assigned as African were biased by the inclusion of a large number of relatively homogeneous Eurasians with few Papuans. To do this we repeated the N=447 painting allowing only donors from dissimilar populations, including only individuals who donated <2% of a genome in the main painting. This did not change the qualitative haplotype length features (SI1:2.2.1).
Inclusion of ancient samples
We ran our smaller individual panel with (N=109) and without (N=106) ancient samples (Denisova, Neanderthal and ancestral human). This did not change the qualitative haplotype length features (SI1:2.2.1).
Selection Analyses
We investigated balancing, positive and purifying selection for a part of the dataset with larger group sizes which was defined as the Selection subset (SI2:3.1-I; SI2:3.2-I) using a wide range of window-based as well as variant-based approaches. Furthermore we investigated how these signals relate to shared demographic history. Where possible we contextualized our findings by integrating them with information from various functional databases. Detailed descriptions of all methods used are available in SI1:3.
MSMC, Denisova masking, simulations of alternative scenarios and assessment of phasing robustness
Genetic split times were initially calculated following the standard MSMC procedure8, and subsequently modified as follows. To estimate the effect of archaic admixture, putative Denisova haplotypes were identified in Papuans using a previously published method27 and masked from all the analysed genomes. Particularly, whether a putative archaic haplotype was found in heterozygous or homozygous state within the chosen Papuan genome, the “affected” locus was inserted into the MSMC mask files and, hence, removed from the analysis.
We note that a fraction of the Denisova and Neanderthal contributions to the Papuan genomes may be indistinguishable, due to the shared evolutionary history of these two archaic populations. As a result, some of the removed “Denisova” haplotypes may have actually entered the genome of Papuans through Neanderthal. Regardless of this, our exercise successfully shows that the MSMC split time estimates are not affected by the documented presence of archaic genomic component (whether coming entirely from Denisova or partially shared with Neanderthal).
We further excluded the role of Denisova admixture in explaining the deeper African-Papuan MSMC split times through coalescent simulations (using ms to generate 30 chromosomes of 5 Mbp each, and simulating each scenario 30 times). These showed that the addition of 4% Denisova lineages to the Papuan genomes does not change the MSMC results, while the addition of 4% xOoA lineages recreates the qualitative shift observed in the empirical data.
Phasing artefacts were also taken into account as putative confounders of the MSMC split time estimates. We re-run MSMC after re-phasing one Estonian, one Papuan and 20 West African and Pygmies genomes in a single experiment. By this way we ruled out potential artefacts stemming from the excess of Eurasian over Sahul samples during the phasing process. Both the archaic and phasing corrections yielded the same split time as of the standard MSMC runs.
Emulation of all pairwise MSMC split times
We confirmed that none of the other populations behaved as an outlier from those identified in the N=22 full pairwise analysis by estimating the MSMC split times between all pairs. We chose 9 representative populations (including Papuan, Yoruba and Baka) from the 22, and compared each of the 447 diversity panel genomes to them. We learn a model for each individual l not in our panel,
where the positive mixture weights αk sum to 1 and are otherwise learned from the j ∈ (1..9) observations which we have data under quadratic loss. We can then predict the unobserved values
Examination of this matrix (SI1:S2.2.3, SI2:2.2.3-III) implies no other populations are expected to have unusual MSMC split times from Africa.
Mixture model for African haplotypes in Papuans
Obtaining haplotypes from painting
We define as haplotypes assigned as African or Archaic in Eurasians or Papuans a genomic locus spanning at least 1000bp, and showing SNPs that were assigned by chromopainter a 50% chance of copying from either an African or Archaic genome, respectively. For each haplotype we then calculated the number of non-African mutations, defined as sites found in derived state in a given haplotype and in ancestral state in all of the African genomes included in the present study.
Modelling
We used a non-parametric model for the joint distribution of length and non-African derived allele mutation rate in haplotypes. We fit K (=20) components to the joint distribution. Each component has a characteristic length lk, variability σk and mutation rate μk. A haplotype of length li with Xi such mutations from component li = k has the following distribution:
This model for haplotype lengths is motivated by the extreme age of the split times we seek to model. Recent splits would lead to an exponential distribution of haplotype lengths. However, due to haplotype fixation caused by finite population size, very old splits have finite (non-zero) haplotype lengths. Additionally, the data are left-censored since we cannot reliably detect haplotypes that are very short. We note that whilst this makes a single component a reasonable fit to the data, as K increases the specific choice becomes less important.
We then impose the prior p(Ii = k) =1/K and use the Expectation-Maximization algorithm to estimate the mixture proportions πik = E(Iik|li,Xi) along with the maximum likelihood parameter estimates We do this for the four combinations of haplotypes assigned as African (AFR) and Denisova (DEN) found in Papuans (PNG) or Europeans (EUR), in order to learn the parameters. SI1:S2.2.10 describes this in more detail. We then describe the distribution of haplotypes for each class c of haplotype in terms of the expected proportion of haplotypes found in each component,
where Nc is the number of haplotypes of class c. πc is a vector of the proportions from each of the K components.
Single-out-of-Africa model
We fit haplotypes assigned as African in Papuans as a mixture of the others in a second layer of mixture modelling:
where αc sum to 1. This is straightforward to fit.
xOoA model
We jointly estimate an additional component πxOoA and the mixture contributions βc under the mixture
This is non-trivial to fit. We use a penalisation scheme to simultaneously ensure we a) obtain a valid mixture for βc, b) give a prediction xk that is also a valid mixture, c) leave little signal in the residuals, and d) obtain a good fit. Cross-validation is used to obtain the optimal penalisation parameters (A and B) with the loss function:
where ek are the residuals in each component, (for a valid mixture) and PB = s.d(ek) (for requirement c, good solutions will have similar residuals across components). The loss is minimised via standard optimization techniques. SI1:S2.2.10 details how initial values are found and explores the robustness of the solution to changes in A and B - the results do not change qualitatively for reasonable choices of these parameters, and the mixtures are valid to within numerical error.
Genome-wide xOoA estimation
We used the estimated xOoA derived allele mutation rate estimate θxOoA to estimate the xOoA contribution in haplotypes classed as Eurasian or Papuan by ChromoPainter. First we obtained estimates of πPNG.EUR and πPNG.PNG using the single out-of-Africa model above, additionally allowing a EUR.EUR contribution. We then estimate αxOoA using the observed mutation rate θobs and that predicted under the mixture model θmix by rearranging the mixture:
Estimates less than zero are set to 0. The genome wide estimate is obtained by weighting each θ by the proportion of the genome that was painted with that donor. Neanderthal and Denisova haplotypes were assumed to be proxied by PNG.DEN (0% xOoA by assumption); African haplotypes by PNG.AFR; Papuan and Australian by PNG.PNG and all other haplotypes by PNG.EUR. We obtain confidence intervals by bootstrap resampling of haplotypes for each donor/recipient pair.
We estimate the proportion of xOoA in Papuan haplotypes assigned as both Eurasian (0.1%, 95% CI 0-2.6) and Papuan (4%, 95% CI 2.9-4.5) (SI1:2.2.10), by using the estimated mutation density in xOoA.
Y chromosome and mtDNA haplopgroup analysis
The presence of an extinct xOoA trace in the genome of modern Papuans may seem at odds with analyses of mtDNA and Y chromosome phylogenies, which point to a single, recent origin for all non-African lineages (mtDNA L3, which gives rise to all mtDNA lineages outside Africa has been dated at ~70 kya,33,34). However, uniparental markers inform on a small fraction of our genetic history, and a single origin for all non-African lineages does not exclude multiple waves OoA from a shared common ancestor. We show analytically (SI1:2.2.12) that, if the xOoA signature entered the genome of Papuan individuals >40 kya, their mtDNA and Y lineages could have been lost by genetic drift even assuming an initial xOoA mixing component of up to 35%. Similar findings have been reported recently13.
Extended Data
ED1. Sample Diversity and Archaic signals.
A: Map of location of samples highlighting the Diversity/Selection Sets; B: ADMIXTURE plot (K=8 and 14) which relates general visual inspection of genetic structure to studied populations and their region of origin; C: Sample level heterozygosity is plotted against distance from Addis Ababa. The trend line represents only non-African samples. The inset shows the waypoints used to arrive at the distance in kilometres for each sample. D: Boxplots were used to visualize the Denisova (red), Altai (green) and Croatian Neanderthal (blue) D distribution for each regional group of samples. Oceanian Altai D values show a remarkable similarity with the Denisova D values for the same region, in contrast with the other groups of samples where the Altai boxplots tend to be more similar to the Croatian Neanderthal ones.
ED2. Data quality checks and heterozygosity patterns.
Concordance of DNA sequencing (Complete Genomics Inc.) and DNA genotyping (Illumina genotyping arrays) data (ref-ref; het-ref-alt and hom-alt-alt, see SI 1.6) from chip (A) and sequence data (B). Coverage (depth) distribution of variable positions, divided by DNA source (Blood or Saliva) and Complete Genomic calling pipeline (release version) (C). Genome-wide distribution of Transition/Transversion ratio subdivided by DNA source (Saliva or Blood) and by Complete Genomic calling pipeline (D). Genome-wide distribution of Transition/Transversion ratio subdivided by chromosomes (E). Inter-chromosome differences in observed heterozygosity in 447 samples from the Diversity Set (F). Inter-chromosome differences in observed heterozygosity in a set of 50 unpublished genomes from the Estonian Genome Center, sequenced on an Illumina platform at an average coverage exceeding 30x (G). Inter-chromosome differences in observed heterozygosity in the phase 3 of the 1000 Genomes Project (H). The total number of observed heterozygous sites was divided by the number of accessible basepairs reported by the 1000 Genomes Project.
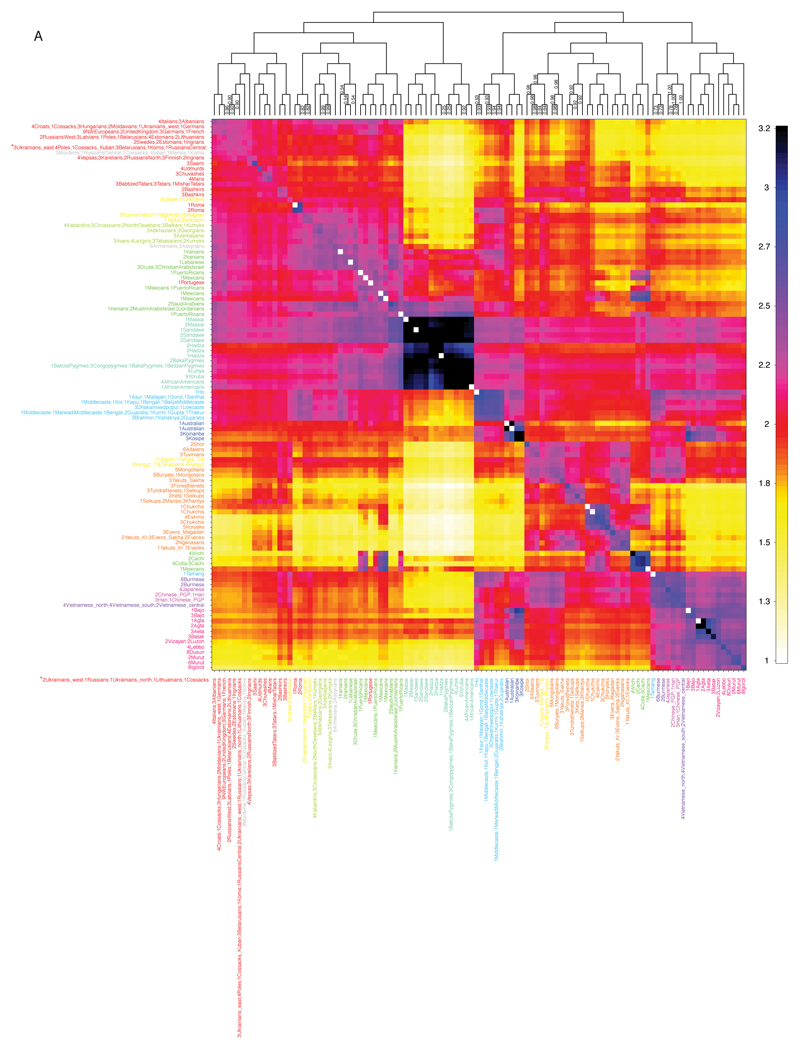
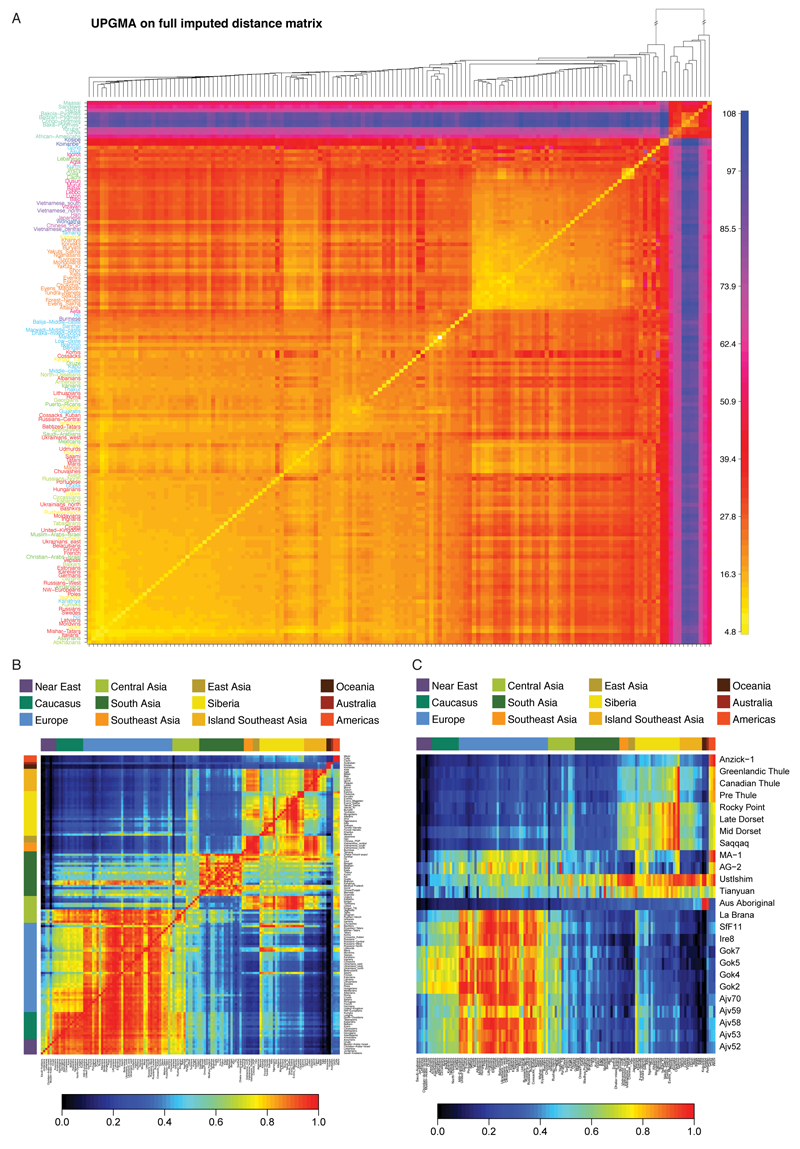
ED3. FineSTRUCTURE shared ancestry analysis.
ChromoPainter and FineSTRUCTURE results, showing both inferred populations with the underlying (averaged) number of haplotypes that an individual in a population receives (rows) from donor individuals in other populations (columns). 108 populations are inferred by FineSTRUCTURE. The dendrogram shows the inferred relationship between populations. The numbers on the dendrogram give the proportion of MCMC iterations for which each population split is observed (where this is less than 1). Each “geographical region” has a unique colour from which individuals are labeled. The number of individuals in each population is given in the label; e.g. “4Italians; 3Albanians” is a population of size 7 containing 4 individuals from Italy and 3 from Albania.
ED4. MSMC genetic split times and outgroup f3 results.
The MSMC split times estimated between each sample and a reference panel of 9 genomes were linearly interpolated to infer the broader square matrix (A). Summary of outgroup f3 statistics for each pair of non-African populations (B) or to an ancient sample (C) using Yoruba as an outgroup. Populations are grouped by geographic region and are ordered with increasing distance from Africa (left to right for columns and bottom to top for rows). Colour bars at the left and top of the heat map indicate the colour coding used for the geographical region. Individual population labels are indicated at the right and bottom of the heat map. The f3 statistics are scaled to lie between 0 and 1, with a black colour indicating those close to 0 and a red colour indicating those close to 1. Let m and M be the minimum and maximum f3 values within a given row (i.e., focal population). That is, for focal population X (on rows), m = minY,Y≠X f3(X, Y ; Yoruba) and M = maxY,Y≠X f3(X, Y ; Yoruba). The scaled f3 statistic for a given cell in that row is given by f3scaled=(f3-m)/(M-m), so that the smallest f3 in the row has value f3scaled=0 (black) and the largest has value f3scaled=1 (red). By default, the diagonal has value f3scaled=1 (red). The heat map is therefore asymmetric, with the population closest to the focal population at a given row having value f3scaled=1 (red colour) and the population farthest from the focal population at a given row having value f3scaled=0 (black colour). Therefore, at a given row, scanning the columns of the heat map reveals the populations with the most shared ancestry with the focal population of that row in the heat map.
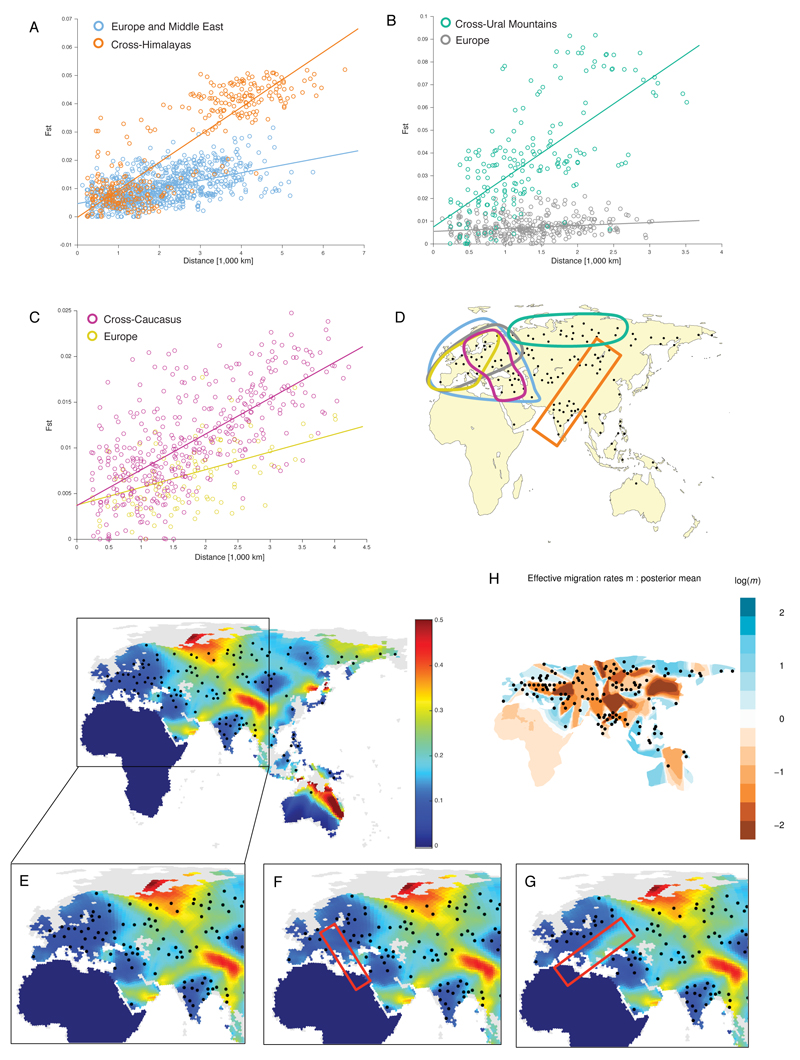
ED5. Geographical patterns of genetic diversity.
Isolation by distance pattern across areas of high genetic gradient, using Europe as a baseline. The samples used in each analysis are indicated by coloured lines on the maps to the right of each plot. The panels show FST as a function of distance across the Himalayas (A), the Ural mountains (B), and the Caucasus (C) as reported on the color-coded map (D). Effect of creating gaps in the samples in Europe (E): we tested the effect of removing samples from stripes, either north to south (F) or west to east (G), to create gaps comparable in size to the gaps in samples in the dataset. Effective migration surfaces inferred by EEMS (H).
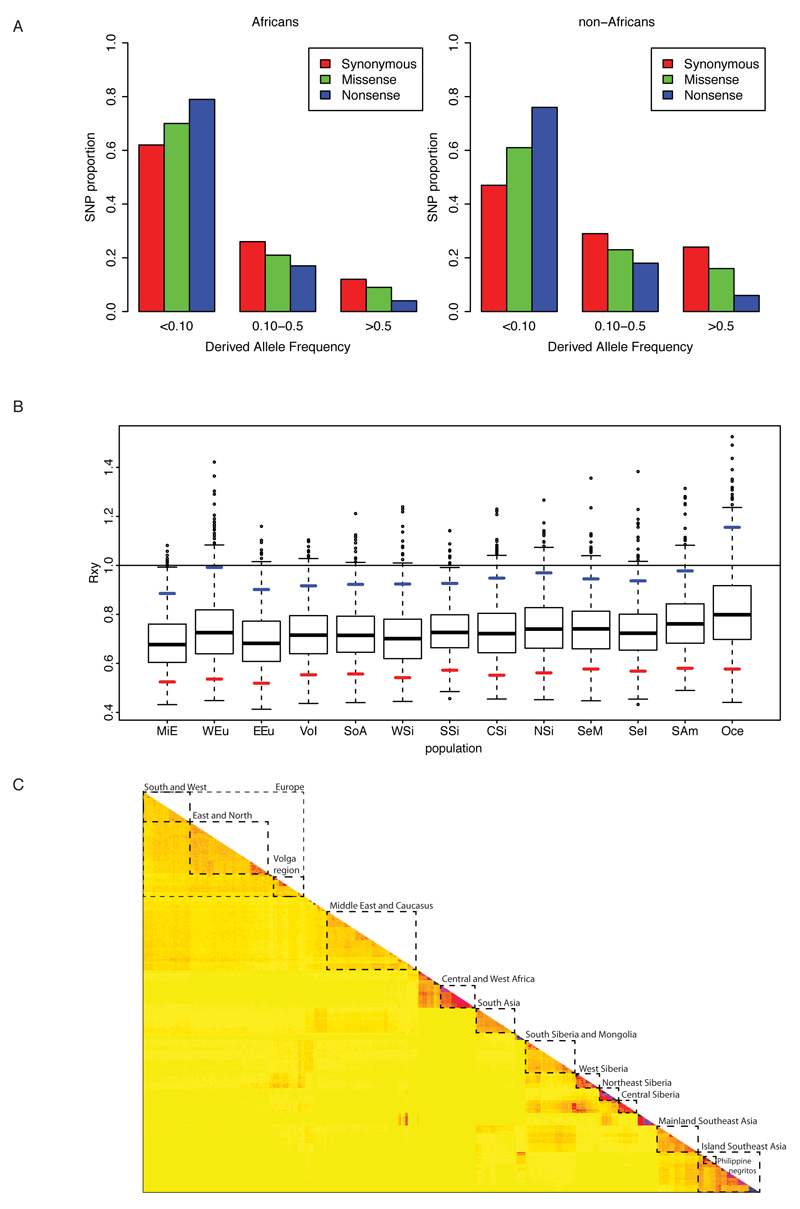
ED6. Summary of positive selection results.
Barplot comparing frequency distributions of functional variants in Africans and non-Africans (A). The distribution of exonic SNPs according to their functional impact (synonymous, missense and nonsense) as a function of allele frequency. Note that the data from both groups was normalised for a sample size of n=21 and that the Africans show significantly (Chisq p-value <10-15) more rare variants across all sites classes.
Result (B) of 1000 bootstrap replica of the Rxy test for a subset of pigmentation genes highlighted by GWAS (n=32). The horizontal line provides the African reference (x=1) against which all other groups are compared. The blue and red marks show the 95th and the 5th percentile of the bootstrap distributions respectively. If the 95th percentile is below 1, then the population shows a significant excess of missense variants in the pigmentation subset relative to the Africans. Note that this is the case for all non-Africans except the Oceanians. Pools (C) of individuals for selection scans. fineSTRUCTURE based coancestry matrix was used to define twelve groups of populations for the downstream selection scans. These groups are highlighted in the plot by boxes with broken line edges. The number of individuals in each group is reported in Table SI2:3.2-I.
ED7. Length of haplotypes assigned as African by fineSTRUCTURE as a function of genome proportion.
A: 447 Diversity Panel results, showing label averages (large crosses) along with individuals (small dots). B: Relative excluded Diversity Panel results, to check for whether including related individuals affects African genome fraction. Individuals that shared more than 2% of genome fraction were forbidden from receiving haplotypess from each other, and the painting was re-run on a large subset of the genome (all ROH regions from any individual). C: ROH only African haplotypes. To guard against phasing errors, we analysed only regions for which an individual was in a long (>500kb) Run of Homozygosity using the PLINK command “--homozyg-window-kb 500000 --homozyg-window-het 0 --homozyg-density 10”. Because there are so few such regions, we report only the population average for populations with two or more individuals, as well as the standard error in that estimate. Populations for whom the 95% CI passed 0 were also excluded. Note the logarithmic axis. D: Ancient DNA panel results. We used a different panel of 109 individuals which included 3 ancient genomes. We painted Chromosomes 11, 21 & 22 and report as crosses the population averages for populations with 2 or more individuals. The solid thin lines represent the position of each population when modern samples only are analysed. The dashed lines lead off the figure to the position of the ancient hominins and the African samples.
ED8. MSMC Linear behavior of MSMC split estimates in presence of admixture.
The examined Central Asian (A), East African (B), and African-American (C) genomes yielded a signature of MSMC split time (Truth, left-most column) that could be recapitulated (Reconstruction, second left most column) as a linear mixture of other MSMC split times. The admixture proportions inferred by our method (top of each admixture component column) were remarkably similar to the ones previously reported from the literature.
MSMC split times (D) calculated after re-phasing an Estonian and a Papuan (Koinanbe) genome together with all the available West African and Pygmy genomes from our dataset to minimize putative phasing artefacts. The cross coalescence rate curves reported here are quantitatively comparable with the ones of Figure 2 A, hence showing that phasing artefacts are unlikely to explain the observed past-ward shift of the Papuan-African split time. Boxplot (E) showing the distribution of differences between African-Papuan and African-Eurasian split times obtained from coalescent simulations assembled through random replacement to make 2000 sets of 6 individuals (to match the 6 Papuans available from our empirical dataset), each made of 1.5 Gb of sequence. The simulation command line used to generate each chromosome made of 5Mb was as follows, being *DIV*=0.064; 0.4 or 0.8 for the xOoA, Denisova (Den) and Divergent Denisova (DeepDen) cases, respectively: ms0ancient2 10 1 .065 .05 -t 5000. -r 3000. 5000000 -I 7 1 1 1 1 2 2 2 -en 0. 1 .2 -en 0. 2 .2 -en 0. 3 .2 -en 0. 4 .2 -es .025 7 .96 -en .025 8 .2 -ej .03 7 6 -ej .04 6 5 -ej .060 8 3 -ej .061 4 3 -ej .062 2 1 -ej .063 3 1 -ej *DIV* 1 5
ED9. Modelling the xOoA components with FineSTRUCTURE.
A: Joint distribution of haplotype lengths and Derived allele count, showing the median position of each cluster and all haplotypes assigned to it in the Maximum A Posteriori (MAP) estimate. Note that although a different proportion of points is assigned to each in the MAP, the total posterior is very close to 1/K for all. The dashed lines show a constant mutation rate. Haplotypes are ordered by mutation rate from low to high. B: Residual distribution comparison between the two component mixture using EUR.AFR and EUR.PNG (left), and the three component mixture including xOoA (using the same colour scale) (right). The residuals without xOoA are larger (RMSE 0.0055 compared to RMSE 0.0018) but more importantly, they are also structured. C: Assuming a mutational clock and a correct assignment of haplotypes, we can estimate the relative age of the splits from the number of derived alleles observed on the haplotypes. This leads to an estimate of 1.5 times older for xOoA compared to the Eurasian-Africa split.
ED10. Proposed xOoA model.
A subway map figure illustrating, as suggested by the novel results presented here, a model of an early, extinct Out-of-Africa (xOoA) signature in the genomes of Sahul populations at their arrival in the region. Given the overall small genomic contribution of this event to the genomes of modern Sahul individuals, we could not determine whether the documented Denisova admixture (question marks) and putative multiple Neanderthal admixtures took place along this extinct OoA. We also speculate (question mark) people who migrated along the xOoA route may have left a trace in the genomes of the Altai Neanderthal as reported by Kuhlwilm and colleagues12.
Supplementary Information
Additional results are reported in two Supplementary Information files online: SI1 including description of additional analyses, and SI2 including results in table format.
Acknowledgements
Support was provided by: Estonian Research Infrastructure Roadmap grant no 3.2.0304.11-0312; Australian Research Council Discovery grants (DP110102635 and DP140101405) (D.M.L, M.W. and E.W.); Danish National Research Foundation; the Lundbeck Foundation and KU2016 (E.W.); ERC Starting Investigator grant (FP7 - 261213) (T.K.); Estonian Research Council grant PUT766 (G.C.; M.K.); EU European Regional Development Fund through the Centre of Excellence in Genomics to Estonian Biocentre; Estonian Institutional Research grant IUT24-1; (L.S.; M.J.; A.K.; B.Y.; K.T.; C.B.M.; Le.S.; H.Sa.; S.L.; D.M.B.; E.M.; R.V.; G.H.; M.K.; G.C.; T.K.; M.M.); French Ministry of Foreign and European Affairs and French ANR grant number ANR-14-CE31-0013-01 (F.-X.R.); Gates Cambridge Trust Funding (E.J.); ICG SB RAS (No. VI.58.1.1) (D.V.L.); Leverhulme Programme grant no. RP2011-R-045 (A.B.M., P.G. & M.G.T.); Ministry of Education and Science of Russia; Project 6.656.2014/K (S.A.F.); NEFREX grant funded by the European Union (People Marie Curie Actions; International Research Staff Exchange Scheme; call FP7-PEOPLE-2012-IRSES-number 318979) (M.M.; G.H.); NIH grants 5DP1ES022577 05, 1R01DK104339-01, and 1R01GM113657-01 (S.Tis); Russian Foundation for Basic Research (grant N 14-06-00180a) (M.G.); Russian Foundation for Basic Research; grant 16-04-00890 (O.B.; E.B); Russian Science Foundation grant 14-14-00827 (O.B.); The Russian Foundation for Basic Research (14-04-00725-a), The Russian Humanitarian Scientific Foundation (13-11-02014) and the Program of the Basic Research of the RAS Presidium "Biological diversity" (E.K.K.); Wellcome Trust and Royal Society grant WT104125AIA & the Bristol Advanced Computing Research Centre - http://www.bris.ac.uk/acrc/ (D.J.L); Wellcome Trust grant 098051 (Q.A.; C.T.-S.; Y.X.); Wellcome Trust Senior Research Fellowship grant 100719/Z/12/Z (M.G.T); Young Explorers Grant from the National Geographic Society (8900-11) (C.A.E.); ERC Consolidator Grant 647787 ‘LocalAdaptatio’ (AM); Program of the RAS Presidium "Basic research for the development of the Russian Arctic" (B.M.); Russian Foundation for Basic Research grant 16-06-00303 (E.B).
Footnotes
Author Contributions:
Conceived the study: R.V, E.W, T.K, M.M.
Conducted anthropological research and/or sample collection and management: A.K, K.T, C.B.M, Le.S, E.P, G.A, C.M, M.W, D.L, G.Z, S.T, D.D, Z.S, G.N.N.S, K.M, J.I, L.D.D, M.G, P.N, I.E, L.At, O.U, F.-X.R, N.B, H.S, T.L, M.P.C, N.A.B, V.S, L.A, D.Pr, H.Sa, M.Mo, C.A.E, D.V.L, S.A, G.C, J.T.S.W, E.Mi, A.Ka, S.L, R.K, N.T, V.A, I.K, D.M, L.Y, D.M.B, E.B, A.Me, M.D, B.M, M., S.A.F, L.P.O, M.M., M.L, A.B.M, O.B, E.K.K, E.M, M.G.T, E.W.
Provided access to data: J.L, S.Ti.
Analysed data: L.P, D.J., E.J, A.M, M.Mit, F.C, G.H, M.D, A.E, L.S, J., A.C, R.M, M.A.W.S, S.K, C.I, C.L.S, M.J, M.K, G.S.J, T., F.M.I, A.K, Q.A, C.T.-S, Y.X, B.Y, C.B.M, T.K, M.M.
Contributed to interpretation of results: L.P, D.J., E.J, A.M, L.S, M.K, K.T, C.B.M, Le.S, G.C, M.M., P.G, M.L, A.B.M, M.P, E.M, M.G.T, A.Ma, R.N, R.V, E.W, T.K, M.M.
Wrote manuscript: L.P, D.J., E.J, A.M, F.C, G.H, M.D, A.E, A.C, M.A.W.S, B.Y, J.L, S.Ti, M.M., P.G, M.L, A.B.M, M.P, M.G.T, A.Ma, R.N, R.V, E.W, T.K, M.M.
The authors declare no competing financial interests.
References
- 1.Drmanac R, et al. Human genome sequencing using unchained base reads on self-assembling DNA nanoarrays. Science. 2010;327:78–81. doi: 10.1126/science.1181498. [DOI] [PubMed] [Google Scholar]
- 2.Lachance J, et al. Evolutionary history and adaptation from high-coverage whole-genome sequences of diverse African hunter-gatherers. Cell. 2012;150:457–469. doi: 10.1016/j.cell.2012.07.009. [DOI] [PMC free article] [PubMed] [Google Scholar]
- 3.Pagani L, et al. Tracing the Route of Modern Humans out of Africa by Using 225 Human Genome Sequences from Ethiopians and Egyptians. American journal of human genetics. 2015;96:986–991. doi: 10.1016/j.ajhg.2015.04.019. [DOI] [PMC free article] [PubMed] [Google Scholar]
- 4.Clemente FJ, et al. A Selective Sweep on a Deleterious Mutation in CPT1A in Arctic Populations. American journal of human genetics. 2014;95:584–589. doi: 10.1016/j.ajhg.2014.09.016. [DOI] [PMC free article] [PubMed] [Google Scholar]
- 5.Gudbjartsson DF, et al. Large-scale whole-genome sequencing of the Icelandic population. Nat Genet. 2015;47:435–444. doi: 10.1038/ng.3247. [DOI] [PubMed] [Google Scholar]
- 6.Weinstein JN, et al. The Cancer Genome Atlas Pan-Cancer analysis project. Nat Genet. 2013;45:1113–1120. doi: 10.1038/ng.2764. [DOI] [PMC free article] [PubMed] [Google Scholar]
- 7.Li H, Durbin R. Inference of human population history from individual whole-genome sequences. Nature. 2011;475:493–496. doi: 10.1038/nature10231. [DOI] [PMC free article] [PubMed] [Google Scholar]
- 8.Schiffels S, Durbin R. Inferring human population size and separation history from multiple genome sequences. Nat Genet. 2014;46:919–925. doi: 10.1038/ng.3015. [DOI] [PMC free article] [PubMed] [Google Scholar]
- 9.Patterson N, et al. Ancient admixture in human history. Genetics. 2012;192:1065–1093. doi: 10.1534/genetics.112.145037. [DOI] [PMC free article] [PubMed] [Google Scholar]
- 10.Scally A, Durbin R. Revising the human mutation rate: implications for understanding human evolution. Nat Rev Genet. 2012;13:745–753. doi: 10.1038/nrg3295. [DOI] [PubMed] [Google Scholar]
- 11.Grove M, et al. Climatic variability, plasticity, and dispersal: A case study from Lake Tana, Ethiopia. Journal of human evolution. 2015;87:32–47. doi: 10.1016/j.jhevol.2015.07.007. [DOI] [PubMed] [Google Scholar]
- 12.Kuhlwilm M, et al. Ancient gene flow from early modern humans into Eastern Neanderthals. Nature. 2016;530:429–433. doi: 10.1038/nature16544. [DOI] [PMC free article] [PubMed] [Google Scholar]
- 13.Groucutt HS, et al. Rethinking the dispersal of Homo sapiens out of Africa. Evol Anthropol. 2015;24:149–164. doi: 10.1002/evan.21455. [DOI] [PMC free article] [PubMed] [Google Scholar]
- 14.Liu W, et al. The earliest unequivocally modern humans in southern China. Nature. 2015;526:696–699. doi: 10.1038/nature15696. [DOI] [PubMed] [Google Scholar]
- 15.Reyes-Centeno H, et al. Genomic and cranial phenotype data support multiple modern human dispersals from Africa and a southern route into Asia. Proceedings of the National Academy of Sciences of the United States of America. 2014;111:7248–7253. doi: 10.1073/Pnas.1323666111. [DOI] [PMC free article] [PubMed] [Google Scholar]
- 16.Mellars P, Gori KC, Carr M, Soares PA, Richards MB. Genetic and archaeological perspectives on the initial modern human colonization of southern Asia. Proceedings of the National Academy of Sciences of the United States of America. 2013;110:10699–10704. doi: 10.1073/Pnas.1306043110. [DOI] [PMC free article] [PubMed] [Google Scholar]
- 17.Prugnolle F, Manica A, Balloux F. Geography predicts neutral genetic diversity of human populations. Current Biology. 2005;15:R159–R160. doi: 10.1016/j.cub.2005.02.038. [DOI] [PMC free article] [PubMed] [Google Scholar]
- 18.Green RE, et al. A draft sequence of the Neandertal genome. Science. 2010;328:710–722. doi: 10.1126/science.1188021. [DOI] [PMC free article] [PubMed] [Google Scholar]
- 19.Reich D, et al. Denisova admixture and the first modern human dispersals into Southeast Asia and Oceania. American journal of human genetics. 2011;89:516–528. doi: 10.1016/j.ajhg.2011.09.005. [DOI] [PMC free article] [PubMed] [Google Scholar]
- 20.Fu Q, et al. Genome sequence of a 45,000-year-old modern human from western Siberia. Nature. 2014;514:445–449. doi: 10.1038/nature13810. [DOI] [PMC free article] [PubMed] [Google Scholar]
- 21.Fu Q, et al. A revised timescale for human evolution based on ancient mitochondrial genomes. Current Biology. 2013;23:553–559. doi: 10.1016/j.cub.2013.02.044. [DOI] [PMC free article] [PubMed] [Google Scholar]
- 22.Fu Q, et al. The genetic history of Ice Age Europe. Nature. 2016 doi: 10.1038/nature17993. [DOI] [PMC free article] [PubMed] [Google Scholar]
- 23.Meyer M, et al. A High-Coverage Genome Sequence from an Archaic Denisovan Individual. Science. 2012;338:222–226. doi: 10.1126/Science.1224344. [DOI] [PMC free article] [PubMed] [Google Scholar]
- 24.Petkova D, Novembre J, Stephens M. Visualizing spatial population structure with estimated effective migration surfaces. Nat Genet. 2016;48:94–100. doi: 10.1038/ng.3464. [DOI] [PMC free article] [PubMed] [Google Scholar]
- 25.Hellenthal G, et al. A genetic atlas of human admixture history. Science. 2014;343:747–751. doi: 10.1126/science.1243518. [DOI] [PMC free article] [PubMed] [Google Scholar]
- 26.Chapman NH, Thompson EA. A model for the length of tracts of identity by descent in finite random mating populations. Theoretical population biology. 2003;64:141–150. doi: 10.1016/s0040-5809(03)00071-6. [DOI] [PubMed] [Google Scholar]
- 27.Wall JD, et al. Higher levels of neanderthal ancestry in East Asians than in Europeans. Genetics. 2013;194:199–209. doi: 10.1534/genetics.112.148213. [DOI] [PMC free article] [PubMed] [Google Scholar]
- 28.Posth C, et al. Pleistocene Mitochondrial Genomes Suggest a Single Major Dispersal of Non-Africans and a Late Glacial Population Turnover in Europe. Current biology: CB. 2016 doi: 10.1016/j.cub.2016.01.037. [DOI] [PubMed] [Google Scholar]
- 29.The 1000 Genomes Project Consortium. An integrated map of genetic variation from 1,092 human genomes. Nature. 2012;491:56–65. doi: 10.1038/nature11632. [DOI] [PMC free article] [PubMed] [Google Scholar]
- 30.Migliano AB, Vinicius L, Lahr MM. Life history trade-offs explain the evolution of human pygmies. Proceedings of the National Academy of Sciences of the United States of America. 2007;104:20216–20219. doi: 10.1073/pnas.0708024105. [DOI] [PMC free article] [PubMed] [Google Scholar]
- 31.Mikkelsen T, et al. Initial sequence of the chimpanzee genome and comparison with the human genome. Nature. 2005;437:69–87. doi: 10.1038/nature04072. [DOI] [PubMed] [Google Scholar]
- 32.Lawson DJ, Hellenthal G, Myers S, Falush D. Inference of population structure using dense haplotype data. PLoS genetics. 2012;8:e1002453. doi: 10.1371/journal.pgen.1002453. [DOI] [PMC free article] [PubMed] [Google Scholar]
- 33.Behar DM, et al. A "Copernican" Reassessment of the Human Mitochondrial DNA Tree from its Root. American journal of human genetics. 2012;90:675–684. doi: 10.1016/J.Ajhg.2012.03.002. [DOI] [PMC free article] [PubMed] [Google Scholar]
- 34.Soares P, et al. The Archaeogenetics of Europe. Current Biology. 2010;20:R174–R183. doi: 10.1016/j.cub.2009.11.054. [DOI] [PubMed] [Google Scholar]
Associated Data
This section collects any data citations, data availability statements, or supplementary materials included in this article.
Supplementary Materials
Data Availability Statement
The newly sequenced genomes are part of the Estonian Biocentre human Genome Diversity Panel (EGDP) and were deposited in the ENA archive under accession number PRJEB12437 and are also freely available through the Estonian Biocentre website (www.ebc.ee/free_data).


