

Abstract
Bupropion is a widely used antidepressant and smoking cessation aid and a strong inhibitor of CYP2D6 in vivo. Bupropion is administered as a racemic mixture of R- and S-bupropion and has stereoselective pharmacokinetics. Four primary metabolites of bupropion, threo- and erythrohydrobupropion and R,R- and S,S-OH-bupropion, circulate at higher concentrations than the parent drug and are believed to contribute to the efficacy and side effects of bupropion as well as to the CYP2D6 inhibition. However, bupropion and its metabolites are only weak inhibitors of CYP2D6 in vitro, and the magnitude of the in vivo drug-drug interactions (DDI) caused by bupropion cannot be explained by the in vitro data even when CYP2D6 inhibition by the metabolites is accounted for. The aim of this study was to quantitatively explain the in vivo CYP2D6 DDI magnitude by in vitro DDI data. Bupropion and its metabolites were found to inhibit CYP2D6 stereoselectively with up to 10-fold difference in inhibition potency between enantiomers. However, the reversible inhibition or active uptake into hepatocytes did not explain the in vivo DDIs. In HepG2 cells and in plated human hepatocytes bupropion and its metabolites were found to significantly downregulate CYP2D6 mRNA in a concentration dependent manner. The in vivo DDI was quantitatively predicted by significant down-regulation of CYP2D6 mRNA and reversible inhibition of CYP2D6 by bupropion and its metabolites. This study is the first example of a clinical DDI resulting from CYP down-regulation and first demonstration of a CYP2D6 interaction resulting from transcriptional regulation.
Keywords: Drug-drug interactions, CYP2D6, bupropion, enzyme regulation, in vitro to in vivo extrapolation
Graphical Abstract

1. Introduction
Reliable identification of drug-drug interaction (DDI) risk and accurate prediction of the magnitude of clinical DDIs from in vitro data is critical in drug development [1,2]. The decision to conduct dedicated DDI studies, and the design of the DDI studies during new drug development depend on accurate identification of DDI risk in in vitro studies. The cornerstone of DDI predictions is in vitro to in vivo extrapolation (IVIVE) of DDIs arising from reversible P450 inhibition. In vivo DDI risk is generally identified based on in vitro experiments once all inhibitory species, including metabolites, and different interaction sites including the gut are accounted for [3,4]. Similarly, DDI risk is usually identified for time dependent inhibitors [3,5], transporter mediated DDIs [6] and for DDIs involving P450 induction [7], but quantitative predictions in these areas are still challenging. Nevertheless, trust in DDI risk identification is overshadowed by clinically observed DDIs that cannot be predicted from in vitro data despite considerable in vitro research efforts [4]. An example of such DDI is the strong inhibition of CYP2D6 by bupropion in vivo, which cannot be predicted using current in vitro data.
Bupropion is a commonly used norepinephrine and dopamine reuptake inhibitor approved for use as an antidepressant [8], smoking cessation aid [9] and weight loss therapy [10]. Bupropion is a strong in vivo CYP2D6 inhibitor increasing desipramine area under plasma concentration time curve (AUC) by 5.2-fold [11]. Bupropion also increases methamphetamine and venlafaxine exposures 1.5- and 3-fold, respectively [12,13], and results in phenoconversion from CYP2D6 extensive to poor metabolizer phenotype based on dextromethorphan/dextrorphan urinary ratio [14]. Based on the fraction metabolized by CYP2D6 (fm) for desipramine (90% [15]) and venlafaxine (80% [16]), these DDIs can be explained by approximately 90% decrease in CYP2D6 activity following bupropion dosing. Yet, in vitro experiments underpredict this DDI by 2–5-fold [4,11], as in vitro inhibition of CYP2D6 by bupropion only predicts <10 % inhibition of CYP2D6 in vivo [4].
It has been widely accepted that inhibition of CYP2D6 by the major circulating metabolites of bupropion, hydroxybupropion (OH-bupropion), threohydrobupropion and erythrohydrobupropion (Figure 1), can partially explain the in vivo CYP2D6 inhibition [4,11]. While CYP2D6 DDI risk is missed when only bupropion is considered for DDI risk assessment, the DDI risk is captured when bupropion and its circulating metabolites are included [4,11]. However, only a 1.4-fold increase in desipramine AUC is predicted based on in vitro inhibition constants of bupropion and its metabolites [4], in comparison to the observed 5.2-fold increase, demonstrating a concerning 5-fold underprediction of the in vivo DDI. Liver partitioning of bupropion and its metabolites, based on whole body autoradiography studies in rats, has been proposed to explain the underprediction, but even after assuming 5 to 9-fold higher unbound liver than plasma concentrations of bupropion and its metabolites, only a 2.9 to 3.8-fold increase in desipramine AUC is predicted [11]. As such, existing IVIVE methods for DDI predictions have failed to appropriately identify the clinical DDI risk of bupropion, and the mechanisms of the CYP2D6 mediated DDIs precipitated by bupropion are still unknown.
Figure 1. Stereoselective bupropion metabolism.

R- and S-bupropion are metabolized to R,R-OH-, S,S-OH-bupropion, 4′-OH-bupropion, threohydrobupropion and erythrohydrobupropion. Threo- and erythrohydrobupropion are further metabolized to threo- and erythro-4′-OH-hydrobupropion.
Bupropion is administered as a racemic mixture of R- and S-bupropion (Figure 1) and shows stereoselective in vivo disposition with R-bupropion concentrations being significantly higher than S-bupropion [17,18]. The lower concentration and higher in vivo clearance of S-bupropion are predominantly explained by higher formation clearance of the major metabolite threohydrobupropion from S-bupropion [19], and circulating concentrations of threohydrobupropion exceed bupropion concentrations considerably [20]. Similarly, R,R-OH-bupropion has up to 65-fold higher circulating concentrations than bupropion and S,S-OH-bupropion following a single dose of bupropion [18]. The significant stereoselectivity in bupropion and its metabolite disposition, and the CYP2D6 inhibition by racemic bupropion and its metabolites suggests that stereoselective inhibition of CYP2D6 by bupropion and its metabolites may in part explain the underprediction of bupropion mediated DDIs. Yet, the stereoselective inhibition of CYP2D6 by bupropion and its metabolites has not been previously studied. It is also possible that additional metabolites of bupropion that exist in humans contribute to CYP2D6 inhibition in vivo. Recently, three new metabolites of bupropion, 4′OH-bupropion, threo-4′OH-hydrobupropion and erythro-4′OH-hydrobupropion were identified and characterized [19,21]. Although the circulating concentrations of these metabolites are much lower than those of bupropion, it is possible that they are present in the liver at sufficient concentrations to contribute to CYP2D6 inhibition. Hence, characterization of the CYP2D6 inhibition by these new metabolites is warranted. Finally, several recent studies have demonstrated that retinoic acid and the farnesoid X receptor agonist GW4064 downregulate CYP2D6 mRNA and protein expression in vitro in human liver models and in vivo in mice [22,23]. Based on this data of transcriptional regulation of CYP2D6 by xenobiotics, it is possible that the in vivo DDIs caused by bupropion are also due to downregulation of CYP2D6 by bupropion and/or its metabolites. However, regulation of mRNA expression of any of the drug metabolizing CYPs by bupropion has not been previously studied. The aim of this study was to quantitatively explain the in vivo DDIs mediated by bupropion through characterization of the stereoselective CYP2D6 inhibition by bupropion and all of its known metabolites, and by determining whether bupropion and its metabolites affect CYP2D6 mRNA and protein expression.
2. Methods and Materials
2.1 Chemicals and biological samples
Bupropion, R-bupropion, S-bupropion, OH-bupropion, R,R-OH-bupropion, S,S-OH-bupropion, threohydrobupropion, erythrohydrobupropion, hydroxybupropion-d6 and m-chlorohippuric acid were purchased from Toronto Research Chemicals (Ontario, Canada). The enantiomeric purity of R- and S-bupropion used in the experiments was confirmed to be >97.5% in all lots used using chiral HPLC. 4′-OH-bupropion, threo-4′-OH-hydrobupropion and erythro-4′-OH-hydrobupropion were synthesized as previously described [21]. α-OH-midazolam-d4 was purchased from Cerilliant (Round Rock, TX) and dextromethorphan, dextrorphan, and Krebs-Henseleit buffer from Sigma-Aldrich (St. Louis, MO). Cryopreserved suspension hepatocytes (Hu4010, Male age 53) and all other chemicals were purchased from Thermo Fisher Scientific (Waltham, MA). Human liver microsomes (HLM) from four donors genotyped as CYP2C19 and CYP2D6 extensive metabolizer were obtained from the University of Washington Human Liver Bank (Seattle, WA). HepG2 cells (HB8065) were purchased from ATCC (Manassas, VA). All studies in HepG2 cells were conducted at passage numbers 2–4. Cryopreserved plateable human hepatocytes from three donors (3 females aged 45–52 years, HC2-34, HC2-31 and HC3-38) and hepatocyte isolation kits K2000 were obtained from Xenotech (Kansas City, KS). Primer probes for CYP2D6 (Hs00164385_m1), CYP3A4 (Hs00604506_m1), CYP1A2 (Hs00167927_m1), SHP (Hs00222677_m1) and GAPDH (4310884E) were purchased from Applied Biosystems-Thermo Fisher Scientific (Foster City, CA). β-Actin antibody (product #AC-15) was obtained from Abcam (Cambridge, MA). CYP2D6 antibody (product #458246) was obtained from Corning Gentest (Corning, NY). The secondary antibody, IRDye 680 (anti-mouse; product #925-68070) was obtained from LiCor, Inc. (Lincoln, NE). Human plasma samples for measurement of steady state bupropion and metabolite concentrations were obtained from a previously described clinical study [21]. The study was approved by the University of Washington institutional review board. The study population consisted of five female subjects who were taking bupropion XL chronically (150–450 mg/day) for therapeutic reasons. Steady state blood samples were obtained from each subject within 6 hours of dosing, plasma separated from blood by centrifugation and plasma bupropion and metabolite concentrations measured.
2.2 LC/MS/MS Quantification Methods for bupropion and its metabolites
The concentrations of bupropion and its metabolites and stereoisomers as applicable were determined using an LC/MS/MS system consisting of an AB-Sciex API 4500 triple quadrupole mass spectrometer (AB Sciex, Foster City, CA) coupled with an LC-20AD ultra-fast liquid chromatography system (Shimadzu Co., Kyoto, Japan) as previously described [19,21]. The turbo ion spray interface was operated in positive ion mode and bupropion and its metabolites were detected at mass transitions (m/z): 240→184 (bupropion), 249→189 (bupropion-d9), 256→238 (OH-bupropion), 262→244 (OH-bupropion-d6), 242→168 (threo- and erythrohydrobupropion), 251→168 (threohydrobupropion-d9). Bupropion and its metabolites in incubations and protein binding assays were separated as previously described [21] using an Agilent (Santa Clara, CA) ZORBAX XDB-C18 column (50x2.1 mm, 5 μm), while for cell media samples bupropion, OH-bupropion, threohydrobupropion, erythrohydrobupropion were separated using an Agilent (Santa Clara, CA) ZORBAX XDB-C18 column (150×4.6 mm, 5 μm) as previously described [21]. For analysis of HepG2 cell media and plated hepatocyte media, 100 μL of 3:1 acetonitrile:methanol was added to 100 μL of media. HLM and suspension hepatocyte samples were protein precipitated with 100 μL of acetonitrile. All of the samples were centrifuged for 40 min at 3,000 g and the supernatant collected for analysis. For chiral analysis of bupropion and its metabolites in plasma, 160 μL of 3:1 acetonitrile:methanol were added to 40 μL of plasma. The chiral separation was achieved using an α-acid glycoprotein column (100 × 2 mm, 5 μm) and a mobile phase consisting of 20 mM ammonium formate, pH 5.7 and methanol as previously described [19]. All bupropion and metabolite assays had 100 nM OH-bupropion-d6, bupropion-d9, and threohydrobupropion-d9 in the quenching solution as internal standards.
2.4 Determination of IC50 of bupropion and its metabolites towards CYP2D6 in HLM
To determine IC50-values towards CYP2D6, R- and S-bupropion, R,R- and S,S-OH-bupropion, threohydrobupropion and erythrohydrobupropion at concentrations 0.5–1000 μM were incubated ni triplicate in 100 μl incubations with HLM (0.1 mg/ml) in 100 mM potassium phosphate buffer (KPi; pH 7.4) with dextromethorphan (1 μM) as a substrate and CYP2D6 probe. The mixtures were preincubated for 5 minutes at 37°C before initiating reactions with NADPH (1 mM, final concentration). Reactions were terminated after 5 minutes and the formation of dextrorphan as a CYP2D6 probe metabolite was measured by LC-MS/MS as previously described [24], using 100 nM α-OH-midazolam-d4 as an internal standard. All incubations were conducted under protein and time linearity. Interconversion of S- and R-bupropion was confirmed to be <5% in the incubations. The inhibition of CYP2D6 by 4′OH-bupropion, threo-4′OH-hydrobupropion and erythro-4′OH-hydrobupropion was tested by incubating each of the bupropion metabolites at 50 μM test concentration with HLM (0.1 mg/ml) in 100 mM potassium phosphate buffer (KPi; pH 7.4) with dextromethorphan (1 μM) as a substrate and CYP2D6 probe.
IC50 values were estimated by nonlinear least-squares analysis in GraphPad Prism (San Diego, CA) from equation 1
| (1) |
in which the total activity is the % activity in the absence of inhibitor, the nonspecific activity is the % activity remaining when maximum inhibition has been achieved and % control activity is the activity observed at a given inhibitor concentration [I].
2.5 Suspension Hepatocyte Partitioning and IC50 Determination
Cells were thawed and isolated using hepatocyte isolation kit (K2000, Xenotech) according to the manufacturer’s protocol. Cell count and viability were determined using Trypan Blue staining. Hepatocytes were resuspended in protein free Krebs-Henseleit Buffer. For cell partitioning measures, bupropion, OH-bupropion, threohydrobupropion or erythrohydrobupropion (1 μM) were incubated with hepatocytes (1×10⁵ cells) in a final volume of 100 μL. All incubations were conducted in triplicate. Due to the isomerization of bupropion, racemic bupropion was used in these experiments. After 30 min, cells were pelleted by centrifugation at 100 g for 5 min. The media was removed for analysis, cell pellet was washed with fresh media and cells collected by centrifugation. The concentration of analytes in the cells and media was determined by dividing the amount of the analyte by the volume of cells (3.9 μL per 1×10⁶ cells) [25] or media, respectively.
For IC50 determination, incubations were performed at 37°C in protein-free Krebs-Henseleit buffer containing 1×10⁵ cells, 1 μM dextromethorphan as the substrate and bupropion, OH-bupropion, threohydrobupropion, or erythrohydrobupropion (0.13–500 μM) in a final volume of 100 μL. Reactions were initiated with the addition of hepatocytes to a pre-warmed mixture of inhibitor and substrate and terminated after 30 min. Linear formation of dextromethorphan and absence of substrate depletion over the incubation time was confirmed.
2.6 Unbound fraction determination
Protein binding of bupropion and its metabolites in plasma or HLM (0.1 mg/mL) was determined in triplicate using ultracentrifugation as described previously [26]. Due to the isomerization of bupropion, racemic bupropion was added to plasma or HLM and the individual enantiomers were measured. In HLMs, the concentrations of bupropion and its metabolites were around the IC50 values determined towards CYP2D6: 20 μM for bupropion, 6 μM for R,R-OH-bupropion, 15 μM for S,S-OH-bupropion, 12.5 μM for threohydrobupropion and 5 μM for erythrohydrobupropion. For plasma protein binding the concentrations used were around the average steady state concentrations (Css,avg) of bupropion and its metabolites : 0.5 μM for bupropion, 3 μM for R,R-OH-bupropion, 0.2 μM for S,S-OH-bupropion, 2 μM for threohydrobupropion and 0.5 μM (erythrohydrobupropion).
2.7 HepG2 Cell Culture and mRNA analysis
HepG2 cells were cultured in 6-well plates (Corning Life Sciences, Corning, NY) and all experiments were conducted in triplicate. First, to test the effect of bupropion and its metabolites on CYP2D6 mRNA expression, cells were treated with vehicle (0.1% ethanol), bupropion (0.5 μM, 2.5 μM, 5 μM), R,R-OH-bupropion (5 μM, 25 μM, 50 μM), S,S-OH-bupropion (0.5 μM, 2.5 μM, 5 μM), erythrohydrobupropion (0.5 μM, 2.5 μM, 5 μM) or threohydrobupropion (2 μM, 10 μM, 20 μM) for 72 hrs. The concentrations were chosen to be approximately 1, 5 and 10 times the observed Css values following 300 mg/day bupropion dosing. Then to determine the EC50 and Emax values towards CYP2D6 mRNA, cells were treated with vehicle (0.1% ethanol), bupropion (0.25 μM, 0.5 μM, 1 μM, 2.5 μM, 5 μM), S,S-OH-bupropion (0.25 μM, 0.5 μM, 1 μM, 2.5 μM, 5 μM), erythrohydrobupropion (0.5 μM, 1 μM, 2.5 μM, 5 μM, 10 μM) or threohydrobupropion (1 μM, 5 μM, 10 μM, 25 μM, 50 μM) for 72 hrs. Racemic bupropion was used in these experiments due to the rapid chiral inversion of bupropion stereoisomers in in vitro systems. Every 24 hrs, media was aspirated and replaced with new media containing the test compound. At 72 hrs, cells were harvested for mRNA analysis. CYP2D6 and SHP mRNA were quantified using q-RT-PCR (StepOnePlus™, Applied Biosystems, Carlsbad, CA) as previously described [27] using GAPDH as a housekeeping gene. Cells were harvested using Tri-reagent (Invitrogen, Grand Island, NY) and mRNA extracted according to the manufacturer’s recommendations. All samples were analyzed in triplicate. One-way ANOVA with post-hoc Tukey test was used to test for significance of changes in CYP2D6 mRNA and activity in comparison to control.
The concentration-response relationship of downregulation of CYP2D6 in HepG2 cells was quantitatively analyzed using methods adapted from CYP induction analysis [28] and using similar methodology as previously described [29]. For erythrohydrobupropion, S,S-OH-bupropion, threohydrobupropion and bupropion, the CYP2D6 downregulation followed a dose-response relationship, and the maximal fold downregulation (Emax), and the concentration causing 50% of the maximum downregulation (EC50) were estimated using equation 2
| (2) |
in which E is the fraction of the original mRNA expression remaining following treatment with bupropion or its metabolites at a concentration [I], and E0 is the fraction of CYP2D6 mRNA expression in the absence of treatment with bupropion or its metabolites (E0=1). For R,R-OH-bupropion, the relationship between magnitude of downregulation and precipitant concentration was linear over the concentration range used and no Emax and EC50 could be reached within the test concentrations. Therefore the initial downregulation slope was determined using linear regression as previously described [28] according to equation 3.
| (3) |
In vitro constants were calculated using nonlinear least-squares analysis or nonlinear regression analysis in GraphPad Prism (San Diego, CA).
2.8 Western blot analysis
HepG2 cells were cultured in 12-well plates (Corning Life Sciences, Corning, NY) and all experiments were conducted in triplicate. To test the effect of bupropion and its metabolites on CYP2D6 protein expression, cells were treated with vehicle (0.1% ethanol), erythrohydrobupropion (5 μM), threohydrobupropion (20 μM), R,R-OH-bupropion (20 μM), S,S-OH-bupropion (5 μM) or bupropion (5 μM) for 72 hrs. Every 24 hrs, media was aspirated and replaced with new media containing the test compound. At 72 hrs, cells were harvested for protein analysis. Western blot analysis was done to measure CYP2D6 expression with β-actin as aloading control as previously described [27]. In brief, for western blotting, proteins from HepG2 cells were extracted as whole cell extract using whole cell lysis buffer in the presence of protease (Roche Applied Science, Indianapolis, IN) and phosphatase inhibitors (1 mM β-glycerol phosphate, 2.5 mM Na-pyrophosphate, 1 mM Na3VO4). Protein concentrations were measured by BCA protein assay. Whole cell protein extracts were separated by SDS-polyacrylamide gel electrophoresis (NuPAGE-Novex 4–12% polyacrylamide Bis-Tris gel, Life Science Technologies, Carlsbad, CA) and transferred to nitrocellulose membranes. Blots were incubated with primary antibodies against CYP2D6 and β-actin overnight at 4°C. Next day blots were washed and incubated with secondary antibody for one hour at room temperature. Antigen-antibody reactions were detected and quantified using LiCor Odyssey scanner and software (Licor Inc., Lincoln, NE).
2.9 Human Hepatocyte culture and analysis of changes in CYP2D6 mRNA and activity
Cryopreserved human hepatocytes from three donors (3 females, 9, 45 and 59 years of age) were obtained from Xenotech (Lenexa, KS) and cultured as described previously [27]. CYP2D6 activity was measured by formation of dextrorphan from dextromethorphan (1 μM nominal concentration) over a one-hour incubation. For inhibition studies, vehicle (0.01% ethanol) or bupropion and its metabolites were added in triplicate treatments to the media at concentrations approximately 5 times the measured Css,avg [bupropion, erythrohydrobupropion and S,S-OH-bupropion at 2.5 μM, threohydrobupropion at 10 μM and R-R-OH-bupropion at 25 μM]. Racemic bupropion was used in these experiments due to the rapid chiral inversion of bupropion stereoisomers in in vitro systems. Following the 1 hour incubation, the media were analyzed for dextrorphan formation and for bupropion and its metabolite concentrations and the percent decrease in CYP2D6 activity was calculated in comparison to vehicle treated cells. All inhibition studies were conducted in triplicate. To evaluate time dependent changes in CYP2D6 mRNA and activity, plated hepatocytes were treated in triplicate with vehicle or bupropion and its metabolites [bupropion, erythrohydrobupropion, S,S-OH-bupropion at 2.5 μM, threohydrobupropion at 10 μM and R-R-OH-bupropion at 25 μM). Media was changed every 24 hours to replace depleted inhibitors. After 3 days of treatment (71 hours) media was replaced with media containing the inhibitor of interest at the concentrations listed above and dextromethorphan (1 μM), and CYP2D6 activity was measured by dextrorphan formation after a 1 hour incubation. The media was collected for LC-MS/MS analysis of dextrorphan and of bupropion and its metabolites at the end of the incubation, and cells harvested for analysis of CYP2D6, CYP3A4 and CYP1A2 mRNA expression. mRNA was extracted and q-RT-PCR conducted as described above for HepG2 cells. The fold change in CYP2D6, CYP3A4 and CYP1A2 mRNA expression was analyzed by the ΔΔCt method using GAPDH as a housekeeping control.
2.10 Prediction of Decrease in CYP2D6 activity in vivo
DDI risk due to reversible inhibition of CYP2D6 by bupropion and its metabolites was predicted based on steady state concentrations of bupropion enantiomers and their metabolites following a 300 mg/day dose. Due to variable dosing regimens between clinical subjects (150–400 mg/day), bupropion and metabolite concentrations were normalized to 300 mg dose, based on dose independent clearance (linear kinetics). The ratios between the unbound inhibitor concentration ([I]u) and the unbound inhibition constant (Ki,u) were calculated for each precipitant. The net effect of reversible inhibition on CYP2D6 mediated clearance was predicted according to equation 4 accounting for multiple inhibitors as previously described [30,31], and assuming that the in vivo substrate circulates at concentrations ≪ the Km for the substrate towards the inhibited enzyme.
| (4) |
In this equation CLi is the clearance in the presence of n number of inhibitors j, each with concentration [I]u,j and inhibition constant Ki,u,j. The unbound IC50 values were assumed to approximate the Ki,u values since the concentration of dextromethorphan used in the in vitro experiments was well below the reported Km value for CYP2D6 ([S]≪Km) [31]. It has been previously shown that this assumption is applicable for predicting the inhibition by multiple reversible inhibitors regardless of the mechanism (competitive or noncompetitive) of inhibition [30].
The fraction of CYP2D6 expression remaining in vivo following exposure to bupropion and its metabolites was first predicted for each of the compounds downregulating CYP2D6 alone using the data obtained in HepG2 cells based on the Emax and EC50 values according to equation 5 [29]:
| (5) |
in which Emax is the maximum fold decrease in CYP2D6 mRNA observed in HepG2 cells, [I]u is the unbound concentration of each of the compounds in plasma at steady state and EC50 is the concentration of each of the compounds in HepG2 cells that achieved 50% of the maximum downregulation.
The overall reduction in CYP2D6 activity following dosing of 300 mg/day of bupropion to steady state was predicted using a calculation adapted from previous methods of predicting magnitude of clearance changes for a probe in situations with simultaneous CYP induction together with CYP inhibition [32,33]. Previous modeling studies have not addressed the effect of multiple inducers and downregulators simultaneously affecting CYP expression. Therefore, we adapted the downregulation dose-response model (equation 5) to account for multiple effectors, assuming that each effector binds independently and non-cooperatively to a common receptor. To derive the equation for multiple effectors, let m be the number of distinct effectors, Emax,k be the maximum fold decrease in CYP2D6 mRNA due to saturating concentration of effector k, EC50,k be the concentration of effector k that causes half-maximal fold decrease, and [I]u,k the unbound concentration of effector k. We assume that the putative receptor may be unliganded (free), or bound to any one of the m effectors. Under this framework, the overall fraction of CYP2D6 expression remaining is equal to the average of the residual expression for each state of the receptor (1 for free receptor, or (1 – Emax,k) for the receptor bound to effector k), weighted by the relative occupancy of that state (1 for free receptor, or [I]u,k/EC50,k for the receptor-effector k complex). This provides the straightforward extension of equation 5 that accounts for simultaneous downregulation by multiple effectors operating via a common receptor:
| (6) |
Substituting the relationships for multiple inhibitors (equation 4) and multiple effectors (equation 6) into the original equation published for simultaneous induction and inhibition [32] yields equation 7, which predicts the net effect on clearance due to n reversible inhibitors (with [I]u,j and Ki,u,j referring to inhibitor j) and downregulation by m independent effectors (with Emax,k, [I]u,k and EC50,k referring to effector k).
| (7) |
For this equation it is assumed that the in vivo substrate with the above CL circulates at concentrations well below the Km value for the inhibited enzyme.
3. Results
3.1 Stereoselective inhibition of CYP2D6 by bupropion and its metabolites in HLMs
R- and S-bupropion, R,R-OH-bupropion, S,S-OH-bupropion, threohydrobupropion and erythrohydrobupropion inhibited CYP2D6 in HLMs with IC50 values between 3 and 40 μM (Figure 2 and Table 1), with S-bupropion, erythrohydrobupropion and R,R-OH-bupropion being the most potent inhibitors of CYP2D6 in vitro. 4′OH-bupropion, threo-4′OH-bupropion and erythro-4′OH-bupropion had no effect on CYP2D6 activity at 50 μM concentration suggesting these metabolites do not inhibit CYP2D6. The inhibition of CYP2D6 by bupropion and its metabolites was highly stereoselective. S-bupropion was 14-fold more potent than R-bupropion based on the IC50 values and R,R-OH-bupropion was 3-fold more potent than S,S-OH-bupropion in inhibiting CYP2D6 (Table 1). Similarly, erythrohydrobupropion was nearly 10-fold more potent than threohydrobupropion as a CYP2D6 inhibitor.
Figure 2. Reversible CYP2D6 inhibition by bupropion and its metabolites in human liver microsomes.

The percent dextrorphan formation remaining in comparison to control as a function of increasing concentrations of inhibitors is shown. The line shows the fit of equation 1, to the data. Dextromethorphan was incubated in HLMs with (a) S-bupropion, (b) S,S-OH-bupropion, (c) erythrohydrobupropion, (d) R-bupropion, (e) R,R-OH-bupropion, and (f) threohydrobupropion. The incubations and data fitting was conducted as described in material and methods. All experiments were conducted in triplicate and the standard deviation is shown as the error bar. At some concentrations error bars are not visible as the standard deviation was smaller than the size of the symbol.
Table 1.
In vitro CYP2D6 inhibition parameters for bupropion and its metabolites measured in HLMs and the predicted magnitude of CYP2D6 inhibition based on steady state concentration measured in study subjects.
| IC50,u, μMa Mean (95% C.I.) | Mean [I], μMb (Range, n=5) | fu,p (S.D. n=3) | Meanc [I]u/IC50,u (range) | Predicted % Inhibition (Range) | |
|---|---|---|---|---|---|
| R-Bupropion | 41 (32–53) | 0.22 (0.05–0.34) | 0.5±0.1 | 0.003 (0.001–0.004) | 0.3 (0.07–0.36) |
| S-Bupropion | 3 (2–4) | 0.08* (0.02–0.11) | 0.6±0.1 | 0.015 (0.004–0.022) | 1.5 (0.35–2.1) |
| R,R-OH-bupropion | 5 (3–8) | 5.0 (3.0–9.4) | 0.5±0.1 | 0.504 (0.299–0.941) | 34 (23–48) |
| S,S-OH-bupropion | 14 (9–21) | 0.39* (0.26–0.67) | 0.5±0.1 | 0.014 (0.009–0.024) | 1.4 (0.9–2.3) |
| Threo-hydrobupropion | 13 (8–21) | 2.1 (1.1–3.5) | 1.0±0.1 | 0.160 (0.084–0.256) | 13.5 (2.7–20) |
| Erythro-hydrobupropion | 3 (3–4) | 0.29 (0.19–0.41) | 0.7±0.1 | 0.07 (0.043–0.096) | 6.2 (4.1–8.8) |
| 4′OH-bupropion | >50μM | 0.01 | <0.0002 | - | |
| Threo/erythro-4′OH-hydrobupropion | >50μM | 0.04 | <0.0007 | - | |
| Total | 0.77 (0.44–1.34) | 43 (31–57) |
No nonspecific protein binding was observed for any of the compounds in 0.1 mg/mL HLM, hence the total IC50 values were considered equivalent to the unbound IC50 values.
Mean values from 5 subjects normalized to 300 mg/day dose are shown.
The mean [I]u/IC50,u for the 5 subjects is shown together with the range of the ratios in the 5 subjetcs.
Significantly different from the other enantiomer, P<0.05, Student’s t test.
In order to predict the in vivo inhibition of CYP2D6 by the stereoisomers of bupropion and its metabolites, the steady state concentrations of R- and S-bupropion and R,R- and S,S-OH-bupropion were measured together with threo- and erythrohydrobupropion and the 4′OH-metabolites in 5 patients (Table 1). As the reported clinical DDI studies with bupropion as the precipitant were done with 300 mg/day dose of bupropion, the measured plasma concentrations were normalized to a 300 mg/day dose assuming linear kinetics of bupropion (Table 1). At steady state, the average R-bupropion concentrations were 2.8-fold higher (p<0.05) than S-bupropion, and R,R-OH-bupropion concentrations were 13-fold higher than those of S,S-OH-bupropion (p<0.05) confirming the stereoselective disposition (Table 1). Similarly, threohydrobupropion concentrations were 7.2-fold higher than erythrohydrobupropion average steady state concentrations. R,R-OH-bupropion was the most abundant species in circulation followed by threohydrobupropion. S,S-OH-bupropion, erythrohydrobupropion and R-bupropion circulated at similar concentrations, about 6-fold lower than threohydrobupropion and 3-fold higher than S-bupropion. The plasma concentrations of the 4′OH-metabolites had the lowest circulating concentrations 2–8 fold lower than S-bupropion.
Using the measured steady state unbound plasma concentrations of bupropion and its metabolites and the unbound stereoselective IC50 values, the CYP2D6 inhibition in vivo by each of the compounds was predicted (Table 1). Due to their high circulating concentrations, R,R-OH-bupropion and threohydrobupropion were predicted to result in the highest in vivo CYP2D6 inhibition, 34% and 14% inhibition, respectively. In comparison, the predicted inhibition by the other compounds was negligible 0.3–6.2% (Table 1). Considering all of the compounds together a net 43% (31–57%) inhibition of CYP2D6 in vivo was predicted allowing identification of the in vivo DDI. However, this inhibition prediction suggests only weak CYP2D6 inhibition in vivo (less than 2-fold AUC change for any CYP2D6 substrate), representing a greater than 5-fold underprediction of the in vivo DDI.
3.2 Inhibition of CYP2D6 by bupropion and its metabolites in human suspension hepatocytes, and partitioning of bupropion and its metabolites into hepatocytes
To determine whether the underprediction of in vivo CYP2D6 inhibition could be due to higher unbound concentrations of bupropion and its metabolites in hepatocytes than those predicted from unbound plasma concentrations, CYP2D6 inhibition and cell partitioning of bupropion and its metabolites were assessed in human suspension hepatocytes. The IC 50 values in suspension hepatocytes based on media concentrations were 13 μM (95% C.I.:10–18 μM) for bupropion, 6.6 μM (95% C.I.:3.0–14 μM) for OH-bupropion, 8.7 μM (95% C.I.:6.5–12 μM) for threohydrobupropion and 2.9 μM (95% C.I.: 2.3–3.7 μM) for erythrohydrobupropion (Figure 3), and not different from the IC50 values measured in HLMs. However, the total measured concentrations of bupropion and its metabolites were much greater in the cells than in media. Bupropion had a cell concentration 20-fold higher than that in the medium, OH-bupropion and threohydrobupropion concentrations were 11-fold higher in the cells than in medium and erythrohydrobupropion was 9-fold higher in cells than in medium (data not shown). Yet, due to the small overall volume of the cells, the high partitioning did not significantly decrease the medium concentrations of the inhibitors and medium concentrations were equal to the nominal concentrations added.
Figure 3. Reversible CYP2D6 inhibition by bupropion and its metabolites in human suspension hepatocytes.

The percent of control dextrorphan formation remaining following incubation of dextromethorphan in the presence of multiple concentrations of (a) bupropion, (b) OH-bupropion, (c) erythrohydrobupropion, and (d) threohydrobupropion is shown. The incubations were conducted as described in material and methods. All experiments were conducted in triplicate and the standard deviation is shown as the error bar. The points show the experimental data. At some concentrations error bars are not visible as the standard deviation was smaller than the size of the symbol. The lines show the fit of equation 1, to the data.
3.3 Effects of bupropion and its metabolites on CYP2D6 mRNA in HepG2 cells
To test whether bupropion and its metabolites alter CYP2D6 mRNA expression, HepG2 cells were treated with bupropion and its metabolites at 3–5 different concentrations. Bupropion and all of its metabolites decreased CYP2D6 mRNA expression significantly in a dose-dependent manner (Figure 4). The downregulation of CYP2D6 by bupropion, S,S-OH-bupropion, threohydrobupropion and erythrohydrobupropion followed a classic dose-response relationship, while a liner relationship between precipitant concentration and CYP2D6 mRNA decrease was observed for R,R-OH-bupropion. Based on the EC50 values, bupropion (EC50 0.21 μM) and S,S-OH-bupropion (EC50 0.20 μM) were the most potent compounds in downregulating CYP2D6 resulting in a maximum 85–88% decrease in CYP2D6 mRNA (Figure 4). Erythrohydrobupropion was slightly less potent (EC50 1.11 μM) but resulted in a similar maximum 85 % downregulation of CYP2D6. Threohydrobupropion was 10–50 fold less potent in downregulating CYP2D6 mRNA (EC50 9.95 μM) but reached similar maximum downregulation (78%) as the other compounds. Of the tested compounds R,R-OH-bupropion had the weakest effect on CYP2D6 mRNA, and compound solubility and cell toxicity prevented measurement of EC50 and Emax for R,R-OH-bupropion.
Figure 4. Effects of bupropion and its metabolites on CYP2D6 and SHP mRNA in HepG2 cells.

CYP2D6 mRNA levels in HepG2 cells exposed to multiple concentrations of (A) erythrohydrobupropion, (B) threohydrobupropion, (C) R,R-OH-bupropion, (D) S,S-OH-bupropion and (E) bupropion are shown. The points show the measured effect with its standard deviation and the line shows the fit of equation 2, to the data. For R,R-OH-bupropion solubility limitations prevent measurement of dose-response relationship and hence the line shows the fit of equation 3, E = E0 − slope × [I] to the data. Representative CYP2D6 protein expression blot image is shown in panel F and the quantification of the signal intensity in the western blots is shown in panel G. Panel H shows the fold change in SHP mRNA levels in HepG2 cells following 72 hours of treatment with bupropion (bup 0.5 μM, 2.5 μM, 5 μM), R,R-OH-bupropion (R,R-OH, 5 μM, 25 μM, 50 μM), S,S-OH-bupropion (S,S-OH 0.5 μM, 2.5 μM, 5 μM), erythrohydrobupropion (erythro 0.5 μM, 2.5 μM, 5 μM) or threohydrobupropion (threo 2 μM, 10 μM, 20 μM). *P<0.05, compared to vehicle control cells and # P<0.05, compared to all other groups based on one-way ANOVA with post-hoc Tukey test. All experiments were conducted in triplicate and the standard deviation is shown as the error bar.
The downregulation of CYP2D6 mRNA was in excellent correlation with the effects of bupropion and its metabolites on CYP2D6 protein (Figure 4). S,S-OH-bupropion and bupropion had the greatest effect on CYP2D6 protein expression (>50% downregulation) with erythrohydrobupropion being slightly less effective. Threohydorobupropion yielded similar effects on protein expression as erythrohydrobupropion but only at 4-fold higher concentrations. As predicted from the mRNA data, R,R-OH-bupropion had no effect on CYP2D6 protein expression at the concentrations tested (Figure 4). To test whether the down-regulation of CYP2D6 by bupropion is due to similar mechanisms as has been described with all-trans retinoic acid [34], the possible induction of the small heterodimer partner (SHP) was evaluated with each precipitant. Bupropion and its metabolites had no effect on SHP mRNA at any of the concentrations tested (Figure 4).
3.4 Prediction of in vivo decrease of CYP2D6 activity by mixed mechanisms by bupropion and its metabolites
The overall effect of bupropion and its metabolites on CYP2D6 activity in vivo was predicted using static IVIVE methods that incorporate multiple precipitants and simultaneous CYP2D6 inhibition and downregulation. Based on the CYP2D6 downregulation in HepG2 cells and the circulating concentrations of bupropion and its metabolites at steady state following 300 mg/day dosing, bupropion was predicted to result in 52 % decrease in CYP2D6 mRNA, erythrohydrobupropion in 18 % decrease, threohydrobupropion in 14 % decrease, and S,S-OH-bupropion in 56 % decrease in CYP2D6 mRNA if any of these compounds acted alone at steady state. R,R-OH-bupropion is not predicted to affect CYP2D6 expression at steady state based on the weak downregulation of CYP2D6 mRNA by R,R-OH-bupropion in HepG2 cells and the lack of effect of R,R-OH-bupropion on CYP2D6 protein expression. The combination of all compounds assuming they all act via the same mechanism and hence may compete for binding to the same nuclear receptor, was predicted to result in an overall 68% decrease in CYP2D6 expression at steady state. Based on the reversible inhibition kinetics, an overall 43% inhibition of CYP2D6 was predicted at steady state of bupropion (Table 1) when all inhibitors are accounted for. When the reversible inhibition and the downregulation effects were both accounted for in DDI predictions, an 82% decrease in CYP2D6 activity was predicted following bupropion dosing at 300 mg/day to steady state.
3.5 Effects of bupropion and its metabolites on CYP2D6 mRNA and activity in human hepatocytes
To confirm the effects of bupropion and its metabolites on CYP2D6 activity and expression, plated human hepatocytes from three donors were treated with bupropion and its metabolites, and CYP2D6 activity and mRNA expression were evaluated. CYP2D6 activity was measured in a 1 hr incubation without a pre-treatment and then again after 72 hours of treatment with bupropion or its metabolites. During the one-hour incubations at 1 and 72 hours, 30–50 % depletion of bupropion and its metabolites was observed (Table 2), but the concentrations remained above observed circulating concentrations. There was no difference in the medium concentrations of bupropion and its metabolites between the 1 hr and 72 hr time point incubations (Table 2). Although the medium concentrations of each precipitant were 3–5 times higher than those observed in circulation, the inhibition of CYP2D6 observed in the 1 hr incubations without pretreatment was much smaller in magnitude than the 90 % inhibition of CYP2D6 activity observed in vivo (Table 2). In contrast, after the 72 hr pretreatment, the inhibition of CYP2D6 (60–93%, Table 2) approached that observed in vivo. Interestingly, the apparent inhibition of CYP2D6 observed after treatment of the hepatocytes for 72 hours with bupropion or its metabolites was much greater than that observed after 1 hour despite the lack of any changes in the concentrations of bupropion and its metabolites in cell medium, suggesting time dependent changes in CYP2D6 expression and/or activity during bupropion and metabolite treatment. When CYP2D6 mRNA expression was assessed in the plated hepatocytes following 72 hours of treatment, bupropion and its metabolites significantly (P<0.05) decreased CYP2D6 mRNA expression (Figure 5). The mean CYP2D6 mRNA levels were 20% (erythrohydrobupropion), 18% (threohydrobupropion), 28% (R,R-OH-bupropion), 26% (S,S-OH-bupropion) and 15% (Bupropion) of the mRNA levels in vehicle treated cells (Figure 5, Table 2). In comparison, no decrease in CYP3A4 or CYP1A2 mRNA was observed following any of the treatments (Figure 5), and in one donor R,R-OH-bupropion treatment significantly increased CYP3A4 mRNA, demonstrating that the mRNA downregulation by bupropion and its metabolites is a CYP2D6 specific phenomenon. During the treatment, no significant differences were observed between the initial media concentrations added and the media concentrations at the end of the pretreatment except for bupropion (93% reduction) and R,R-OH-bupropion (33% reduction) (data not shown). In bupropion treated cells, formation of bupropion metabolites was also detected in accordance with the significant depletion of bupropion, but the concentrations of erythrohydrobupropion (0.08 μM), threohydrobupropion (1.4 μM), and OH-bupropion (0.12 μM) remained lower than those observed in circulation or used in the treatments with these metabolites.
Table 2.
Inhibition of CYP2D6 by bupropion and its metabolites in plated human hepatocytes. The initial treatment concentrations were 2.5 μM for bupropion, erythrohydrobupropion and S,S-OH-bupropion, 10 μM for threohydrobupropion and 25 μM for R-R-OH-bupropion at time 0 and at time 71 hours.
| Treatment | Ctreatment (μM) | Cmedia at 1 hr (μM) | Percent Inhibition at 1hr | Cmedia at 72 hr (μM) | Apparent Percent Inhibition at 72 hrs | % decrease in CYP2D6 mRNA at 72 hrs | Predicted % decrease in CYP2D6 activity at 72 hrsa |
|---|---|---|---|---|---|---|---|
| Bupropion | 2.5 | 1.5 ± 0.5 | 37 ± 16 | 1.7 ± 0.5 | 81 ± 5 | 85% | 90% |
| R,R-OH-bupropion | 25 | 16 ± 1 | 63 ± 8 | 19 ± 3 | 83 ± 3 | 72% | 90% |
| S,S-OH-bupropion | 2.5 | 1.3 ± 0.1 | 22 ± 16 | 1.5 ± 0.2 | 60 ± 11 | 74% | 80% |
| Threo-hydrobupropion | 10 | 7.1 ± 0.6 | 80 ± 2 | 8.2 ± 1.4 | 92 ± 2 | 82% | 96% |
| Erythro-hydrobupropion | 2.5 | 1.6 ± 0.1 | 81 ± 2 | 2.1 ± 0.3 | 93 ± 1 | 80% | 96% |
The overall decrease in CYP2D6 activity at 72 hours was predicted from the observed reversible inhibition at 1 hour and the observed decrease in CYP2D6 mRNA at 72 hrs
Figure 5. CYP2D6 specific downregulation of mRNA expression by bupropion and its metabolites in plated human hepatocytes.
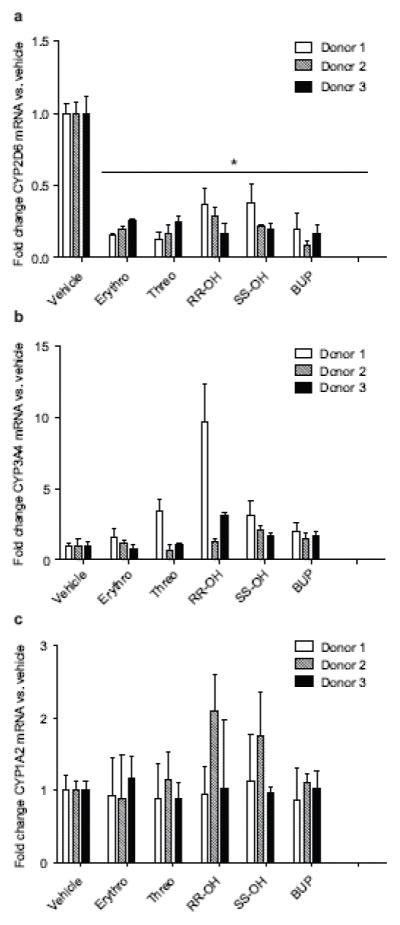
Fold change in (a) CYP2D6, (b) CYP3A4 and (c) CYP1A2 mRNA expression in comparison to vehicle treated controls following 72 hour treatment of plated human hepatocytes from three donors with erythrohyrobupropion (Erythro), threohydrobupropion (Threo), bupropion (Bup), R,R-OH-bupropion (R,R-OH) or S,S-OH-bupropion (S,S-OH) at concentrations approximately 5 times steady state concentrations as described in methods section. *P<0.05, compared to vehicle control cells. All experiments were conducted in triplicate and the standard deviation is shown as the error bar.
To determine whether the downregulation of CYP2D6 mRNA could quantitatively explain the up to 3-fold increase in apparent inhibition of CYP2D6 by bupropion and its metabolites at 72 hrs in comparison to 1 hr in the plated hepatocytes, the overall decrease in CYP2D6 activity at 72 hrs was predicted based on the observed inhibition by the individual compounds at 1 hr and the observed decrease in CYP2D6 mRNA. The observed decrease in CYP2D6 activity at 72 hrs was well predicted using the 1 hr activity data and downregulation of mRNA with a mild 3–20% overprediction of the effects (Table 2). This mild overprediction is likely due to the longer CYP2D6 protein half-life in comparison to the mRNA half-life.
4. Discussion
The DDI liability of bupropion has been attributed to its circulating metabolites, as the inhibitory potency of bupropion towards CYP2D6 in vitro does not identify the in vivo DDI risk [4,11]. However, even when the metabolites are accounted for in DDI predictions, the in vivo CYP2D6 inhibition is greatly underpredicted suggesting that other unknown processes in addition to reversible inhibition contribute to the decrease in CYP2D6 activity following bupropion dosing. No prior study has evaluated the stereoselective CYP2D6 inhibition or regulation of CYP2D6 mRNA by bupropion and its metabolites, and whether incorporating stereoselective disposition, CYP2D6 inhibition and regulation would improve DDI predictions or alter the identification of the main inhibitory species.
The disposition of bupropion and OH-bupropion showed considerable stereoselectivity following chronic dosing of bupropion. Qualitatively this finding is consistent with previous data demonstrating stereoselective disposition of bupropion and OH-bupropion following a single oral dose [18,35]. However, the differences between the stereoisomers were smaller in this study than in previous single dose studies. The R/S bupropion AUC ratio has been reported to be 2.9–6.3 following single dose [18,35], but an R/S-ratio of 2.8 was observed in this study at steady state. Similarly, an R,R-OH-bupropion to S,S-OH-bupropion ratio of 44–65 has been observed previously based on single dose AUCs [18,35], yet over 4-fold lower R,R/S,S-OH-bupropion ratio of 13 was observed in this study. It is possible that differences in single dose versus multiple dose disposition are responsible for these differences and larger studies are warranted to further establish the stereoselective disposition of bupropion following multiple dosing.
CYP2D6 inhibition by bupropion and OH-bupropion was found to be stereoselective resulting in different contributions of the stereoisomers to CYP2D6 inhibition in vivo. S-bupropion, despite its 3-fold lower circulating concentrations had a 5-fold higher I/Ki than R-bupropion due to the 14-fold more potent inhibition of CYP2D6 by S-bupropion than R-bupropion. R,R-OH-bupropion was 3-fold more potent inhibitor of CYP2D6 than S,S-OH-bupropion, and due to the 13-fold higher steady state concentration of R,R-OH-bupropion in comparison to S,S-OH-bupropion it had a 36-fold higher I/Ki. In fact, R,R-OH-bupropion had the highest I/Ki value of all the compounds, 0.5, and over half (65%) of the CYP2D6 inhibition in vivo was predicted to be caused by R,R-OH-bupropion. In previous studies, threohydrobupropion has been considered to be responsible for majority of the CYP2D6 inhibition [11]. However, the stereoselective data shown here demonstrates that in fact threohydrobupropion accounts only for approximately 21% and erythrohydrobupropion another 9% of the CYP2D6 inhibition in vivo. The differences between the relative contributions of the inhibitors between current study and previous work are likely due to the stereoselective CYP2D6 inhibition and bupropion disposition. The Ki-values measured before for racemic bupropion and OH-bupropion [11] are in good agreement with the mean values of the stereoisomers observed here. While erythrohydrobupropion was previously found to be the most potent CYP2D6 inhibitor in vitro, the stereoselective analysis shows that it has similar potency with R,R-OH-bupropion and S-bupropion. Of note, only threohydrobupropion and R,R-OH-bupropion I/Ki values were higher than the 0.1 cutoff for DDI risk assessment, demonstrating the necessity of stereoselective DDI assessment of chiral drugs. Finally, the novel 4′OH-metabolites of bupropion, threohydrobupropion and eythrohydobupropion did not inhibit CYP2D6 at clinically relevant concentrations demonstrating that these metabolites are unlikely to contribute to in vivo CYP2D6 inhibition. Overall, consistent with previous work, even after accounting for all the metabolite contributions, only weak in vivo CYP2D6 inhibition is predicted based on the reversible CYP2D6 inhibition, resulting in a significant underprediction of the DDI potential of bupropion.
Hepatic partitioning of the inhibitory species has been proposed as an explanation for the underprediction of the bupropion DDIs. In agreement with previous work that demonstrated hepatic partitioning of radioactivity following administration of labeled bupropion and OH-bupropion in rats [11], significant partitioning of bupropion and its metabolites into human hepatocytes was observed in this study. Yet, the IC50 values in suspension hepatocytes were not different from those observed in human liver microsomes in this study and were nearly identical to the Ki values measured in HLMs previously [11]. This suggests that high nonspecific binding to the hepatocyte protein or sequestration to intracellular organelles rather than active uptake of bupropion into hepatocytes is responsible for the high liver partitioning. Taken together these findings show that reversible inhibition of CYP2D6 by bupropion and its metabolites cannot explain the in vivo CYP2D6 DDIs.
It has been generally believed that CYP2D6 is not inducible by xenobiotics and hence CYP2D6 induction is typically not evaluated in DDI screening workflows. However, it has been shown that CYP2D6 expression and activity are significantly increased during pregnancy [34,36], and this increase has been proposed to be related to changes in retinoic acid concentrations during pregnancy [34,37]. Importantly, retinoic acid and the farnesoid X receptor agonist GW4064 have been shown to downregulate CYP2D6 transcription via increasing the expression of SHP [23,34], demonstrating that transcriptional regulation of CYP2D6 by xenobiotics is possible. Based on these findings, the possible suppression of CYP2D6 mRNA by bupropion and its metabolites was evaluated in this study. In both HepG2 cells and human hepatocytes bupropion and its metabolites were shown to significantly suppress CYP2D6 transcription and the dose-response data together with steady state concentrations predict that in vivo, following bupropion dosing, CYP2D6 mRNA expression will be decreased by 68%. However, bupropion and its metabolites had no effect on SHP mRNA demonstrating that bupropion and its metabolites regulate CYP2D6 mRNA expression by a novel mechanism. Importantly, no effect of bupropion and its metabolites on the mRNA of CYP3A4 and CYP1A2 was observed in human hepatocytes demonstrating that the observed downregulation is CYP2D6 specific. Overall, the downregulation of CYP2D6 mRNA by bupropion and its metabolites together with the competitive inhibition appears to explain the observed in vivo decrease in CYP2D6 activity. The predicted 82% decrease in CYP2D6 activity in vivo after bupropion dosing is in excellent agreement with the observed approximately 90% decrease in CYP2D6 activity. It is, however, noteworthy that this prediction requires consideration of reversible inhibition and CYP2D6 downregulation by bupropion and its metabolites, and that bupropion and its metabolites are assumed to downregulate CYP2D6 expression via the same receptor. Further studies characterizing the mechanism of how bupropion and its metabolites regulate CYP2D6 are needed to fully demonstrate the interactions between bupropion and its metabolites in regulating CYP2D6. Regardless, as both S,S-OH-bupropion and bupropion alone are predicted to decrease CYP2D6 mRNA by about 50%, CYP2D6 downregulation is likely to be a major component in the in vivo observed decrease in CYP2D6 activity following bupropion dosing. Also in agreement with the prediction, in the plated human hepatocytes the observed CYP2D6 inhibition was significantly greater after 72 hours of treatment with bupropion or its metabolites than in the absence of pretreatment, despite the fact that the concentrations of bupropion and its metabolites were similar in the inhibition experiments. This increase in apparent CYP2D6 inhibition could be quantitatively explained by the decrease in CYP2D6 mRNA expression and it is expected that similar phenomenon occurs in vivo. It should be noted, however, that it is possible that CYP2D6 protein half-life is longer that the hepatocytes treatment period and that the activity measurement might not be done at protein steady state.
To the best of our knowledge, this is the first example of a xenobiotic causing a drug-drug interaction via CYP2D6 down-regulation. At present there are no examples of clinical DDIs resulting from down-regulation of any CYP enzyme by an approved drug, although downregulation of CYP2B6 by an investigational compound has been reported [29]. Current FDA and EMA guidance recommend induction studies with CYP1A2, CYP3A4 and CYP2B6, and CYP2C in some cases, and the EMA also acknowledges that concentration dependent down-regulation of CYPs could be monitored in the same system. However, down-regulation appears to not be systematically assessed in current drug development workflows. Critically, evaluation of CYP2D6 induction is not recommended as CYP2D6 is not considered to be inducible by xenobiotics. The data presented here suggests that systematic evaluation of CYP downregulation and CYP2D6 regulation by xenobiotics is warranted, to determine whether bupropion is a unique example of a xenobiotic that can cause CYP2D6 downregulation or there are other xenobiotics that downregulate (or induce) CYP2D6 expression.
In conclusion, this study shows that bupropion and its metabolites inhibit CYP2D6 stereoselectively and the different enantiomers have significantly different contributions to in vivo DDIs. However, this study clearly demonstrates that reversible inhibition alone is not sufficient to explain observed decreases in CYP2D6 activity following bupropion dosing. The results of this study show that bupropion and its metabolites downregulate CYP2D6 mRNA expression and that this downregulation together with the reversible inhibition can quantitatively predict and explain the observed DDIs between bupropion and CYP2D6 substrates. Taken together this study shows that down-regulation of CYPs including CYP2D6 can result in potent in vivo DDIs with major clinical consequences and further studies in this area are needed.
Acknowledgments
Grant support:
This work was funded by grants P01DA032507 and T32 GM007750 from the National Institutes of Health.
Abbreviations
- AUC
Area under plasma concentration time curve
- CYP
cytochrome P450
- DDI
drug-drug interaction
- fm
fraction metabolized
- IVIVE
in vitro to in vivo extrapolation
- SHP
small heterodimer partner
Footnotes
Conflict of Interest statement:
None of the authors have any conflicts of interest with the current work.
Publisher's Disclaimer: This is a PDF file of an unedited manuscript that has been accepted for publication. As a service to our customers we are providing this early version of the manuscript. The manuscript will undergo copyediting, typesetting, and review of the resulting proof before it is published in its final citable form. Please note that during the production process errors may be discovered which could affect the content, and all legal disclaimers that apply to the journal pertain.
Bibliography
- 1.Bohnert T, Patel A, Templeton I, Chen Y, Lu C, Lai G, Leung L, Tse S, Einolf HJ, Wang YH, Sinz M, Stearns R, Walsky R, Geng W, Sudsakorn S, He L, Wahlstrom J, Keirns J, Narayanan R, Lang D, Yang X. Evaluation of a New Molecular Entity as a Victim of Metabolic Drug-Drug Interactions - an Industry Perspective. Drug Metab Dispos. 2016 doi: 10.1124/dmd.115.069096. [DOI] [PubMed] [Google Scholar]
- 2.Zhang L, Reynolds KS, Zhao P, Huang S-M. Drug interactions evaluation: An integrated part of risk assessment of therapeutics. Toxicol Appl Pharmacol. 2010;243:134–145. doi: 10.1016/j.taap.2009.12.016. [DOI] [PubMed] [Google Scholar]
- 3.Vieira MLT, Kirby B, Ragueneau-Majlessi I, Galetin A, Chien JYL, Einolf HJ, Fahmi OA, Fischer V, Fretland A, Grime K, Hall SD, Higgs R, Plowchalk D, Riley R, Seibert E, Skordos K, Snoeys J, Venkatakrishnan K, Waterhouse T, Obach RS, Berglund EG, Zhang L, Zhao P, Reynolds KS, Huang S-M. Evaluation of various static in vitro-in vivo extrapolation models for risk assessment of the CYP3A inhibition potential of an investigational drug. Clin Pharmacol Ther. 2014;95:189–98. doi: 10.1038/clpt.2013.187. [DOI] [PubMed] [Google Scholar]
- 4.Yeung CK, Fujioka Y, Hachad H, Levy RH, Isoherranen N. Are circulating metabolites important in drug-drug interactions?: Quantitative analysis of risk prediction and inhibitory potency. Clin Pharmacol Ther. 2011;89:105–113. doi: 10.1038/clpt.2010.252. [DOI] [PMC free article] [PubMed] [Google Scholar]
- 5.Grimm SW, Einolf HJ, Hall SD, He K, Lim H-K, Ling K-HJ, Lu C, Nomeir AA, Seibert E, Skordos KW, Tonn GR, Van Horn R, Wang RW, Wong YN, Yang TJ, Obach RS. The Conduct of in Vitro Studies to Address Time-Dependent Inhibition of Drug-Metabolizing Enzymes: A Perspective of the Pharmaceutical Research and Manufacturers of America. Drug Metab Dispos. 2009;37:1355–1370. doi: 10.1124/dmd.109.026716. [DOI] [PubMed] [Google Scholar]
- 6.Giacomini KM, Huang S-M, Tweedie DJ, Benet LZ, Brouwer KLR, Chu X, Dahlin A, Evers R, Fischer V, Hillgren KM, Hoffmaster KA, Ishikawa T, Keppler D, Kim RB, Lee CA, Niemi M, Polli JW, Sugiyama Y, Swaan PW, Ware JA, Wright SH, Wah Yee S, Zamek-Gliszczynski MJ, Zhang L. Membrane transporters in drug development. Nat Rev Drug Discov. 2010;9:215–236. doi: 10.1038/nrd3028. [DOI] [PMC free article] [PubMed] [Google Scholar]
- 7.Einolf HJ, Chen L, Fahmi OA, Gibson CR, Obach RS, Shebley M, Silva J, Sinz MW, Unadkat JD, Zhang L, Zhao P. Evaluation of various static and dynamic modeling methods to predict clinical CYP3A induction using in vitro CYP3A4 mRNA induction data. Clin Pharmacol Ther. 2014;95:179–88. doi: 10.1038/clpt.2013.170. [DOI] [PubMed] [Google Scholar]
- 8.Patel K, Allen S, Haque MN, Angelescu I, Baumeister D, Tracy DK. Bupropion: a systematic review and meta-analysis of effectiveness as an antidepressant. Ther Adv Psychopharmacol. 2016;6:99–144. doi: 10.1177/2045125316629071. [DOI] [PMC free article] [PubMed] [Google Scholar]
- 9.Carroll FI, Blough BE, Mascarella SW, Navarro Ha, Lukas RJ, Damaj MI. Bupropion and bupropion analogs as treatments for CNS disorders. 1. Elsevier Inc; 2014. [DOI] [PubMed] [Google Scholar]
- 10.Apovian CM. Naltrexone/bupropion for the treatment of obesity and obesity with Type 2 diabetes. Future Cardiol. 2016;12:129–38. doi: 10.2217/fca.15.79. [DOI] [PubMed] [Google Scholar]
- 11.Reese MJ, Wurm RM, Muir KT, Generaux GT, St John-Williams L, Mcconn DJ. An in Vitro Mechanistic Study to Elucidate the Desipramine/Bupropion Clinical Drug-Drug Interaction. Drug Metab Dispos. 2008;36:1198–1201. doi: 10.1124/dmd.107.020198. [DOI] [PubMed] [Google Scholar]
- 12.Newton TF, Roache JD, De La Garza R, Fong T, Wallace CL, Li S-H, Elkashef A, Chiang N, Kahn R. Safety of intravenous methamphetamine administration during treatment with bupropion. Psychopharmacology (Berl) 2005;182:426–35. doi: 10.1007/s00213-005-0102-8. [DOI] [PubMed] [Google Scholar]
- 13.Kennedy SH, McCann SM, Masellis M, McIntyre RS, Raskin J, McKay G, Baker GB. Combining bupropion SR with venlafaxine, paroxetine, or fluoxetine: a preliminary report on pharmacokinetic, therapeutic, and sexual dysfunction effects. J Clin Psychiatry. 2002;63:181–6. doi: 10.4088/jcp.v63n0302. [DOI] [PubMed] [Google Scholar]
- 14.Kotlyar M, Brauer LH, Tracy TS, Hatsukami DK, Harris J, Bronars CA, Adson DE. Inhibition of CYP2D6 activity by bupropion. J Clin Psychopharmacol. 2005;25:226–9. doi: 10.1097/01.jcp.0000162805.46453.e3. [DOI] [PubMed] [Google Scholar]
- 15.Brøsen K, Hansen JG, Nielsen KK, Sindrup SH, Gram LF. Inhibition by paroxetine of desipramine metabolism in extensive but not in poor metabolizers of sparteine. Eur J Clin Pharmacol. 1993;44:349–55. doi: 10.1007/BF00316471. [DOI] [PubMed] [Google Scholar]
- 16.Preskorn S, Patroneva A, Silman H, Jiang Q, Isler JA, Burczynski ME, Ahmed S, Paul J, Nichols AI. Comparison of the pharmacokinetics of venlafaxine extended release and desvenlafaxine in extensive and poor cytochrome P450 2D6 metabolizers. J Clin Psychopharmacol. 2009;29:39–43. doi: 10.1097/JCP.0b013e318192e4c1. [DOI] [PubMed] [Google Scholar]
- 17.Kharasch ED, Mitchell D, Coles R. Stereoselective bupropion hydroxylation as an in vivo phenotypic probe for cytochrome P4502B6 (CYP2B6) activity. J Clin Pharmacol. 2008;48:464–474. doi: 10.1177/0091270008314254. [DOI] [PubMed] [Google Scholar]
- 18.Masters AR, Gufford BT, Lu JBL, Metzger IF, Jones DR, Desta Z. Chiral plasma pharmacokinetics and urinary excretion of bupropion and metabolites in healthy volunteers. J Pharmacol Exp Ther. 2016 doi: 10.1124/jpet.116.232876. [DOI] [PMC free article] [PubMed] [Google Scholar]
- 19.Sager JE, Price LSL, Isoherranen N. Stereoselective Metabolism of Bupropion to OH-bupropion, Threohydrobupropion, Erythrohydrobupropion and 4′-OH-bupropion in vitro. Drug Metab Dispos. 2016 doi: 10.1124/dmd.116.072363. [DOI] [PMC free article] [PubMed] [Google Scholar]
- 20.Benowitz NL, Zhu AZX, Tyndale RF, Dempsey D, Jacob P. Influence of CYP2B6 genetic variants on plasma and urine concentrations of bupropion and metabolites at steady state. Pharmacogenet Genomics. 2013;23:135–41. doi: 10.1097/FPC.0b013e32835d9ab0. [DOI] [PMC free article] [PubMed] [Google Scholar]
- 21.Sager JE, Choiniere JR, Chang J, Stephenson-Famy A, Nelson WL, Isoherranen N. Identification and Structural Characterization of Three New Metabolites of Bupropion in Humans. ACS Med Chem Lett. 2016 doi: 10.1021/acsmedchemlett.6b00189. acsmedchemlett.6b00189. [DOI] [PMC free article] [PubMed] [Google Scholar]
- 22.Koh KH, Pan X, Shen HW, Arnold SL, Yu AM, Gonzalez FJ, Isoherranen N, Jeong H. Altered expression of small heterodimer partner governs cytochrome P450 (CYP) 2D6 induction during pregnancy in CYP2D6-humanized mice. J Biol Chem. 2014;289:3105–3113. doi: 10.1074/jbc.M113.526798. [DOI] [PMC free article] [PubMed] [Google Scholar]
- 23.Pan X, Lee Y-K, Jeong H. Farnesoid X Receptor Agonist Represses Cytochrome P450 2D6 Expression by Upregulating Small Heterodimer Partner. Drug Metab Dispos. 2015;43:1002–7. doi: 10.1124/dmd.115.064758. [DOI] [PMC free article] [PubMed] [Google Scholar]
- 24.Lutz JD, Isoherranen N. Prediction of relative in vivo metabolite exposure from in vitro data using two model drugs: dextromethorphan and omeprazole. Drug Metab Dispos. 2012;40:159–168. doi: 10.1124/dmd.111.042200. [DOI] [PMC free article] [PubMed] [Google Scholar]
- 25.Reinoso RF, Telfer BA, Brennan BS, Rowland M. Uptake of teicoplanin by isolated rat hepatocytes: comparison with in vivo hepatic distribution. Drug Metab Dispos. 2001;29:453–9. [PubMed] [Google Scholar]
- 26.Shirasaka Y, Sager JE, Lutz JD, Davis C, Isoherranen N. Inhibition of CYP2C19 and CYP3A4 by omeprazole metabolites and their contribution to drug-drug interactionss. Drug Metab Dispos. 2013;41:1414–1424. doi: 10.1124/dmd.113.051722. [DOI] [PMC free article] [PubMed] [Google Scholar]
- 27.Tripathy S, Chapman JD, Han CY, Hogarth C, Arnold SL, Onken J, Kent T, Goodlett DR, Isoherranen N. All-trans-retinoic acid Enhances Mitochondrial Function in Models of Human Liver. Mol Pharmacol. 2016;89:560–574. doi: 10.1124/mol.116.103697. [DOI] [PMC free article] [PubMed] [Google Scholar] [Retracted]
- 28.Shou M, Hayashi M, Pan Y, Xu Y, Morrissey K, Xu L, Skiles GL. Modeling, prediction, and in vitro in vivo correlation of CYP3A4 induction. Drug Metab Dispos. 2008;36:2355–2370. doi: 10.1124/dmd.108.020602. [DOI] [PubMed] [Google Scholar]
- 29.Zamek-Gliszczynski MJ, Mohutsky MA, Rehmel JLF, Ke AB. Investigational small-molecule drug selectively suppresses constitutive cyp2b6 activity at the gene transcription level: Physiologically based pharmacokinetic model assessment of clinical drug interaction risk. Drug Metab Dispos. 2014;42:1008–1015. doi: 10.1124/dmd.114.057018. [DOI] [PubMed] [Google Scholar]
- 30.Lutz JD, Isoherranen N. In vitro -to- in vivo predictions of drug -- drug interactions involving multiple reversible inhibitors. Expert Opin Drug Metab Toxicol. 2012;8:449–466. doi: 10.1517/17425255.2012.667801. [DOI] [PubMed] [Google Scholar]
- 31.Templeton I, Peng CC, Thummel KE, Davis C, Kunze KL, Isoherranen N. Accurate prediction of dose-dependent CYP3A4 inhibition by itraconazole and its metabolites from in vitro inhibition data. Clin Pharmacol Ther. 2010;88:499–505. doi: 10.1038/clpt.2010.119. [DOI] [PMC free article] [PubMed] [Google Scholar]
- 32.Fahmi OA, Maurer TS, Kish M, Cardenas E, Boldt S, Nettleton D. A Combined Model for Predicting CYP3A4 Clinical Net Drug-Drug Interaction Based on CYP3A4 Inhibition, Inactivation, and Induction Determined in Vitro. Drug Metab Dispos. 2008;36:1698–1708. doi: 10.1124/dmd.107.018663. [DOI] [PubMed] [Google Scholar]
- 33.Almond LM, Yang J, Jamei M, Tucker GT, Rostami-Hodjegan a. Towards a quantitative framework for the prediction of DDIs arising from cytochrome P450 induction. Curr Drug Metab. 2009;10:420–32. doi: 10.2174/138920009788498978. [DOI] [PubMed] [Google Scholar]
- 34.Koh KH, Pan X, Shen H-W, Arnold SLM, Yu A-M, Gonzalez FJ, Isoherranen N, Jeong H. Altered Expression of Small Heterodimer Partner Governs Cytochrome P450 (CYP) 2D6 Induction during Pregnancy in CYP2D6-humanized Mice. J Biol Chem. 2013;289:3105–3113. doi: 10.1074/jbc.M113.526798. [DOI] [PMC free article] [PubMed] [Google Scholar]
- 35.Kharasch ED, Mitchell D, Coles R. Stereoselective bupropion hydroxylation as an in vivo phenotypic probe for cytochrome P4502B6 (CYP2B6) activity. J Clin Pharmacol. 2008;48:464–74. doi: 10.1177/0091270008314254. [DOI] [PubMed] [Google Scholar]
- 36.Isoherranen N, Thummel KE. Drug metabolism and transport during pregnancy: How does drug disposition change during pregnancy and what are the mechanisms that cause such changes? Drug Metab Dispos. 2013;41:256–262. doi: 10.1124/dmd.112.050245. [DOI] [PMC free article] [PubMed] [Google Scholar]
- 37.Topletz AR, Le HN, Lee N, Chapman JD, Kelly EJ, Wang J, Isoherranen N. Hepatic Cyp2d and Cyp26a1 mRNAs and activities are increased during mouse pregnancy. Drug Metab Dispos. 2013;41:312–9. doi: 10.1124/dmd.112.049379. [DOI] [PMC free article] [PubMed] [Google Scholar]