Abstract
Alterations in hepatic free fatty acid (FFA) uptake and metabolism contribute to development of prevalent liver disorders such as hepatosteatosis. However, detecting dynamic changes in FFA uptake by the liver in live model organisms has proven difficult. To enable non-invasive real-time imaging of FFA flux in the liver, we generated transgenic mice with liver-specific expression of luciferase and performed bioluminescence imaging with an FFA probe. Our approach enabled us to observe the changes in FFA hepatic uptake under different physiological conditions in live animals. Using this method, we detected a decrease in FFA accumulation in the liver after mice were given injections of deoxycholic acid and an increase after they were fed fenofibrate. In addition, we observed diurnal regulation of FFA hepatic uptake in living mice. Our imaging system appears to be a useful and reliable tool for studying the dynamic changes in hepatic FFA flux in models of liver disease.
Keywords: mouse model, visualization, metabolism, lipid
In obesity, plasma level of free fatty acids (FFA) are usually elevated and are associated with an increased risk of hepatosteatosis, the hallmark feature of nonalcoholic fatty liver disease (NAFLD).1 Some deleterious effects of excessive FFAs on liver function can be prevented by inhibiting fatty acid transport proteins(FATPs) in the liver, thereby reducing FFA hepatic uptake.2 Thus, quantitative monitoring of long-term hepatic FFA uptake in vivo should be of paramount importance for lipid research and the liver-associated metabolic disorders.
We recently developed a bioluminescence imaging (BLI) probe for monitoring FFA uptake (S)-2-(6-((3-((15-carboxypentadecyl)disulfanyl)propoxy)carbonyloxy)benzo[d]thiazol-2-yl)-4,5-dihydrothiazole-4-carboxylic acid (FFA-Luc).3 FFA-Luc is a C16 long-chain fatty acid linked to luciferin via a disulfide bond. It is taken up via physiological, compatible, transporter mediated processes3 and upon uptake uncages luciferin due to the reducing intracellular environment resulting in cleavage of the disulfide bond. Thus, in luciferase expressing cells, FFA-Luc uptake results in the proportional generation of photons3. Using this probe we could detect FFA uptake from intestine and distinct sites such as brown adipose tissue in mice that express luciferase under the actin promoter (FVB-Luc+).3 However, we were not able to determine hepatic fatty acid uptake due to the high scattering of multiple signals from the abdominal cavity. To circumvent this problem, we generated transgenic mice expressing luciferase under the control of the albumin promoter for liver-specific luciferase expression (L-Luc mice).
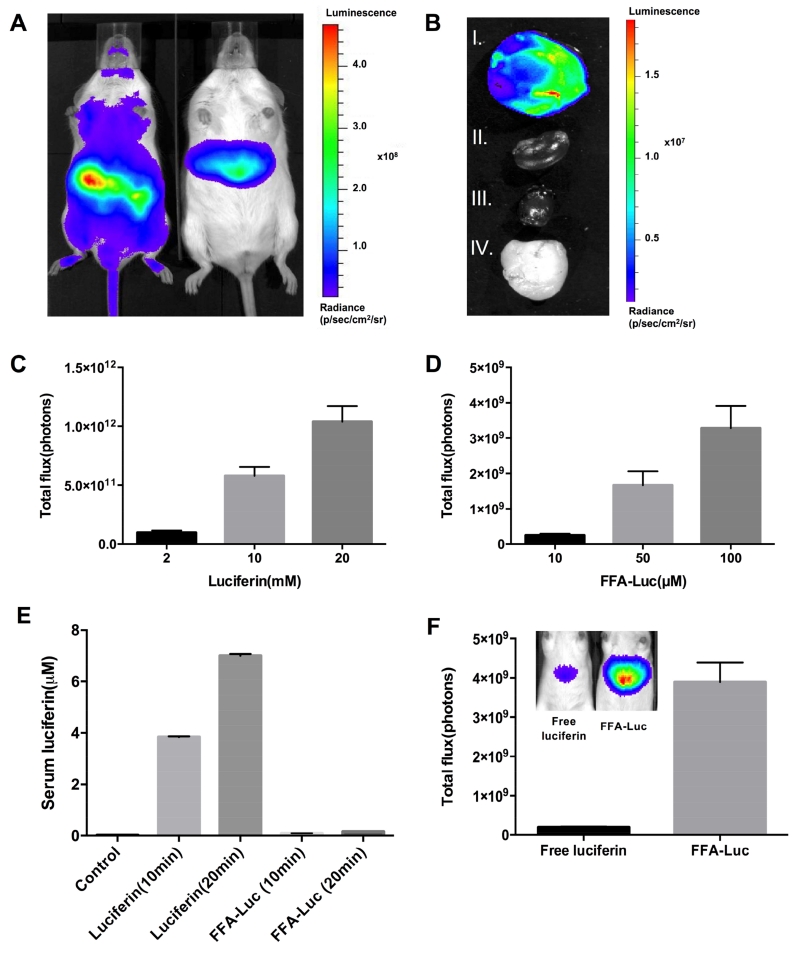
After luciferin intraperitoneal (IP) injection, while FVB-Luc+ mice showed signal throughout the body, the signal from L-Luc mice was liver specific (Figure 1A). To further confirm liver-specific luciferase expression, we harvested several organs and detected light emission only in the liver (Figure 1B). The dose-response in L-Luc mice was investigated by injecting 2, 10, and 20mM of luciferin and 10, 50, and 100 M of FFA-Luc, followed by monitoring total photon flux for 50 min by BLI. The results indicated a dose-dependent increase in total photon flux after both luciferin and FFA-Luc injection (Figure 1C, D).
Figure 1. Generation of liver-specific transgenic mice and model validation.
(A) Ventral luminescent/photographic overlay comparing the BLI of FVB-Luc+(left) and L-Luc (right) mice 5 min after IP injection of luciferin. (B) Luminescent/photographic overlay of FFA-Luc uptake by the liver (I), kidney (II), heart (III), and white adipose tissue (IV) from L-Luc mice 5 min after luciferin administration. (C) Total photon flux 0–25 min after the injection of luciferin (C) and 0-50 min after the injection of FFA-Luc (D) at the indicated concentrations. Error bars are ± SEM of 3 independent experiments. (E) Detection of free serum luciferin before injection, 10 and 20 min after the injection of luciferin and FFA-Luc. Error bars are ± SEM (n=5). (F) Luminescence emitted by free luciferin injected at a dose (100μL at 4μM) to match the serum levels of FFA-derived circulating free luciferin (0.16μM in serum). Error bars are ± SEM (n=5)
As the probe is taken up by all FFA utilizing tissues,3 we considered the possibility that luciferin uncaged in extrahepatic tissues could circulate back to the liver and thus contribute to the hepatic BLI signal independent of hepatic FFA uptake. To determine serum levels of FFA-Luc-derived free luciferin, we measured luciferin content in serum samples of FFA-Luc- and luciferin-injected wild-type mice 10 and 20 min after injection (Figure 1E). Based on the serum luminescence data, we calculated a serum free luciferin of 0.16 M and further determined that this serum concentration of luciferin can be achieved using a single 100μL IP injection of 4μM free luciferin. We injected this dose into the L-Luc mice to determine the signal intensity in the liver generated by free circulating luciferin at a concentration expected to be reached by extrahepatically generated breakdown of the FFA-Luc probe (Figure 1F). The results indicate that the maximal total signal generated by 0.16μM circulating luciferin was less than 4% of the total signal we observe for FFA-Luc, and thus within the range of inter-animal variations.
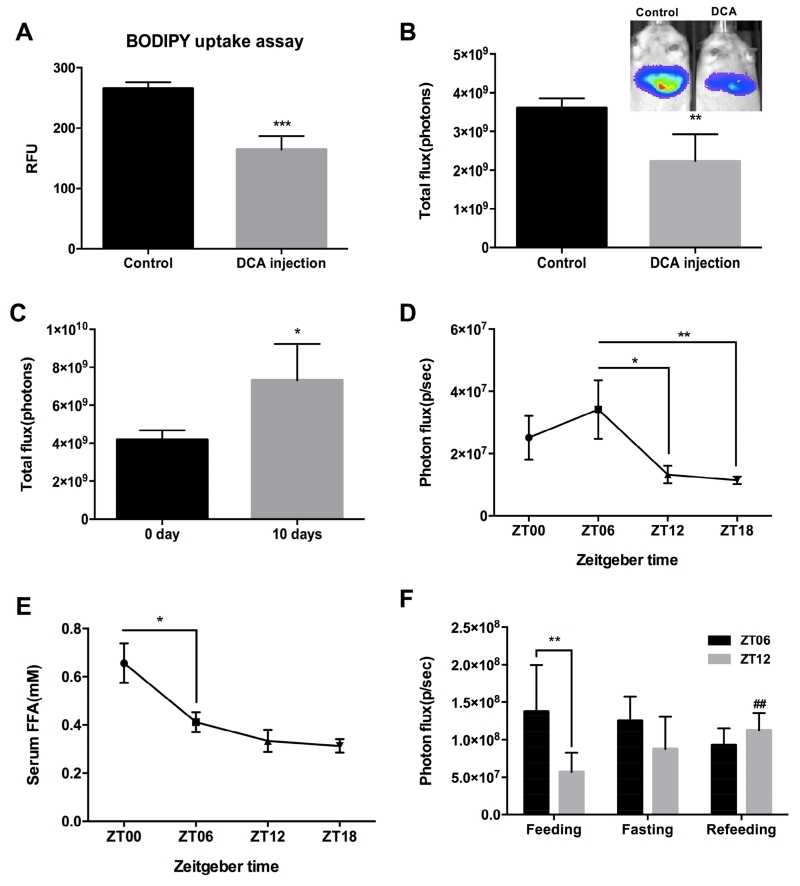
Next, we determined whether our imaging system could be used to detect changes in liver FFA uptake. Our previous study showed that the secondary bile acid, deoxycholic acid (DCA), inhibits FATP5 with an IC50 of 0.19 μM in vitro without any apparent toxicity and showed that DCA is able to significantly reduce the hepatic uptake of various long-chain fatty acids.4 We measured FFA influx in the liver of DCA-treated L-Luc mice using BLI with FFA-Luc and compared the measurement to a widely used ex vivo FFA uptake assay with fluorescently labeled FA (BODIPY) (Figure 2A,B). BODIPY incorporates into lipids and has been utilized as a valuable tool in lipid transport and membrane studies.5 While only the bioluminescent method allowed for in vivo detection, both FFA-Luc and BODIPY-FFA based assays detected a comparable decrease in FFA hepatic uptake of 35% in the DCA-treated group. In addition, we couldn’t detect DCA induced quenching of luciferase-luciferin bioluminescence (Supplementary Figure 1). We then applied our imaging approach to study the effect of fenofibrate on hepatic FFA uptake. Fenofibrate promotes β-oxidation in the liver,6 but its effect on FFA uptake has not been explored. We fed L-Luc mice standard chow or fenofibrate (0.2% w/w) diet for 10 days and then analyzed for FFA uptake in the liver. The results revealed a significant increase by 40% of hepatic FFA uptake in fenofibrate-treated animals compared to control (Figure 2C), suggesting that enhanced FFA uptake contributes to a fenofibrate-induced increase in β-oxidation.
Figure 2. Application of bioluminescence imaging (BLI) to monitoring the changes in FFA hepatic uptake in different physiological conditions.
Acute effects of DCA injection at the concentration of 6.4 mg/kg body weight into L-Luc mice on the reduction of hepatic uptake of BODIPY(A) and FFA-Luc (B). **P < 0.01, ***P < 0.001 (n = 5) in Student’s t-test. (C) Fenofibrate feeding increased FFA-Luc uptake in the liver. **P < 0.01 (n = 5) in Student’s t-test. (D) FFA uptake rate after the injection of FFA-Luc into L-Luc mice and serum FFA concentration (E) during the light (ZT6, ZT12) and dark (ZT18, ZT0) periods. *P < 0.05, **P<0.01 (n = 5) in one-way ANOVA. (F) FFA uptake rate after regular feeding, 24hr of fasting and refeeding during the light (ZT6, ZT12) periods. ##P<0.01 between feeding and refeeding at ZT12, **P<0.01 in a paired Student’s t-test. Values are reported with error bars as ±SEM.
We next applied BLI to explore hepatic diurnal changes in liver FFA uptake over a 24-hour period in male L-Luc mice. The highest FFA uptake was observed at zeitgeber time (ZT) 06 (1PM), mid-light phase, while the lowest was detected at ZT18 (Figure 2D); moreover, significant differences were observed between ZT06 and ZT12 (decreased by 59% of ZT06) and between ZT06 and ZT18 (decreased by 64% of the highest). These results indicate that FFA uptake by the liver is altered across the day and night, suggesting a robust diurnal rhythm. These data agree with the finding that FATP2, one of the major hepatic fatty acid transporters, exhibits a strong diurnal expression pattern.7 Importantly the rhythmic changes in hepatic FFA uptake were not driven by changes in circulation FFA levels (Figure 2E).
To confirm our diurnal changes of hepatic FFA uptake reflects actual FFA uptake, we compared hepatic FFA uptake under feeding, fasting and refeeding states (Figure 2F). We observed that ZT06 and ZT12 showed significantly different hepatic uptake in the regular feeding state. However, there is no significant difference in the hepatic FFA uptake after 24hr fasting or refeeding between ZT06 and ZT12 (Figure 2F). Refeeding significantly increased hepatic FFA uptake at ZT12 while it had less effect at ZT06. This means that food manipulation can override the diurnal rhythms of hepatic FFA uptake and have different effects at different time points of day. Changes in uptake are not driven by serum FFA levels because FFA level is low when FFA uptake rate is low (Supplementary Figure 2).
Taken together, we have demonstrated the development of a novel in vivo imaging system and its application for monitoring physiological and pathological changes to FFA uptake in preclinical models. The data obtained in this study demonstrate that FFA uptake could be monitored in real time under various conditions, which, given the importance of FFA hepatic accumulation in physiology, opens up a spectrum of opportunities for studying fundamental mechanisms underlying lipid metabolism in the liver.
Supplementary Material
Acknowledgements
The authors thank the staff of the Berkeley Bioimaging Facility, Drs. Ruzin and Schichnes, for their help. This work was supported in part by NIH/NCI 1R21CA187306 and NIH/NIDDK 5R01DK066336 to AS.
Footnotes
Publisher's Disclaimer: This is a PDF file of an unedited manuscript that has been accepted for publication. As a service to our customers we are providing this early version of the manuscript. The manuscript will undergo copyediting, typesetting, and review of the resulting proof before it is published in its final citable form. Please note that during the production process errors may be discovered which could affect the content, and all legal disclaimers that apply to the journal pertain.
Author Contributions: H.P designed and performed all experiments, analyzed data and wrote the manuscript. K.A.R and L.J.K designed and performed diurnal rhythm experiments. G.K and E.D produced FFA-Luc. M.P assisted H.P with experiments. A.S is the guarantor of this work, had full access to all the data, and takes full responsibility for the integrity of data and the accuracy of data analysis.
Conflict of Interest: The authors declare that there are no conflicts of interest.
References
- 1.Fabbrini E, et al. Hepatology. 2010;51:679–689. doi: 10.1002/hep.23280. [DOI] [PMC free article] [PubMed] [Google Scholar]
- 2.Koonen DP, et al. Diabetes. 2007;56:2863–2871. doi: 10.2337/db07-0907. [DOI] [PubMed] [Google Scholar]
- 3.Henkin AH, et al. ACS Chem Biol. 2012;7:1884–1891. doi: 10.1021/cb300194b. [DOI] [PMC free article] [PubMed] [Google Scholar]
- 4.Nie B, et al. Hepatology. 2012;56:1300–1310. doi: 10.1002/hep.25797. [DOI] [PMC free article] [PubMed] [Google Scholar]
- 5.Kasurinen J. Biochem Biophys Res Commun. 1992;187:1594–1601. doi: 10.1016/0006-291x(92)90485-4. [DOI] [PubMed] [Google Scholar]
- 6.Oosterveer MH, et al. J Biol Chem. 2009;284:34036–34044. doi: 10.1074/jbc.M109.051052. [DOI] [PMC free article] [PubMed] [Google Scholar]
- 7.Patel VR, et al. Nat Methods. 2012;9:772–773. doi: 10.1038/nmeth.2111. [DOI] [PubMed] [Google Scholar]
Associated Data
This section collects any data citations, data availability statements, or supplementary materials included in this article.


