

Abstract
The interferon lambda (IFN-λ) cytokines have well-known antiviral properties, yet their contribution to immune regulation is not well understood. Epithelial cells represent the major target cell of IFN-λ; peripheral blood mononuclear cells are generally considered nonresponsive, with the exception of plasmacytoid dendritic cells (pDCs). In this study we aimed to define the potential for discrete subpopulations of cells to directly respond to IFN-λ. Analysis of peripheral blood leukocytes reveals that, while pDCs uniformly express the highest levels of IFN-λ receptor, a small proportion of B cells and monocytes also express the receptor. Nevertheless, B cells and monocytes respond poorly to IFN-λ stimulation in vitro, with minimal STAT phosphorylation and interferon-stimulated gene (ISG) induction observed. We confirm that pDCs respond to IFN-λ in vitro, upregulating their expression of pSTAT1, pSTAT3, and pSTAT5. However, we found that pDCs do not upregulate pSTAT6 in response to IFN-λ treatment. Our results highlight unique aspects of the response to IFN-λ and confirm that while the IFN-λ receptor is expressed by a small proportion of several different circulating immune cell lineages, under normal conditions only pDCs respond to IFN-λ stimulation with robust STAT phosphorylation and ISG induction. The difference in STAT6 responsiveness of pDCs to type I and type III interferons may help explain the divergence in their biological activities.
Keywords: : Type III IFNs, JAK-STAT, peripheral blood mononuclear cells, dendritic cells
Introduction
Interferons (IFNs) are widely known for their antiviral properties and also have immune-regulatory functions (Maher and others 2007). The diverse roles of Type I and Type II IFNs in the immune system are well established, but the immunological activity of the most recently discovered Type III IFNs is unclear.
Type III IFNs (IFN-λ) are related to both the Type I IFNs and the IL-10 cytokine superfamily, but show less than 20% amino acid identity with either family (Kotenko and others 2003; Sheppard and others 2003). IFN-λ binds to the IFN-λ receptor, which is comprised of the shared IL-10R2 (IL-10Rβ) chain, and the IFN-λ-specific IFN-λR1 chain, expressed predominantly on epithelial cell types (Sommereyns and others 2008). In epithelial cells, IFN-λ exerts similar antiviral effects to the Type I IFNs, signaling through the JAK-STAT pathway to induce IFN-stimulated genes (ISGs) and upregulate MHC expression, although with differing kinetics (Jilg and others 2014). IFN-λ can inhibit the replication of viruses including hepatitis C virus (HCV) (Robek and others 2005; Zhu and others 2005; Marcello and others 2006; Zhang and others 2011), rotavirus (Pott and others 2011), influenza and respiratory syncytial virus (RSV) (Mordstein and others 2008) within epithelial cells suggesting a high level of redundancy between Type I and III IFNs.
This apparent redundancy is challenged by genetic studies linking polymorphisms in the IFNL genomic region to diseases including HCV infection (Ge and others 2009; Suppiah and others 2009; Tanaka and others 2009; Thomas and others 2009) and asthma (Gaudieri and others 2012), and by in vivo mouse studies that have demonstrated a protective effect of IFN-λ on allergic airway disease (Koltsida and others 2011). These findings imply that the Type III IFNs have immune regulatory functions beyond the induction of an antiviral cellular state, which may influence disease susceptibility. However, evidence for a direct effect of IFN-λ on immune cells is limited and reports describing IFN-λR1 expression on immune cells have been conflicting, with data largely based on gene expression studies (Witte and others 2009; Gallagher and others 2010). Published studies have reported that peripheral blood mononuclear cells (PBMCs) do not respond to IFN-λ (Witte and others 2009; Dickensheets and others 2013), with the exception of plasmacytoid dendritic cells (pDCs) that express the receptor and also respond to IFN-λ treatment (Ank and others 2008; Megjugorac and others 2009; Yin and others 2012). Some studies on isolated immune populations have shown T regulatory cell induction by IFN-λ-treated monocyte-derived dendritic cells (Mennechet and Uze 2006), modulation of the IFN-γ response in monocyte-derived macrophages (Liu and others 2011), and skewing of the Th1/Th2 response by IFN-λ (Jordan and others 2007b). However, with many of these studies, it is unclear whether the effect of IFN-λ is direct or indirect.
Here, we report a detailed investigation of how minimally manipulated peripheral blood immune cell populations respond to IFN-λ stimulation. Using both flow cytometry and real-time polymerase chain reaction measurement of receptor expression and whole blood intracellular phosphorylated STAT protein staining, our results provide a comprehensive analysis of IFN-λ receptor expression and the direct responsiveness of immune cells to IFN-λ.
Materials and Methods
Cell isolation and purification
PBMCs were isolated from buffy coats sourced from the Irish Blood Transfusion Service, from leukocyte cones (National Blood Transfusion Service, Manchester, United Kingdom) or from healthy donors recruited locally with approval by Trinity College Ethics Committee. The PBMC fraction was isolated by density centrifugation using Ficoll-Paque Plus™ separation medium (GE Healthcare). T cells, B cells, and monocytes were isolated using CD3, CD19, and CD14 microbeads respectively or were sorted using the Influx II (BD Bioscience), while pDCs were isolated using the Diamond Plasmacytoid Dendritic Cell Isolation Kit II (all from Miltenyi Biotec), as per manufacturer's instructions. Cell purities were consistently >95%.
Stimulation of PBMCs with IFN-λ and IFN-α
PBMCs or purified immune cell populations were cultured at a density of 1 × 10⁶/mL in Roswell Park Memorial Institute medium (RPMI) supplemented with 10% fetal bovine serum, 250 U/mL penicillin, and 250 μg/mL streptomycin (Gibco, Life Technologies) at 37°C in 5% CO2. Isolated pDCs were supplemented with recombinant human IL-3 (1 ng/mL; Immunotools) to maintain viability. Cells were stimulated with 100 ng/mL of IFN-λ1 (IL-29), IFN-λ2 (IL-28A) (both Peprotech) or IFN-λ3 (IL-28B) (R&D Systems) or 1,000 U/mL IFN-α (Peprotech).
Characterization of IFN-λ receptor by flow cytometry
IFN-λR1 expression on peripheral blood leukocytes was examined by flow cytometry. Briefly, 1 × 10⁶ PBMCs were stained for surface markers for 20 min in the dark at 4°C using the following antibodies: IFN-λR1 (IL-28Rα) (clone MHLICR2a; Biolegend), IL-10R2 (clone 90220; R&D Systems), CD3 (clone UCHT1; Biolegend), CD19 (clone HIB19; Biolegend), CD56 (clone MEM-188; Biolegend), HLA-DR (clone L234; Biolegend), CD14 (clone M5E2; Biolegend), and CD16 (clone 3G8; Biolegend). Isotype controls, IgG1 and IgG2a (both BD Bioscience), and fluorescence minus one (FMO) controls were used to set population gates. For whole blood staining (DCs) 200 μL of fresh blood was stained with Lin1 (CD3, clone SK7; CD16, clone 3G8; CD19, clone SJ25C1; CD20, clone L27; CD14, clone MφP9; CD56, clone NCAM16.2; BD Bioscience), HLA-DR (clone G46-6; BD Bioscience), CD11c (clone 3.9; eBioscience), and CD123 (clone 6h6; eBioscience) for 20 min at RT followed by lysis of red blood cells using FACS Lysing solution (BD Bioscience) for 10 min at RT. Samples were washed and fixed in 1% paraformaldehyde (Sigma-Aldrich) before analysis using the Canto II or LSR Fortessa instrument (BD Bioscience) and FlowJo software (Treestar, Inc.).
Whole blood staining to detect STAT phosphorylation
Intracellular staining of whole blood was carried out to detect upregulation of phosphorylated (p)STAT in response to IFN-λ treatment. Whole blood (200 μL) was either untreated or treated with IFN-λ1, -λ2 or λ3 (100 ng/mL), or IFN-α (1,000 U/mL) and incubated at 37°C for the indicated time points (15–90 min). After the stimulation period, the cells were fixed immediately by adding Lyse/Fix Buffer (BD Bioscience), followed by surface staining using the following antibodies: CD45-AmCyan (clone 2D1; BD Bioscience), CD3-pacific blue (clone UCHT1, BD Bioscience), CD303 (BDCA-2)-PE or APC (clone AC144; Miltenyi Biotec), CD14-FITC (clone M5E2), Lin-1-FITC, CD19-FITC (clone HIB19) (all BD Bioscience). Samples were incubated at RT for 60 min followed by permeabilization for 30 min on ice using Perm Buffer III (BD Bioscience) and intracellular staining was carried out using BD Bioscience Phosflow antibodies: STAT1-PE or Alexa 647 (clone 4a; pY701), STAT3-PE or PE-CF594 (clone 4/P-STAT3; pY705), STAT4 PE or PerCP-Cy5.5 (clone 38/pStat4; pY693), STAT5-Alexa 647 or PE-Cy7 (clone 47/Stat5; pY694), STAT6-PE or V450 (clone 18/P-Stat6; pY641). Samples were incubated at RT for 60 min, then washed and acquired immediately using a Canto II or LSR Fortessa flow cytometer (BD Bioscience). Data were analyzed using FlowJo software.
Real-time PCR: ISGs and IFNLR1
RNA was extracted from isolated pDCs and B cells (1–5 × 10⁵ cells) using either RNeasy micro or mini kits (Qiagen), according to the manufacturer's instructions. The TRIzol® (Life Technologies, Invitrogen) method was used to extract RNA from monocytes, and T cells (1–2 × 10⁶ cells). Synthesis of cDNA was performed using the Omniscript® reverse transcription kit (Qiagen). Quantitative PCR was carried out using the SensiMix™ SYBR®green (BioLine) on a Mx3000P® instrument (Stratagene). Each reaction was carried out in duplicate in a total volume of 20 μL. Primers were designed to be intron-spanning using Primer3 or Primer Express® v3.0 software (Applied Biosystems). To measure the cellular transcriptional response to IFN stimulation, 3 ISG targets, CXCL10, ISG15, and PKR, were selected based on published results investigating the transcriptional response in IFN-stimulated PBMCs (Waddell and others 2010). The following cycling parameters were used: 95°C for 30 s, 60°C for 1 min and 72°C for 30 s, followed by amplicon dissociation. For gene induction assays, fold change values were calculated using the ΔΔCt method. The geometric mean of the Ct values of 2 reference genes, GAPDH and RPS15, was used as a reference value and each sample was individually calibrated using the Ct value of the untreated sample. Primer sequences are listed in Table 1. For measurement of IFNLR1, RNA was extracted from cell populations using the RNeasy mini or micro kits and reverse transcribed using superscript III reverse transcriptase (Life Technologies) and IFNLR1 expression was measured by real-time PCR using TaqMan gene expressions assay (Hs00417120_m1; Life Technologies) using the Quantstudio 12K Flex instrument (Life Technologies). Input cDNA was 10 ng/reaction in 20 μL reaction using TaqMan Universal mastermix II with UNG (Life Technologies) and gene expression was normalized to the housekeeping gene beta 2 microglobulin (B2M) (Hs00984230_m1; Life Technologies) and expressed as a ratio of the Ct of gene of interest to housekeeping gene. Results are expressed as mean ± SEM. Statistical analysis was carried out using one-way ANOVA, with Tukey's post-test. P < 0.05 was considered statistically significant; *P < 0.05, **P < 0.01, ***P < 0.005, ****P < 0.001.
Table 1.
List of Primer Sequences Used for Real-Time Polymerase Chain Reaction
| Target | Primer sequence (5′ to 3′) |
|---|---|
| GAPDH [glyceraldehyde-3-phosphate dehydrogenase] | F – AAAATCAAGTGGGGCGATGC |
| R – GAGGGGGCAGAGATGATGAC | |
| RPS15 [ribosomal protein S15] | F – CGGACCAAAGCGATCTCTTC |
| R – CGCACTGTACAGCTGCATCA | |
| CXCL10 [chemokine (C-X-C motif) ligand 10] | F – CCTGCAAGCCAATTTTGTCCA |
| R – TGTGGTCCATCCTTGGAAGC | |
| ISG15 [ISG15 ubiquitin-like modifier] | F – TTTGCCAGTACAGGAGCTTGTG |
| R - GGGTGATCTGCGCCTTCA | |
| PKR [EIF2AK2; eukaryotic translation initiation factor 2-alpha kinase 2] | F – TCTCAGCAGATACATCAGAGA |
| R–AGTATACTTTGTTTCTTTCATG |
Results
The IFN-λ receptor is expressed on B cells, monocytes, and DCs
To define the extent of IFN-λ receptor expression by circulating immune cells, PBMCs were stained with antibodies specific for IFN-λR1 and IL-10R2 and expression measured by flow cytometry, gating on CD3+ T cells, CD19+ B cells, CD56+ NK cells, and different populations of monocytes: CD14+ classical, CD14+CD16+ intermediate, and CD16+ nonclassical monocytes. Within the lymphocyte gate, IFN-λR1 expression was only detectable on a small proportion of CD19+ B cells, and was absent from T cells and NK cells (n = 5) (Fig. 1). We found that a low percentage of monocytes expressed IFN-λR1 (Fig. 2). Both CD19+ B cells and all of the monocyte subsets examined expressed the IL-10R2 receptor chain (Figs. 1 and 2), suggesting that these cell types may be capable of responding to IFN-λ under appropriate conditions.
FIG. 1.
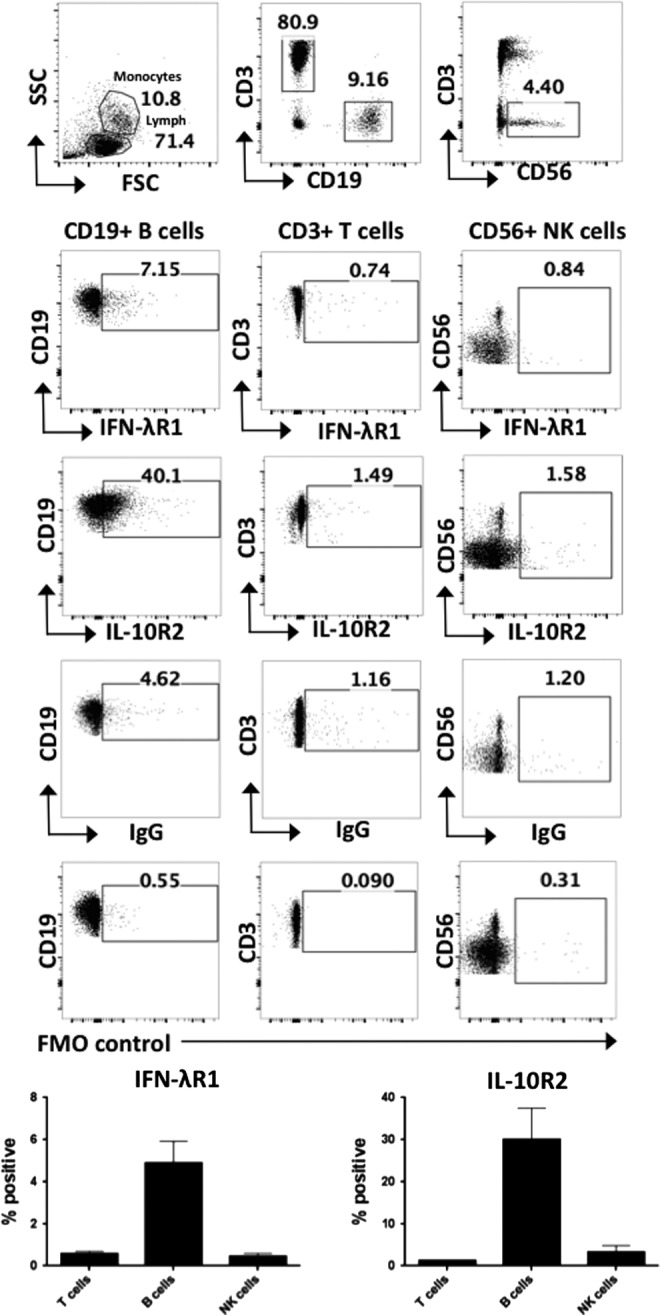
Expression of the IFN-λ receptor chains IFN-λR1 and IL-10R2 on peripheral blood lymphocyte populations. Expression of the IFN-λR1 and IL-10R2 receptor chains were measured by flow cytometry on CD3+, CD19+, and CD56+ cells in healthy donor PBMCs, gating on lymphocytes by FSC SSC (n = 5). Graphs show the percentage positive of IFN-λR1 and IL-10R2 expression from n = 5 healthy donors. Gates were set based on isotype and FMO controls. Error bars show SEM. FMO, fluorescence minus one; PBMC, peripheral blood mononuclear cells.
FIG. 2.
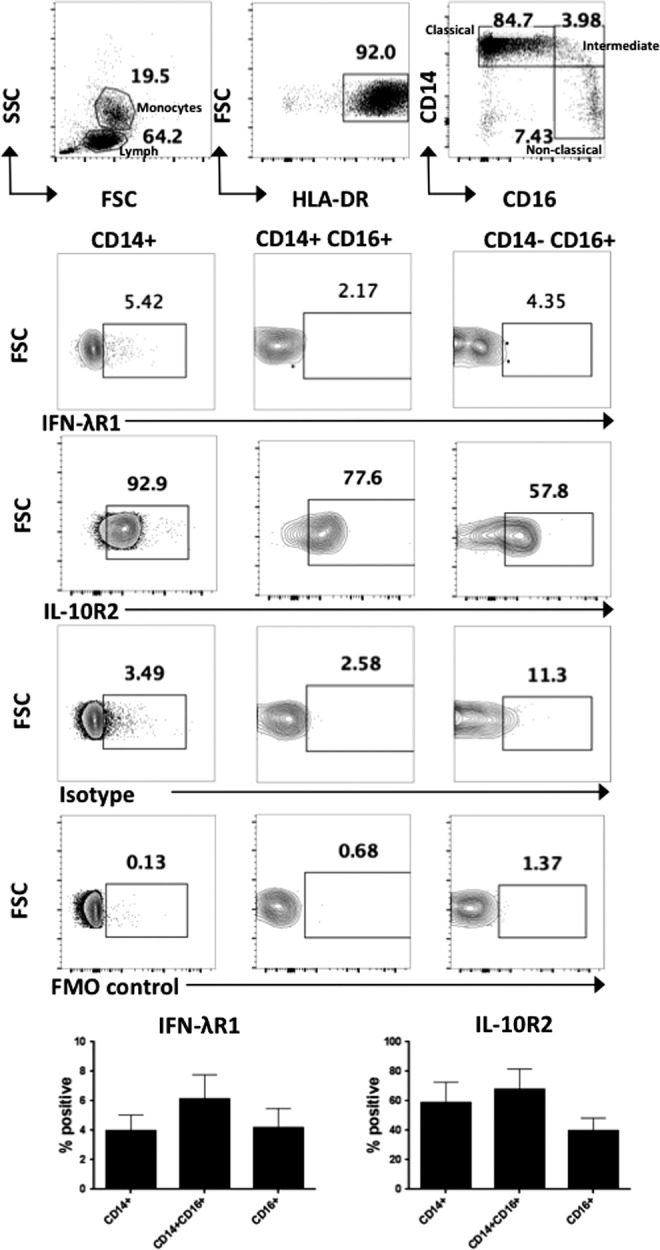
Expression of the IFN-λ receptor chains IFN-λR1 and IL-10R2 on peripheral blood monocyte populations. Expression of the IFN-λR1 and IL-10R2 receptor chains were measured by flow cytometry on healthy donor PBMC monocyte populations. Following gating on the monocyte gate by FSC SSC and HLA-DR+ cells, the populations were gated to distinguish CD14+ classical monocytes, CD14+CD16+ intermediate monocytes, and CD16+ nonclassical monocytes and the % positive IFN-λR1 and IL-10R2 receptor cells shown (n = 5). Error bars show SEM.
Next, the expression IFN-λR1 and IL-10R2 by DC subsets was investigated. DCs were identified by gating on Lin1− HLA-DR+ cells within which myeloid DCs can be identified by the expression of CD11c. The marker CD123 (IL-3 receptor) is used to identify pDCs (Fig. 3A i), which are also commonly identified by expression of the pDC-specific marker BDCA-2. The BDCA-4 marker is used for pDC isolation as isolation based on BDCA-2 triggers changes in cell function and is thus avoided. Relative to the isotype control, pDCs and mDCs expressed the IFN-λR1 and IL-10R2 chains of the IFN-λ receptor (Fig. 3A i, ii). To confirm flow cytometry data, IFNLR1 was also measured on pDCs and FACS-sorted CD3+ T cells, CD19+ B cells, and CD14+ monocytes by real-time PCR. pDCs expressed considerably higher levels of IFNLR1 compared to all other immune cell populations tested (Fig. 3B). IFNLR1 expression was also detectable on B cells, T cells, and monocytes although at markedly reduced levels.
FIG. 3.

Expression of IFN-λ receptor on pDCs. (A) IFN-λR1 and IL-10R2 expression was measured on CD123+ plasmacytoid and CD11c+ myeloid dendritic cells from the fresh whole blood of healthy donors. (i) Following gating on single cells by light scattering, dendritic cells were identified by first gating on Lin1− HLA-DR+ population, followed by CD11c and CD123. Gates were set based on FMO controls and isotype controls (shown) (ii) The MFI of IFN-λR1 and IL-10R2 expression from n = 3 healthy donors is presented following subtraction of the isotype control for each cell type. Error bars show SEM. (B) RNA was extracted from total PBMCs or isolated CD3+ T cells, CD19+ B cells, CD14+ monocytes, or BDCA-4+ pDCs and IFNLR1 expression was measured by real-time PCR. Results are expressed as mean ± SEM. Statistical analysis was carried out using one-way ANOVA, with Tukey's post-test; ****P < 0.001. pDC, plasmacytoid dendritic cell.
IFN-λ induces robust STAT phosphorylation in pDCs
As DCs and a small proportion of B cells and monocytes express the IFN-λ receptor, we measured the response of these cells to IFN-λ treatment. Activation of the JAK-STAT pathway (as evidenced by pSTAT1 and pSTAT3) by IFN-λ was measured in total PBMCs treated with 100 ng/mL IFN-λ1 for 30 min, with IFN-α treatment (1,000 U/mL) for 30 min included as a positive control. No STAT phosphorylation was detectable in total PBMCs (CD45+) treated with IFN-λ, while robust induction of pSTAT1 and pSTAT3 was observed in response to IFN-α (Fig. 4A). Increasing IFN-λ1 concentration up to 500 ng/mL and treatment from 15 to 90 min failed to induce discernible STAT1 or STAT3 phosphorylation upon analysis of total PBMCs (data not shown). STAT phosphorylation in response to IFN-λ1 was absent when immune cells were separated into lymphocytes and monocytes on the basis of forward and side scatter (Fig. 4B). However, within the Lin1− BDCA-2+ pDC gate, pSTAT1 upregulation in response to IFN-λ1 (100 ng/mL) was clearly observed at 30 min (Fig. 4B). Dose response experiments demonstrated that as little as 10 ng/mL of IFN-λ1 induced pSTAT1 in pDCs, with increased levels observed with 100 ng/mL (Fig. 4C). Specific staining of CD3+ T cells, CD19+ B cells, and CD14+ monocytes failed to show any STAT phosphorylation in response to IFN-λ at time points up to 90 min (data not shown).
FIG. 4.

IFN-λ induces STAT phosphorylation in pDCs from peripheral blood. (A) Whole blood (200 μL) was treated with 1,000 U/mL IFN-α or 100 ng/mL IFN-λ1 for 30 min. Red cells were then lysed, fixed and stained with the pan-leukocyte marker CD45. Following permeabilization, intracellular staining was performed using antibodies against pSTAT1 and pSTAT3 and cells were acquired immediately on a flow cytometer. (B) STAT phosphorylation was examined in the lymphocyte gate, monocyte/DC gate, and gating on Lin1− BDCA-2+ pDCs. (C) Phosphorylation of STAT1 was measured by flow cytometry in pDCs in response to 10 ng/mL and 100 ng/mL IFN-λ1 and 1,000 U/mL IFN-α. Flow plots are representative of at least n = 3 healthy donors.
pDCs show a unique profile of STAT phosphorylation in response to IFN-λ
To provide a complete picture of STAT signaling following IFN-λ stimulation in pDCs, phosphorylation of STAT1, 3, 4, 5, and 6 were measured. IFN-λ1, IFN-λ2, and IFN-λ3 acted in a similar manner, inducing pSTAT1, pSTAT3, and pSTAT5 upregulation in pDCs after 30 min treatment of whole blood (Fig. 5A). Measurement of the IFN-λ1-induced pSTAT response over a time course of 0–90 min revealed that the pattern of IFN-λ1-induced STAT phosphorylation in pDCs mirrored that seen with IFN-α treatment of pDCs, although at lower levels (Fig. 5A, B). Both IFN-λ1 and IFN-α induced phosphorylation of STATs 1, 3, and 5; however, unlike IFN-α, IFN-λ1 failed to induce phosphorylation of STAT6. IFN-α and IFN-λ1 both failed to induce phosphorylation of STAT4 in pDCs (Fig. 5A, B).
FIG. 5.

IFN-λ induces phosphorylation of STAT1, 3, and 5, but not STAT6, in pDCs. (A) Whole blood (200 μL) from healthy donors (n = 3) was treated with 100 ng/mL IFN-λ1, IFN-λ2, and IFN-λ3 or 1,000 U/mL IFN-α for 30 min. Following red blood cell lysis, cells were fixed and stained with lin1 and the pDC-specific surface marker BDCA-2. The cells were permeabilized and intracellular staining was carried out using antibodies against phospho-STAT1, STAT3, STAT4, STAT5, and STAT6. (B) The mean percentage STAT phosphorylation is shown for pDCs treated with either (i) IFN-λ1 or (ii) IFN-α at time points of 15–90 min as indicated, with the unstimulated sample gated at less than 3%. Error bars indicate SEM.
IFN-λ treatment induces minimal ISG expression in immune cell populations
Next, we sought to identify whether the ability of IFN-λ to induce ISGs was limited to those cells that expressed the IFN-λR1 and demonstrated increased STAT phosphorylation, namely pDCs. Expression of well-characterized ISGs CXCL10, ISG15, and PKR were measured in purified pDCs, B cells, T cells, and monocytes treated with IFN-λ1. ISG expression was measured following IFN-α stimulation as a positive control (except for pDCs due to limited cell numbers). All cell types responded to IFN-α stimulation upregulating CXCL10, ISG15, and PKR expression indicating they were viable and capable of responding to stimuli (Fig. 6).
FIG. 6.
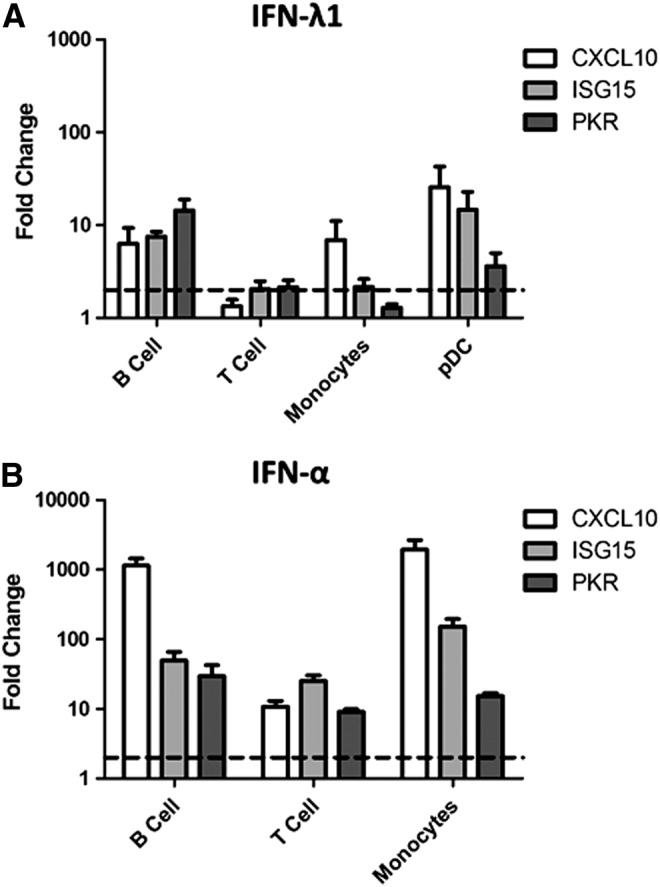
IFN-λ induces expression of the antiviral genes CXCL10, ISG15, and PKR in peripheral blood immune populations. BDCA-4+ pDCs, CD19+ B cells, CD14+ monocytes, and CD3+ T cells were isolated from peripheral blood mononuclear cells (PBMCs) by magnetic bead separation and cultured either untreated or treated with (A) IFN-λ1 (100 ng/mL) or (B) IFN-α (1,000 U/mL) for 4 h. Following RNA extraction, CXCL10, ISG15, and PKR expression was measured using real-time PCR. Fold change is shown relative to the untreated sample for each cell type (as indicated by dotted line) and values were normalized to the mean of 2 housekeeping genes GAPDH and RPS15 using the ΔΔCt method. Each bar represents the mean of n = 5–6 blood donors for B cells, T cells, and monocytes and n = 3 donors for pDCs. Error bars show SEM.
The highest IFN-λ1-induced gene expression was evident in pDCs (25.6-, 14.7-, and 3.6-fold change for CXCL10, ISG15 and PKR respectively). However, some ISG induction was also present in B cells, and monocytes (Fig. 6). The ISG responses observed in B cells and monocytes were minimal, representing only a fraction of the response to IFN-α stimulation. Among these 3 immune cell types, B cells had the most consistent ISG induction with 6.3-, 7.5- and 14.4-fold induction of CXCL10, ISG15, and PKR respectively, while monocytes only showed increased CXCL10 expression.
Discussion
Here, we hypothesized that IFN-λs might play a key role in the regulation of immune response and exerting antiviral activity in epithelial cells. We therefore sought to systematically profile the expression of IFN-λR1 by human peripheral blood leukocyte populations and their responsiveness to the direct effects of IFN-λ1. We found that while pDCs express the highest level of the specific IFN-λR1 chain, a small proportion of B cells and monocytes in peripheral blood also express IFN-λR1. Despite receptor expression, robust STAT phosphorylation in response to IFN-λ was only observed in pDCs. Similarly, ISG induction in response to IFN-λ was significantly higher in pDCs compared to B cells or monocytes. Our data confirm that pDCs are the predominant IFN-λ-responsive cell type within peripheral blood under normal conditions.
Several previous studies have demonstrated that epithelial cells, including hepatocytes, express the IFN-λ receptor and are responsive to IFN-λ (Sommereyns and others 2008; Dickensheets and others 2013), while PBMCs (lymphocytes and monocytes) fail to respond directly to IFN-λ (Witte and others 2009; Dickensheets and others 2013). These studies defined receptor expression using PCR-based techniques rather than direct detection of receptor expression on cell surfaces. Also, most studies used Western blot to visualize STAT proteins, which lacks the sensitivity to accurately measure STAT phosphorylation in rare immune cell populations. To overcome these technical limitations, we adopted sensitive flow cytometry-based approaches for the analysis of IFN-λ receptor expression and STAT protein phosphorylation (Miyagi and others 2010). This approach has been used previously by Witte and others to study IFN-λ response in lymphocytes and monocytes (Witte and others 2009) but we extended our study to include additional rare cell types such as DCs. We developed a staining strategy using antibody combinations that allowed us to detect pSTAT 1, 3, 4, 5, and 6 in CD45+ total PBMCs, CD3+ T cells, CD19+ B cells, CD14+ monocytes, and CD303+ (BDCA-2) pDCs. In addition, we utilized a whole blood staining protocol, performed using freshly drawn blood, which preserves rare cell populations and minimizes cell manipulation to reduce basal signal activation (Chow and others 2005). This experimental strategy enabled quantitative measurement of STAT phosphorylation within a mixed population of cells and excluded potential inductive effects of cell isolation.
We found that pDCs and a small proportion of B cells and monocytes expressed IFN-λ receptor on their cell surface, providing the potential for these cells to respond to IFN-λ. IFN-λ1 did not induce detectable STAT phosphorylation when CD45+ PBMCs were examined as a whole, in stark contrast to robust pSTAT1 and 3 induced by IFN-α. Of the immune cell types assessed, only pDCs responded to IFN-λ1, with increased pSTAT1, pSTAT3, and pSTAT5 observed. This is in agreement with a previous report showing pSTAT1 in response to IFN-λ in pDCs (Yin and others 2012). The pDC population represents less than 1% of total leukocytes and therefore any STAT response in this small population will be masked in whole PBMC preparations. Despite the lack of STAT phosphorylation detected in B cells and monocytes in response to IFN-λ treatment, ISG expression was increased in these cells. T cells did not upregulate ISG in response to IFN-λ treatment, corresponding with the fact that very few, if any, CD3+ T cells expressed IFN-λR1. The minimal IFN-λ response observed in B cells and monocytes may play a role in priming these cell types and indeed previous research has indicated that monocytes become responsive to IFN-λ during their development into monocyte-derived macrophages (Liu and others 2011). Monocytes have been reported to produce IL-6, IL-8, and IL-10 in response to IFN-λ (Jordan and others 2007a). This implies that monocytes are capable of responding to IFN-λ under certain conditions. Our observation of B-cell expression of the IFN-λR1 and ISG induction is supported by a recent study, which found that the receptor is expressed on both naïve and memory B cells and that treatment with IFN-λ did induce ISGs OAS and Mx1. However, IFN-λ-induced B-cell activation and changes in antibody and cytokine production only occurred in the presence of a TLR7 ligand (de Groen and others 2015). This finding highlights the importance of the environmental context and presence of co-stimulatory signals in the function of IFN-λ. Our results indicate that IFN-λ may also prime or have indirect effects on both monocytes and B cells, in addition to the more pronounced direct effects on pDCs.
IFN-λ1 induces phosphorylation of STAT1, 3, and 5 in pDCs in a dose and time-dependent manner. This pattern of STAT phosphorylation in pDCs in response to IFN-λ1 parallels that seen following IFN-α stimulation, with one exception; IFN-α is capable of inducing phosphorylation of STAT6 in pDCs, while IFN-λ1 is not. The activation of STAT6 by Type I IFNs has been described in B-cell lines (Gupta and others 1999) and human T cells (Eriksen and others 2004) but, to the best of our knowledge, has not been previously reported in pDCs. STAT6 is likely to be of importance in the innate immune response, as STAT6 knockout mice show higher susceptibility to infection (Chen and others 2011). This unique pattern of STAT6 responsiveness may explain the functional divergence in the response to Type I and Type III IFNs, with further study required to establish the biological relevance of this observation.
It has been established that a significant amount of IFN-λ is produced by human CD141+ DCs (Kelly and others 2014) or murine CD8α+ DCs (Lauterbach and others 2010); it is also produced by pDCs (Yin and others 2012; Zhang and others 2013) although at lower levels than mDCs (Zhang and others 2013). DCs serve as a key link between the innate and adaptive immune response and IFN produced by DCs is known to act in a paracrine and autocrine manner to promote differentiation and maturation of DCs (Montoya and others 2002). Therefore, IFN-λ produced by mDCs in response to TLR ligation may serve to promote strong pSTAT responses in neighboring pDCs, thus amplifying the response. This is supported by previous studies suggesting that IFN-λ sustains IFN-α production by pDCs in viral infection (Yin and others 2012; Zhang and others 2013).
Our evaluation of the peripheral blood leukocyte response to IFN-λ treatment clearly shows pDCs are the predominant direct immunological target of IFN-λ in the blood. However, IFN-λ may also act on other immune cell types particularly B cells and monocytes given that a proportion of these cells express the receptor. Studies of the immunological effects of IFN-λ should not solely focus on pDC but also consider the effects on B cells and monocytes under the given conditions.
Acknowledgments
This study was supported by Science Foundation Ireland (grant # 12/IA/1667) and the Irish Health Research Board (grant # TRA/2007/14). Prof. Christine Biron is supported by the National Institutes of Health, USA.
Author Disclosure statement
No competing financial interests exist.
References
- Ank N, Iversen MB, Bartholdy C, Staeheli P, Hartmann R, Jensen UB, Dagnaes-Hansen F, Thomsen AR, Chen Z, Haugen H, Klucher K, Paludan SR. 2008. An important role for type III interferon (IFN-lambda/IL-28) in TLR-induced antiviral activity. J Immunol 180(4):2474–2485 [DOI] [PubMed] [Google Scholar]
- Chen H, Sun H, You F, Sun W, Zhou X, Chen L, Yang J, Wang Y, Tang H, Guan Y, Xia W, Gu J, Ishikawa H, Gutman D, Barber G, Qin Z, Jiang Z. 2011. Activation of STAT6 by STING is critical for antiviral innate immunity. Cell 147(2):436–446 [DOI] [PubMed] [Google Scholar]
- Chow S, Hedley D, Grom P, Magari R, Jacobberger JW, Shankey TV. 2005. Whole blood fixation and permeabilization protocol with red blood cell lysis for flow cytometry of intracellular phosphorylated epitopes in leukocyte subpopulations. Cytometry A 67(1):4–17 [DOI] [PubMed] [Google Scholar]
- de Groen RA, Groothuismink ZM, Liu BS, Boonstra A. 2015. IFN-lambda is able to augment TLR-mediated activation and subsequent function of primary human B cells. J Leukoc Biol 98(4):623–630 [DOI] [PubMed] [Google Scholar]
- Dickensheets H, Sheikh F, Park O, Gao B, Donnelly RP. 2013. Interferon-lambda (IFN-lambda) induces signal transduction and gene expression in human hepatocytes, but not in lymphocytes or monocytes. J Leukoc Biol 93(3):377–385 [DOI] [PMC free article] [PubMed] [Google Scholar]
- Eriksen KW, Sommer VH, Woetmann A, Rasmussen AB, Brender C, Svejgaard A, Skov S, Geisler C, Odum N. 2004. Bi-phasic effect of interferon (IFN)-alpha: IFN-alpha up- and down-regulates interleukin-4 signaling in human T cells. J Biol Chem 279(1):169–176 [DOI] [PubMed] [Google Scholar]
- Gallagher G, Megjugorac NJ, Yu RY, Eskdale J, Gallagher GE, Siegel R, Tollar E. 2010. The lambda interferons: guardians of the immune-epithelial interface and the T-helper 2 response. J Interferon Cytokine Res 30(8):603–615 [DOI] [PubMed] [Google Scholar]
- Gaudieri S, Lucas M, Lucas A, McKinnon E, Albloushi H, Rauch A, di Iulio J, Martino D, Prescott SL, Tulic MK. 2012. Genetic variations in IL28B and allergic disease in children. PLoS One 7(1):e30607. [DOI] [PMC free article] [PubMed] [Google Scholar]
- Ge D, Fellay J, Thompson AJ, Simon JS, Shianna KV, Urban TJ, Heinzen EL, Qiu P, Bertelsen AH, Muir AJ, Sulkowski M, McHutchison JG, Goldstein DB. 2009. Genetic variation in IL28B predicts hepatitis C treatment-induced viral clearance. Nature 461(7262):399–401 [DOI] [PubMed] [Google Scholar]
- Gupta S, Jiang M, Pernis AB. 1999. IFN-alpha activates Stat6 and leads to the formation of Stat2:Stat6 complexes in B cells. J Immunol 163(7):3834–3841 [PubMed] [Google Scholar]
- Jilg N, Lin W, Hong J, Schaefer EA, Wolski D, Meixong J, Goto K, Brisac C, Chusri P, Fusco DN, Chevaliez S, Luther J, Kumthip K, Urban TJ, Peng LF, Lauer GM, Chung RT. 2014. Kinetic differences in the induction of interferon stimulated genes by interferon-alpha and interleukin 28B are altered by infection with hepatitis C virus. Hepatology 59(4):1250–1261 [DOI] [PMC free article] [PubMed] [Google Scholar]
- Jordan WJ, Eskdale J, Boniotto M, Rodia M, Kellner D, Gallagher G. 2007a. Modulation of the human cytokine response by interferon lambda-1 (IFN-lambda1/IL-29). Genes Immun 8(1):13–20 [DOI] [PubMed] [Google Scholar]
- Jordan WJ, Eskdale J, Srinivas S, Pekarek V, Kelner D, Rodia M, Gallagher G. 2007b. Human interferon lambda-1 (IFN-lambda1/IL-29) modulates the Th1/Th2 response. Genes Immun 8(3):254–261 [DOI] [PubMed] [Google Scholar]
- Kelly A, Fahey R, Fletcher JM, Keogh C, Carroll AG, Siddachari R, Geoghegan J, Hegarty JE, Ryan EJ, O'Farrelly C. 2014. CD141(+) myeloid dendritic cells are enriched in healthy human liver. J Hepatol 60(1):135–142 [DOI] [PubMed] [Google Scholar]
- Koltsida O, Hausding M, Stavropoulos A, Koch S, Tzelepis G, Ubel C, Kotenko SV, Sideras P, Lehr HA, Tepe M, Klucher KM, Doyle SE, Neurath MF, Finotto S, Andreakos E. 2011. IL-28A (IFN-lambda2) modulates lung DC function to promote Th1 immune skewing and suppress allergic airway disease. EMBO Mol Med 3(6):348–361 [DOI] [PMC free article] [PubMed] [Google Scholar]
- Kotenko SV, Gallagher G, Baurin VV, Lewis-Antes A, Shen M, Shah NK, Langer JA, Sheikh F, Dickensheets H, Donnelly RP. 2003. IFN-lambdas mediate antiviral protection through a distinct class II cytokine receptor complex. Nat Immunol 4(1):69–77 [DOI] [PubMed] [Google Scholar]
- Lauterbach H, Bathke B, Gilles S, Traidl-Hoffmann C, Luber CA, Fejer G, Freudenberg MA, Davey GM, Vremec D, Kallies A, Wu L, Shortman K, Chaplin P, Suter M, O'Keeffe M, Hochrein H. 2010. Mouse CD8alpha+ DCs and human BDCA3+ DCs are major producers of IFN-lambda in response to poly IC. J Exp Med 207(12):2703–2717 [DOI] [PMC free article] [PubMed] [Google Scholar]
- Liu BS, Janssen HL, Boonstra A. 2011. IL-29 and IFNα differ in their ability to modulate IL-12 production by TLR-activated human macrophages and exhibit differential regulation of the IFNγ receptor expression. Blood 117(8):2385–2395 [DOI] [PubMed] [Google Scholar]
- Maher SG, Romero-Weaver AL, Scarzello AJ, Gamero AM. 2007. Interferon: cellular executioner or white knight? Curr Med Chem 14(12):1279–1289 [DOI] [PubMed] [Google Scholar]
- Marcello T, Grakoui A, Barba-Spaeth G, Machlin ES, Kotenko SV, MacDonald MR, Rice CM. 2006. Interferons alpha and lambda inhibit hepatitis C virus replication with distinct signal transduction and gene regulation kinetics. Gastroenterology 131(6):1887–1898 [DOI] [PubMed] [Google Scholar]
- Megjugorac NJ, Gallagher GE, Gallagher G. 2009. Modulation of human plasmacytoid DC function by IFN-lambda1 (IL-29). J Leukoc Biol 86(6):1359–1363 [DOI] [PubMed] [Google Scholar]
- Mennechet FJ, Uze G. 2006. Interferon-lambda-treated dendritic cells specifically induce proliferation of FOXP3-expressing suppressor T cells. Blood 107(11):4417–4423 [DOI] [PubMed] [Google Scholar]
- Miyagi T, Lee SH, Biron CA. 2010. Intracellular staining for analysis of the expression and phosphorylation of signal transducers and activators of transcription (STATs) in NK cells. Methods Mol Biol 612:159–175 [DOI] [PMC free article] [PubMed] [Google Scholar]
- Montoya M, Schiavoni G, Mattei F, Gresser I, Belardelli F, Borrow P, Tough DF. 2002. Type I interferons produced by dendritic cells promote their phenotypic and functional activation. Blood 99(9):3263–3271 [DOI] [PubMed] [Google Scholar]
- Mordstein M, Kochs G, Dumoutier L, Renauld JC, Paludan SR, Klucher K, Staeheli P. 2008. Interferon-lambda contributes to innate immunity of mice against influenza A virus but not against hepatotropic viruses. PLoS Pathog 4(9):e1000151. [DOI] [PMC free article] [PubMed] [Google Scholar]
- Pott J, Mahlakõiv T, Mordstein M, Duerr CU, Michiels T, Stockinger S, Staeheli P, Hornef MW. 2011. IFN-lambda determines the intestinal epithelial antiviral host defense. Proc Natl Acad Sci U S A 108(19):7944–7949 [DOI] [PMC free article] [PubMed] [Google Scholar]
- Robek MD, Boyd BS, Chisari FV. 2005. Lambda interferon inhibits hepatitis B and C virus replication. J Virol 79(6):3851–3854 [DOI] [PMC free article] [PubMed] [Google Scholar]
- Sheppard P, Kindsvogel W, Xu W, Henderson K, Schlutsmeyer S, Whitmore TE, Kuestner R, Garrigues U, Birks C, Roraback J, Ostrander C, Dong D, Shin J, Presnell S, Fox B, Haldeman B, Cooper E, Taft D, Gilbert T, Grant FJ, Tackett M, Krivan W, McKnight G, Clegg C, Foster D, Klucher KM. 2003. IL-28, IL-29 and their class II cytokine receptor IL-28R. Nat Immunol 4(1):63–68 [DOI] [PubMed] [Google Scholar]
- Sommereyns C, Paul S, Staeheli P, Michiels T. 2008. IFN-lambda (IFN-lambda) is expressed in a tissue-dependent fashion and primarily acts on epithelial cells in vivo. PLoS Pathog 4(3):e1000017. [DOI] [PMC free article] [PubMed] [Google Scholar]
- Suppiah V, Moldovan M, Ahlenstiel G, Berg T, Weltman M, Abate ML, Bassendine M, Spengler U, Dore GJ, Powell E, Riordan S, Sheridan D, Smedile A, Fragomeli V, Muller T, Bahlo M, Stewart GJ, Booth DR, George J. 2009. IL28B is associated with response to chronic hepatitis C interferon-alpha and ribavirin therapy. Nat Genet 41(10):1100–1104 [DOI] [PubMed] [Google Scholar]
- Tanaka Y, Nishida N, Sugiyama M, Kurosaki M, Matsuura K, Sakamoto N, Nakagawa M, Korenaga M, Hino K, Hige S, Ito Y, Mita E, Tanaka E, Mochida S, Murawaki Y, Honda M, Sakai A, Hiasa Y, Nishiguchi S, Koike A, Sakaida I, Imamura M, Ito K, Yano K, Masaki N, Sugauchi F, Izumi N, Tokunaga K, Mizokami M. 2009. Genome-wide association of IL28B with response to pegylated interferon-alpha and ribavirin therapy for chronic hepatitis C. Nat Genet 41(10):1105–1109 [DOI] [PubMed] [Google Scholar]
- Thomas DL, Thio CL, Martin MP, Qi Y, Ge D, O'Huigin C, Kidd J, Kidd K, Khakoo SI, Alexander G, Goedert JJ, Kirk GD, Donfield SM, Rosen HR, Tobler LH, Busch MP, McHutchison JG, Goldstein DB, Carrington M. 2009. Genetic variation in IL28B and spontaneous clearance of hepatitis C virus. Nature 461(7265):798–801 [DOI] [PMC free article] [PubMed] [Google Scholar]
- Waddell SJ, Popper SJ, Rubins KH, Griffiths MJ, Brown PO, Levin M, Relman DA. 2010. Dissecting interferon-induced transcriptional programs in human peripheral blood cells. PLoS One 5(3):e9753. [DOI] [PMC free article] [PubMed] [Google Scholar]
- Witte K, Gruetz G, Volk HD, Looman AC, Asadullah K, Sterry W, Sabat R, Wolk K. 2009. Despite IFN-lambda receptor expression, blood immune cells, but not keratinocytes or melanocytes, have an impaired response to type III interferons: implications for therapeutic applications of these cytokines. Genes Immun 10(8):702–714 [DOI] [PubMed] [Google Scholar]
- Yin Z, Dai J, Deng J, Sheikh F, Natalia M, Shih T, Lewis-Antes A, Amrute SB, Garrigues U, Doyle S, Donnelly RP, Kotenko SV, Fitzgerald-Bocarsly P. 2012. Type III IFNs are produced by and stimulate human plasmacytoid dendritic cells. J Immunol 189(6):2735–2745 [DOI] [PMC free article] [PubMed] [Google Scholar]
- Zhang L, Jilg N, Shao RX, Lin W, Fusco DN, Zhao H, Goto K, Peng LF, Chen WC, Chung RT. 2011. IL28B inhibits hepatitis C virus replication through the JAK-STAT pathway. J Hepatol 55(2):289–298 [DOI] [PMC free article] [PubMed] [Google Scholar]
- Zhang S, Kodys K, Li K, Szabo G. 2013. Human type 2 myeloid dendritic cells produce interferon-lambda and amplify interferon-alpha in response to hepatitis C virus infection. Gastroenterology 144(2):414–425 e7 [DOI] [PMC free article] [PubMed] [Google Scholar]
- Zhu H, Butera M, Nelson DR, Liu C. 2005. Novel type I interferon IL-28A suppresses hepatitis C viral RNA replication. Virol J 2:80. [DOI] [PMC free article] [PubMed] [Google Scholar]