

Abstract
Notch signaling is a conserved pathway of communication between neighboring cells that results in cell fate specification, and CSL is the universal transcriptional effector of Notch signaling. The Notch intracellular domain translocates to the nucleus after proteolytic release upon Notch extracellular engagement, and there it displaces corepressors from DNA-bound CSL and recruits activators of Notch target genes. Here we report the 2.85 Å crystal structure of CSL with a target DNA. CSL comprises three structurally integrated domains: its amino (NTD)- and carboxy (CTD)-terminal domains are strikingly similar to those of Rel transcription factors, but a surprising beta-trefoil domain (BTD) is inserted between them. CSL-bound DNA is recognized specifically by conserved residues from NTD and BTD. A hydrophobic pocket on BTD is identified as the likely site of Notch interaction with CSL, which has functional implications for the mechanism of Notch signaling.
Keywords: beta-trefoil domain, Lag-1, RAM domain, Rel homology region, transcription factor
Introduction
Notch signaling is one of the main mechanisms by which different cell types are generated from equivalent precursor cells. It functions in metazoan cell fate decisions and has important roles in cellular development, differentiation, proliferation, and apoptosis (reviewed in Greenwald, 1998; Artavanis-Tsakonas et al, 1999). Aberrant Notch signaling is associated with human neural disorders, developmental defects, and cancer (reviewed in Gridley, 2003; Maillard and Pear, 2003).
The central components of the Notch signaling pathway are the ligand DSL, the receptor Notch, and the nuclear effector CSL. The ligand DSL (Delta, Serrate, Lag-2) and the effector CSL (CBF1/RBP-Jκ, Su(H), Lag-1) are collectively named (for the mammalian, Drosophila melanogaster, and Caenorhabditis elegans orthologs, respectively). Both DSL and Notch are modular type I transmembrane proteins, which engage one another to effect intracellular signaling. CSL is a DNA-binding transcription factor that converts extracellular signals into changes in gene expression.
When the Notch receptor on one cell interacts with the DSL ligand from a neighboring cell, two proteolytic cleavages release Notch intracellular domain (NotchIC) from the cell membrane (reviewed in Mumm and Kopan, 2000). NotchIC consists of the membrane-proximal RAM (RBP-Jκ-associated molecule) domain followed by seven consecutive ankyrin repeats and a carboxy-terminal PEST sequence. It also contains two nuclear localization signals, and NotchIC translocates to the nucleus after cleavage and release. There it interacts with CSL and activates transcription of Notch targets.
CSL is required for both repression and activation of Notch target genes. The activity of CSL resident at a cognate DNA site is determined by the interactions of CSL with coregulators and the basal transcriptional machinery, and interaction of NotchIC with CSL throws the switch from repression to activation (Mumm and Kopan, 2000). CSL has been shown in vitro by oligo enrichment experiments to bind specifically with nanomolar-level affinity to the DNA sequence 5′-CGTGGGAA-3′ (Chung et al, 1994; Tun et al, 1994). This sequence agrees with known in vivo binding sites, which are not always proximate to promoters (e.g. Nellesen et al, 1999).
CSL functions as a transcriptional repressor in the absence of Notch signals by recruiting factors to form a multiprotein transcriptional corepressor complex (Mumm and Kopan, 2000). In particular, CSL interacts directly with the corepressors SMRT (silencing mediator of retinoid and thyroid receptors)/N-Cor (nuclear receptor corepressor) (Kao et al, 1998) and CIR (CBF1 interacting corepressor) (Hsieh et al, 1999) along with the nuclear factor SKIP, an adaptor protein that interacts simultaneously with CSL and corepressors (Zhou et al, 2000). Molecular details of CSL-mediated repression are incompletely understood, but CSL-associated corepressors are thought to recruit histone deacetylases, which then silence regions of chromatin controlled by CSL.
Activation of transcription is thought to occur by displacement of the corepressor complex from CSL by NotchIC and subsequent recruitment of histone acetyltransferases (HATs) and a Mastermind-like coactivator (Mumm and Kopan, 2000). The mechanism of displacement and recruitment is unclear; however, the binding of NotchIC and that of the corepressor SMRT to CSL are mutually exclusive, whereas the adaptor protein SKIP interacts with either NotchIC or SMRT but not both simultaneously (Zhou et al, 2000). NotchIC interacts with CSL primarily through its RAM domain (Tamura et al, 1995), which is largely unstructured when alone (Nam et al, 2003), and with SKIP through its ankyrin repeats (Zhou et al, 2000). The ankyrin repeats of tethered NotchIC recruit the HAT-containing transcription factors PCAF and GCN5 and also Mastermind to the CSL complex (Mumm and Kopan, 2000).
Opportunistic viruses, such as Epstein–Barr virus (EBV), adenovirus, and Kaposi's sarcoma-associated herpesvirus (KSHV), exploit Notch signaling. Notably, binding of CSL to DNA sites within the EBV genome is required for the regulation of latent viral transcriptional events (Ling et al, 1993), and the EBNA2 (Epstein–Barr virus nuclear antigen 2) protein is essential for this process (Henkel et al, 1994). EBNA2 is thought to act in an analogous manner to NotchIC, displacing corepressor complexes from CSL (Hsieh and Hayward, 1995).
CSL proteins have been highly conserved through evolution; the sequence identity between disparate organisms is very high, for example, 84% between D. melanogaster and humans. All CSL proteins share a conserved core of approximately 425 residues, but often have amino- and carboxy-terminal extensions that are not conserved between organisms. The only detectable sequence homology within CSL is to an IPT/TIG domain (Pfam PF01833) in the carboxy-terminal region of the core (Fuchs et al, 2001). IPT/TIG domains have immunoglobin-like (Ig-like) folds and are also found in the Rel homology region (RHR) family of transcription factors, which contain a carboxy-terminal IPT/TIG domain (RHR-C) as well as another Ig-like domain, RHR-N (Pfam PF00554).
Here we report the atomic structure of CSL complexed with a natural cognate DNA. CSL has structural similarities with Rel transcription factors not evident in sequences, and it includes an unprecedented transcription factor domain with a beta-trefoil fold. The structure provides a detailed rationale for sequence specificity in CSL binding sites, and it inspires a compelling hypothesis for the Notch interaction with CSL. Consistent with this hypothesis, we show that a short peptide from C. elegans NotchIC binds specifically to isolated beta-trefoil-like domains from both worm and mouse CSL.
Results
Structure determination and overall fold
We used a structural-genomics-based approach to screen CSL proteins from numerous organisms and to identify constructs amenable to crystallization and diffraction analysis. We reasoned, due to the high degree of sequence identity between CSL orthologs (Figure 1A), that determining the structure of any one of the CSL proteins would be representative of the CSL fold for the entire family. Ultimately, we chose the C. elegans ortholog Lag-1 for structure determination. The CSL core of Lag-1 (residues 192–663), comprising the entire region conserved among CSL orthologs, was co-crystallized with a 13-mer duplex of DNA that contained single-stranded 5′ TT and AA overhangs on the coding and template strands, respectively. This DNA sequence, which comes from a region within the mammalian HES-1 promoter, conforms to the highly restrictive consensus sequence of in vivo CSL binding sites from different organisms.
Figure 1.
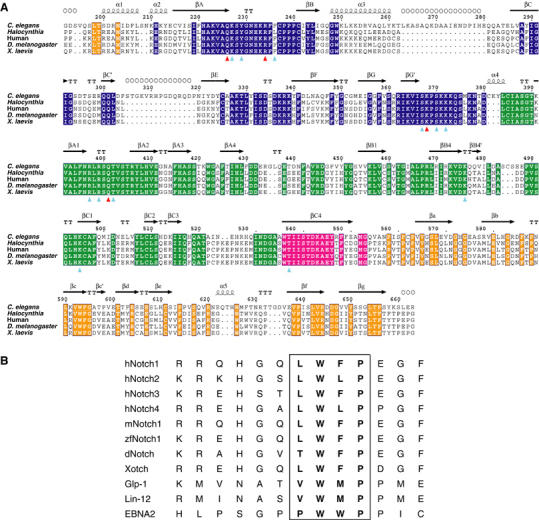
Sequence conservation of CSL core regions and Notch RAM domains. (A) Sequence alignment of CSL orthologs from C. elegans, Halocynthia, human, D. melanogaster, and Xenopus laevis. The domain boundaries are colored blue for NTD, green for BTD, and orange for CTD. Strand βC4, which bridges all three domains, is colored magenta. Identical residues are highlighted and colored according to domain location. Secondary structural elements derived from the refined structure are noted above the sequence, in which α=helix, β=strand, T=turn. Open circles above sequence alignment denote two disordered loop regions that are not observed in the electron-density map. Naming conventions for NTD and CTD secondary structural elements are consistent with the Rel proteins, and the BTD secondary structure naming uses the interleukin-1α convention. Residue side chains that make DNA contacts are denoted by colored triagonals below the sequence alignment, red for specific DNA interactions (Asn226, Arg234, Lys368, Gln401) and cyan for DNA backbone contacts. Sequences were aligned with CLUSTALW (Thompson et al, 1994) and the figure was created with ESPript (Gouet et al, 1999). Secondary structure was determined by the DSSP (Kabsch and Sander, 1983) implementation in ESPript and modified where necessary to conform to aforementioned conventions. (B) Sequence alignment of amino-terminal portions of NotchIC RAM domains from various organisms. Highlighted is the conserved nonpolar ΦWΦP motif (Φ=hydrophobic) that likely interacts with the hydrophobic pocket of BTD.
The crystal structure of the CSL:DNA complex was determined primarily from MAD phasing with the selenomethionyl (SeMet) protein and then refined to 2.85 Å resolution with the native protein. The electron-density map is continuous for the DNA and for protein residues 195–660 except for two breaks, between 262–280 and 304–319, both of which correspond to unique insertions in the C. elegans sequence (Figure 1A).
Core CSL comprises three structural domains, each of which is similar to known structures. The C-terminal domain (CTD) as predicted is indeed similar to an IPT/TIG domain (RHR-C) and the N-terminal domain (NTD) in fact resembles an RHR-N domain, despite the lack of a detectable sequence signature, but to our complete surprise the central domain is a modified beta-trefoil domain (Pfam PF00167) (Figure 2). This beta-trefoil domain (BTD) is inserted precisely at what would be the juncture between RHR-N and RHR-C domains in a Rel protein if structurally aligned with CSL (Figure 2). The resulting unusual Rel domain organization corrects an erroneous suggestion placing an RHR-N domain where BTD actually occurs (Nam et al, 2003).
Figure 2.
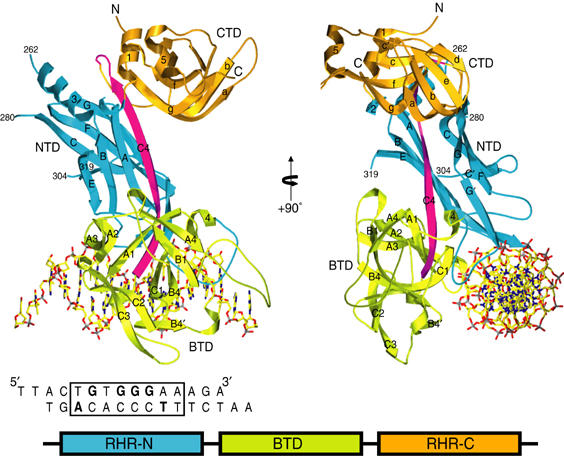
Ribbon representation of the CSL–DNA complex and domain organization. Orthogonal views are shown. NTD is colored blue, BTD green, and CTD orange. Secondary structural elements are labeled where visible. The boundaries of the main-chain Cα atoms that were not modeled in the structure, residues 262, 280, 304, and 319, are labeled. The piece of DNA used in the structural determination is shown and approximately aligned with the protein–DNA complex on the left. A schematic representation of the domain arrangements is also shown. The figure was created with Molscript (Kraulis, 1991) and Povscript (Fenn et al, 2003).
The BTD insertion includes a long β-strand (C4, residues 536–551) that serves as a central organizing feature of CSL, contributing to β-sheets in all three domains. Moreover, structurally, the N-terminal helix α1 is an integral part of CTD. As a result, CSL is not a beads-on-a-string protein; rather, the domain architecture is integrated into an overall CSL fold with substantial, specific contacts between domains. The NTD–CTD interface buries 7378 Å2 and the NTD–BTD interface buries 9324 Å2. CSL binds DNA as a monomer, making extensive contacts from the NTD and BTD domains but none from the CTD domain (Figure 2).
Relationship to Rel proteins
Domains NTD and CTD of CSL and both Rel domains share a common core of seven β-strands (designated A, B, C, C′, E, F, G in NTD and a, b, c, c′, e, f, g in CTD), which are organized into the sandwich of three- and four-stranded β-sheets that is characteristic of the Ig-like fold (Figures 1, 2 and 3). The relative disposition of sheets is distinctive, however, such that NTD is more like RHR-N domains and CTD is more like RHR-C domains.
Figure 3.
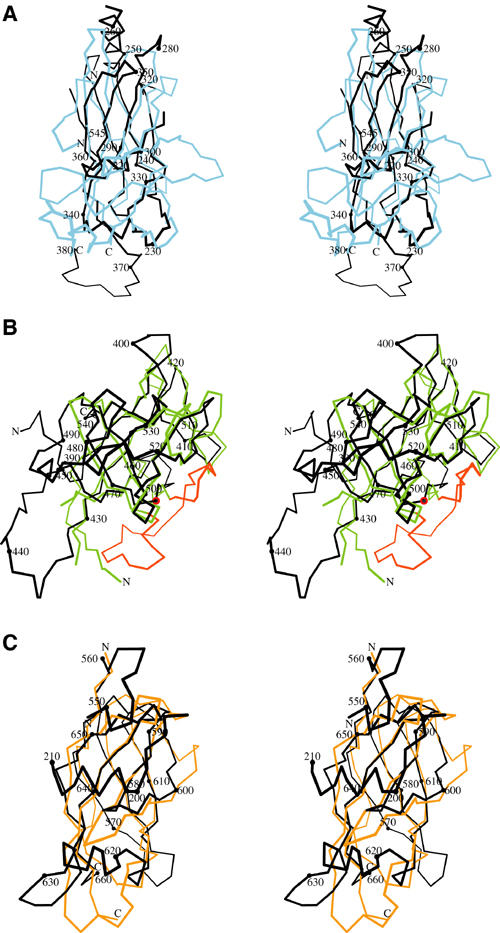
Structural comparison of CSL with the Rel proteins and interleukin-1α. Individual domains of CSL were submitted to the DALI server for structural similarity analysis. The figure was created with Bobscript (Esnouf, 1997). (A) Stereo diagram of the Cα overlay of the NTD of CSL (black) with the RHR-N domain of NFAT (blue) from the NFAT–Fos/Jun–DNA (1A02) complex. A total of 97 Cα atoms from CSL and NFAT were overlaid with an r.m.s.d. of 2.7 Å. (B) Stereo diagram of the Cα overlay of the BTD of CSL (black) with interleukin-1α (2ILA) colored in green. Strands B2 and B3 from interleukin-1α are colored red and represent the strands that are absent in the CSL beta-trefoil fold. A red sphere highlights residue Pro467 of CSL, which denotes where strands B2 and B3 would be inserted into the structure. For the structural comparison, 100 Cα atoms were overlaid with an r.m.s.d. of 2.2 Å. (C) Stereo diagram of the Cα overlay of the CTD of CSL (black) with the RHR-C domain of p65 (orange) from the NF-κB–IκB complex (1NFI). A total of 78 Cα atoms were overlaid with an r.m.s.d. of 2.1 Å.
A prominent distinguishing feature of NTD is an additional strand, βC4, which hydrogen bonds with βA to expand the E–B–A sheet. This addition to NTD is the central segment of a long β-strand that starts in BTD and extends on into CTD. The CSL fold also uniquely contains an N-terminal extension, helices α1 and α2 upstream of βA, which is integrated into the CTD domain. Other structural differences between NTD and RHR-N occur at the connections between core β-strands (Figure 3A). Helix α3 is inserted between βB and βC in CSL, and Rel family members have major insertions relative to CSL between βC and βC′ and between βE and βF. The latter contributes to DNA binding by RHR-N.
Consistent with its identifiability as an IPT/TIG domain, the core of CTD is more like RHR-C domains than NTD is like RHR-N domains (Figure 3A and C). Nevertheless, there are notable differences. The loop between βa and βb differs in conformation, a short helix (α5) is inserted between βe and βf in CSL, and this is accommodated by a foreshortening of the βc–βc′ hairpin. CTD also incorporates N-terminal helices α1 and α2, which add across the domain parallel with the α5 excursion, and the end of βC4 adds to in the g–f–c–c′ sheet alongside βg.
Relative domain disposition
Although CSL and Rel domain proteins are similar within the respective domains, the relative disposition of domains in CSL differs radically from that in counterpart structures (Figure 4). What is similar is the orientation of NTD with respect to DNA in CSL in comparison with the RHR-N domains in NF-κB (Ghosh et al, 1995; Muller et al, 1995) and NFAT (Chen et al, 1998) (compare blue domains in Figure 4). In contrast, however, the CTD of CSL is swung completely away from the DNA and is in a conformation that results in no DNA contacts and no dimerization contacts (compare orange domains in Figure 4). Therefore, it appears that CTD in CSL functions differently from RHR-C domains in Rel proteins.
Figure 4.
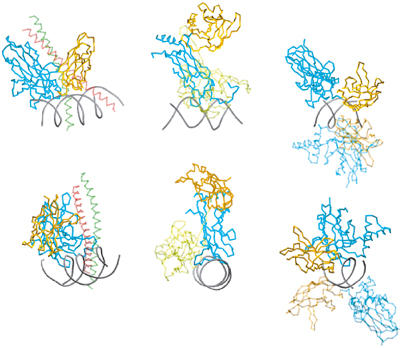
Arrangement of CTD and RHR-C with respect to NTD and RHR-N. The orientation of CTD and RHR-C in relation to NTD and RHR-N and DNA were compared for CSL and Rel proteins. The NFAT/Fos-Jun/DNA (1A02) structure is depicted on the left, the p52 homodimer–DNA structure (1A3Q) is displayed on the right, and the CSL–DNA structure is in the middle. In each case, RHR-N or NTD is colored blue and RHR-C or CTD is orange. For the comparison, the NFAT and p52 RHR-N domains were overlaid with the NTD of CSL. The p52 protomer that is not used for the overlay is lightly shaded. The orientation of RHR-N and NTD with respect to the DNA is similar in all cases; however, the resulting orientation of the RHR-C domain is different in all three examples, and unlike the RHR-C domains of NFAT and p52, the CSL CTD does not contact DNA, nor is it involved in any protein–protein interactions that promote dimerization. The figure was created with Molscript and Povscript (Kraulis, 1991; Fenn et al, 2003).
Beta-trefoil domain
Peculiar to the CSL fold, compared with the prototypical Rel topology, a novel domain, BTD, is inserted between NTD and CTD (Figure 3B). The beta-trefoil fold is a capped β-barrel with an approximate three-fold symmetry that is commonly associated with cytokines such as fibroblast growth factors and interleukin-1 (Murzin et al, 1992). The topology of this superfamily can be thought of as four strands that are repeated in a three-fold arrangement, where strands 1 and 4 form the walls of the β-barrel and strands 2 and 3 contribute to the cap structure to give a 12-stranded structure. These 12 strands are denoted A1–4, B1–4, and C1–4 using the interleukin-1α convention (Graves et al, 1990) (Figures 1A and 2).
The BTD of CSL departs strikingly from the beta-trefoil fold in the complete absence of strands βB2 and βB3 that ordinarily would contribute to the cap structure of the β-barrel (Figure 3B). This results in an exposed nonpolar pocket on the face of BTD opposite of that used for DNA binding (Figures 5B and 6C). This pocket penetrates into the interior of BTD with the walls and floor formed exclusively by the side chains of phenylalanine, isoleucine, and leucine residues. The pocket region is remarkably well conserved (Figure 5D). A general destabilization of BTD in comparison to NTD and CTD is also observed as judged by the overall elevation of atomic mobility factors of this domain (Figure 5E), particularly evident at regions around the hydrophobic pocket.
Figure 5.
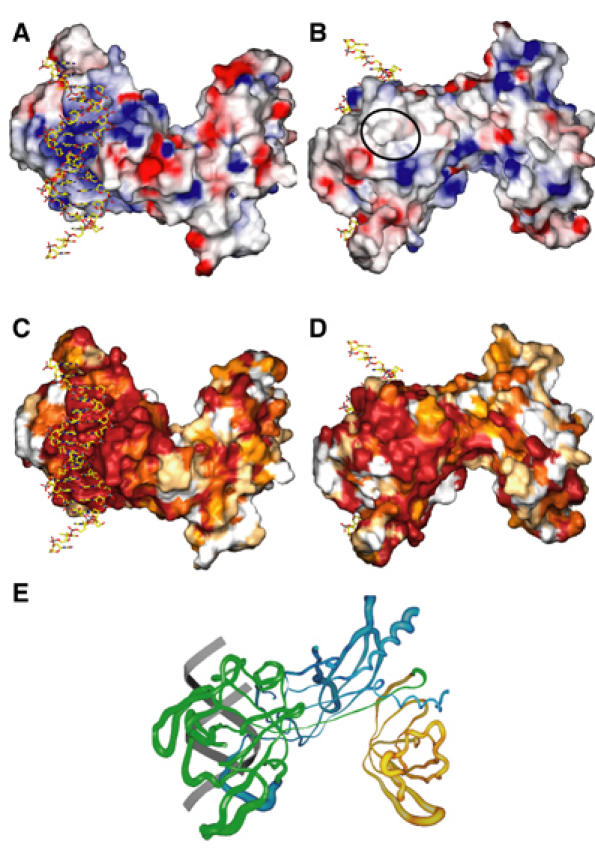
Molecular surface and B-factor analysis. The molecular surfaces in panels A–D were calculated in GRASP (Nicholls et al, 1993) and rendered in Povscript (Fenn et al, 2003). (A) Electrostatic surface representation of CSL bound to DNA. Negative electrostatic potential is red, positive is blue, and white regions are neutral (nonpolar). A prominent region of positive charge on the protein interacts with DNA. (B) 180° view from (A) which shows the nonpolar surface, top left, located on a face of the BTD that is opposite of that used for DNA binding. The approximate location of the hydrophobic pocket is denoted by a black oval. (C) Sequence conservation is mapped to the molecular surface in a color gradient manner, such that dark red, orange, yellow, and white represent regions of absolute identity, high and moderate similarity, and regions of no conservation, respectively. The orientation is as in (A). The protein–DNA interface is entirely conserved. (D) View of mapping of (C) in the orientation of (B). The hydrophobic pocket is also highly conserved. (E) Worm representation of atomic mobility along the CSL backbone. The view and orientation is similar to (B). BTD is colored green, NTD blue, and CTD orange. A schematic representation of the DNA backbone is colored gray. Crystallographic B-factors from the Cα backbone of the refined structure represent atomic mobility and are mapped to the backbone worm with a worm radius proportional to the B-factor; regions of low mobility have a thinner backbone worm and regions of high mobility have a thicker backbone worm. Overall B-factors are higher in the BTD than in the NTD and the CTD domains. The figure was created with SPOCK (Christopher, 1998).
Figure 6.
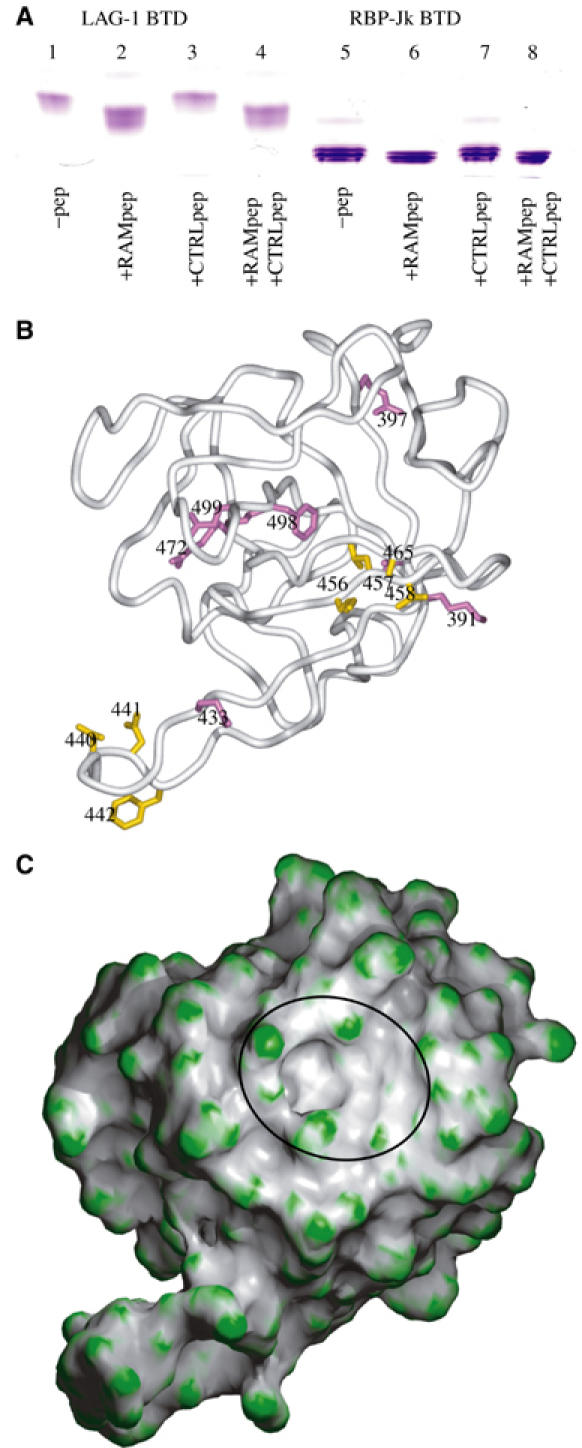
BTD analysis. (A) RAM peptide binding to the isolated BTDs analyzed by native gel electrophoresis. The Lin-12 RAM peptide (RMINASVWMPPME) and the reverse-sequence control peptide (EMPPMWVSANIMR) were incubated with the isolated BTDs from C. elegans Lag-1 (375–575) and murine RBP-Jκ (203–393). BTD gel mobilities increase for the RAM peptide/BTD complexes (lanes 2, 4 and 6, 8) relative to the peptide-free BTDs (lanes 1 and 5). BTD mobilities are unchanged when only in the presence of the control peptides (lanes 3 and 7). The gel shift is less with RBP-Jκ because this protein has higher net negative charge than Lag-1. (B) Previously reported CSL mutations are mapped onto the Cα-trace of BTD. The view is similar to (C). Mutations in residues that affect specifically NotchIC RAM domain interaction are colored purple. These include murine CSL mutations KV212GS (KV391GS), RK291GS (RK472GS), FY314GS (FQ498GS), R218H (R397H), and ΔD254 (ΔE433) (Sakai et al, 1998; Fuchs et al, 2001). Mutations in residues that affect NotchIC interaction and interactions with the corepressors SMRT or CIR are colored gold. These include human CSL mutations EEF233AAA (DNF440AAA) and KLV249AAA (KLV456AAA), and murine mutations F261L (F442L), K275M (K456M), and A284V (A465V) (Hsieh et al, 1999; Fuchs et al, 2001). The original mutations and numbering are denoted with the equivalent residues from Lag-1 in parentheses. Overall, the mutations roughly map to two regions on BTD. The first region is proximal to the hydrophobic pocket. This region is populated by purple residues that affect NotchIC RAM interaction but not corepressor interaction. The second region maps to areas adjacent to the hydrophobic pocket and to an extended loop of BTD. This region is populated by gold-colored residues that affect both NotchIC RAM domain and corepressor interactions. The figure was created with Povscript (Fenn et al, 2003). (C) BTD surface of molecular curvature, colored green for regions of positive curvature and gray for regions of negative curvature. A distinct pocket is visible in the region where strands B2 and B3 would be in a prototypical beta-trefoil fold, and is denoted by a black oval. The figure was created with GRASP and Povscript (Nicholls et al, 1993; Fenn et al, 2003).
The BTD of CSL also deviates from the prototypical beta-trefoil at several strand interconnections (Figure 3B). The loop between βA1 and βA2 is lengthened in CSL and contributes to DNA binding. There is a dramatic extension of the loop between βA4 and βB1. This loop is roughly parallel to the axis of the DNA in the complex, projecting away from the body of the protein, and is in a conformation that would be compatible for interacting with other factors. Interestingly, mutations in this loop abolish the repression function of CSL (Kao et al, 1998; Hsieh et al, 1999), presumably by disrupting the interaction of CSL with one or more of its corepressors.
BTD interaction with NotchIC and coregulators
In order to localize the primary interaction between NotchIC and CSL, we have dissected both components and tested them for biochemical association. A 13-mer peptide derived from the RAM domain of the C. elegans Notch ortholog Lin-12 interacts tightly and specifically with BTD constructs from both Lag-1 and the mouse CSL ortholog RBP-Jκ (Figure 6A). The worm–mouse cross reaction is remarkable since this worm peptide is the same at only two to four positions of corresponding segments in the four natural Notch ligands of mouse CSL. The one feature shared by all NotchIC peptides is a ΦWΦP (Φ=hydrophobic) tetrapeptide motif (Figure 1B). Our results are consistent with previous work showing that NotchIC interacts with CSL primarily through a central region (Hsieh and Hayward, 1995), now identified structurally as BTD, and that CSL interacts with NotchIC through a portion within 50 membrane-proximal residues in its RAM domain (Tamura et al, 1995). Moreover, EBNA2, the protein by which EBV co-opts CSL activation, associates with CSL through a nine-residue segment (Ling and Hayward, 1995) that also contains the ΦWΦP motif (Figure 1B).
CSL mutations that affect either NotchIC or corepressor interactions with CSL (Kao et al, 1998; Sakai et al, 1998; Hsieh et al, 1999; Fuchs et al, 2001) map onto BTD at two distinct regions (Figure 6B). Mutations that affect only the RAM domain interaction of NotchIC with CSL cluster near the nonpolar pocket (Figure 6B, purple residues). Mutations that impair SMRT/N-Cor or CIR corepressor interactions with CSL, often also resulting in impaired interactions with NotchIC, map to a second region in a zone adjacent to the nonpolar pocket and to a more distal loop region of CSL (Figure 6B, gold residues). We suggest that the primary interaction of NotchIC with CSL likely involves an interaction of the Notch ΦWΦP motif with the conserved hydrophobic pocket on BTD (Figure 6C)
DNA interactions
Portions of NTD, BTD, and their interdomain linker produce an extensive electropositive and highly conserved surface through which CSL interacts with DNA (Figure 5A and C). This protein–DNA interface buries 20 857 Å2 of surface. DNA-contacting residues in CSL are clustered primarily in the recognition loop, between strands βA and βB of NTD; in the interdomain linker between strands βG′ and βA1; and the loop in BTD between strands βA1 and βA2. These regions of DNA interaction, in particular the linker region, are consistent with mutagenesis data that correlated sites sensitive to amino-acid changes with DNA binding (Chung et al, 1994). All base-specific CSL interactions with DNA in the crystal (Figures 2 and 7A) are made to the core sequence 5′-T(5)GTGGGAA(12)-3′, which is virtually the same as the core site established by random oligonucleotide selection and amplification, 5′-CGTGGGAA-3′ (Tun et al, 1994). Contacts to the phosphate–ribose backbone extend beyond this core (Figure 7A).
Figure 7.
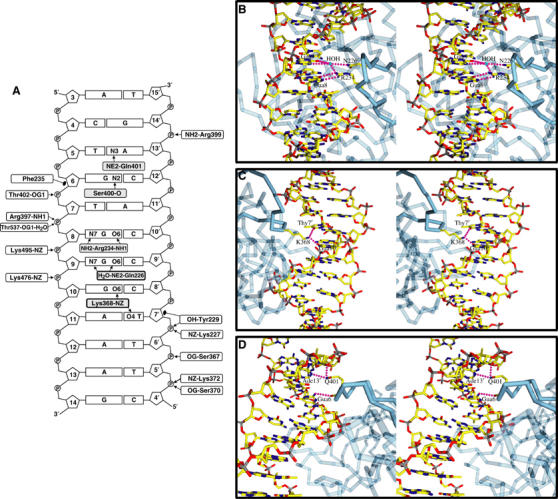
CSL–DNA interactions. (B–D) were created with Molscript and Povscript (Kraulis, 1991; Fenn et al, 2003). (A) Schematic representation of all protein–DNA interactions in the CSL–DNA complex. Specific interactions with the DNA bases are shaded in gray and nonspecific interactions are clear boxes. Hydrogen-bonding or salt-bridge interactions are denoted as an arrow and Van der Waals interactions are depicted as closed circles. (B) Stereo view of the major-groove protein–DNA interactions of Arg234 and Asn26 from CSL with Gua8 and Gua9. The DNA is colored atom-specifically: C yellow, N blue, O red, and P gray. The protein is colored blue with interacting loops solid and other parts transparent. (C) Stereo view of the interaction of Lys368 with Gua10 and Thy7′. Coloring is as in (B). (D) Stereo view of the minor-groove interactions of the side chain of Gln401 with Ade13′ and the backbone carbonyl of Ser400 with Gua6. Coloring is as in (B).
The helix axes of DNA molecules are aligned along screw axes in the crystal, such that infinite pseudo-continuous helices form through head-to-tail associations at the oligonucleotide TT/AA overhangs. This accommodates two pieces of DNA (30 bp) stacked head-to-tail within the 97.6 Å cell edge. The DNA conformation in the complex is B-form and necessarily straight overall, but there are two slight bends of the DNA helical axis due to the interaction with CSL. These bends, centered at base pairs Ade11–Thy7′ and Thy7–Ade11′, compensate so as to preserve overall straightness. These deformations generate base-pair inclines of up to 7.5° with respect to the local helical axis at the CSL binding site and serve to widen the major groove and also, to a lesser extent, the minor groove as well. In addition, there are perturbations of the nucleotide base steps between Gua8–Cyt10′ and Gua10–Cyt8′ that produce undertwisting of the DNA helix with significant buckling and positive propeller twist in this region that locally distort the B-form nature of this region.
The protein–DNA interface has many conserved CSL residues all involved in well-defined contacts within an 11 bp span of the DNA (Figure 7A). Most of these contacts are made to the phosphate–ribose backbones of one or the other strand, and these interactions are such as to position other protein groups for base interactions that specify the core CSL recognition sequence. The sequence-specific interactions made by these absolutely conserved groups are such as to explain the preponderance of observed CSL site conservation (see Supplemental Materials). Arg234 and Gln226 from NTD interact respectively with Gua8 in a G-specific manner and with Gua9 in a purine-specific manner (Figure 7B). Lys368 from the NTD–BTD linker segment makes an intricate diagonal interaction that bridges Gua10 in a G–C base pair with Thy7′ in the subsequent A–T base pair in a manner consistent only with this sequence (Figure 7C). Gln401 from BTD interacts in the minor groove with Ade13′ and with Gua14′, in a manner consistent only with pyrimidine at position 5, and backbone carbonyl 400 makes a G-specific interaction with the N2 amide of Gua6 (Figure 7D). Only the observed specificities for Thy7 and Ade12 are unsupported by direct base interactions with the protein, and we surmise that DNA conformational features in the complex require these base sequences (see Discussion).
Discussion
Integrity and universality of CSL structure
Our crystal structure of the conserved core of CSL bound to DNA shows that CSL is modular, comprising three distinct domains, but its domains are associated such that CSL has structural integrity as a whole. The fold of CSL proteins is clearly related to that of the two-domain Rel family of DNA-binding transcription factors, despite remote if even detectable sequence similarity, but this arises in an unanticipated manner that differs greatly from previously suggested domain boundaries and arrangements (Figure 2). Furthermore, its topology is unique due to the insertion of a beta-trefoil-like domain in between Rel-like NTD and CTD domains. This insertion is organized such that strand βC4, which originates in BTD and continues back through NTD and on into CTD, is part of β-sheet structures in all three domains (Figure 2). Moreover, the structure is tied together by association of the very N-terminal helices with CTD rather than NTD. Structurally, NTD is the central domain. Interdomain interactions are very extensive as judged by buried interfacial surfaces and well defined as judged by atomic mobility (Figure 5E). Consequently, we do not expect any dramatic interdomain conformational changes as a consequence of binding to DNA or transcriptional cofactors, although changes in loop conformation or mobility might well occur.
We further expect that the structure of the CSL–DNA complex seen here for the core of C. elegans Lag-1 with a site from the promoter for mouse HES-1 will also apply universally to CSL in all organisms. First, core CSL is extraordinarily conserved (Figure 5C and D); there is, for example, 50% sequence identity across all five species in Figure 1A, and in particular the surface of CSL that interacts with DNA is absolutely conserved. Similarly, known CSL binding sites all conform tightly to the core sequence 5′-PyGTGGGAA-3′, and the structure explains nearly all of this specificity. Moreover, the interface between these two conserved surfaces is exceptionally large. Finally, there is ample evidence for heterologous CSL interactions, including our own experiment (Figure 6A) showing that NotchIC RAM peptide from C. elegans (Lin-12) interacts with mouse CSL (RBP-Jκ) as it does with C. elegans CSL (Lag-1).
Centrality of the beta-trefoil domain in the Notch signaling switch
The BTD of CSL has two functional roles: first, it contributes to specific and nonspecific DNA binding and, second, it is the site of mutually exclusive interactions with NotchIC (and the viral protein EBNA2) and corepressors (SMRT/N-Cor and CIR) whereby Notch signaling effects the switch from repression to activation. Unlike other beta-trefoils, the BTD of CSL is missing two of the prototypical 12 strands. This results in a distinct hydrophobic pocket in a large, conserved and nonpolar surface (Figures 5B, D and 6C). It may also be responsible for an apparent destabilization of this domain, in the absence of any other protein factors, as evidenced by elevated atomic mobility in the BTD as compared to NTD and CTD domains (Figure 5E). The location and chemical environment of the BTD pocket make it an attractive site for interaction with a hydrophobic ligand.
Taking into account where prior mutational data map onto the structure (Figure 6B), the hydrophobic character of this region (Figure 5B), and the results of our peptide binding experiment (Figure 6A), we conclude that the BTD pocket is likely to be the binding site for the Notch RAM domain. Specifically, we believe that the conserved ΦWΦP tetrapeptide motif (VWMP in Lin-12) of Notch receptors and EBNA2 (Figure 1B) is of the appropriate size and hydrophobicity to insert into the nonpolar pocket of BTD functionally anchoring NotchIC to DNA through CSL.
Other mutations that disrupt the NotchIC–CSL interaction map onto BTD outside the nonpolar pocket. We believe that these regions represent other functionally important areas for NotchIC–CSL binding, possibly involving the RAM domain and/or the ankyrin repeats. Strikingly, mutations that disrupt corepressor interactions with CSL map to BTD surfaces that overlap only partially with those affecting the NotchIC interaction (Figure 6B). SMRT/N-Cor and CIR do not appear to bind at the site of the nonpolar pocket. This is consistent with the lack of identifiable sequences in SMRT or CIR akin to the ΦWΦP motif of RAM domains.
The speculative picture that then emerges for Notch signaling begins with binding of the conserved ΦWΦP motif of NotchIC into the hydrophobic pocket of BTD. Displacement of corepressors from CSL ensues. This may happen because other parts of the RAM domain compete successfully with corepressors for common binding surfaces outside the hydrophobic pocket or, alternatively, because the RAM domain induces a conformational change in BTD that renders CSL incompetent for corepressor interaction. With the RAM domain tethered to BTD, the ankyrin repeats of NotchIC may make additional interactions, perhaps with CTD. These ankyrin repeats are then able to recruit HAT activation factors and Mastermind to complete the switch from CSL repression to CSL activation.
Functional role of the C-terminal domain
While the NTD of CSL functions in a manner similar to Rel RHR-N domains, that is, making major-groove contacts with DNA that contribute to DNA specificity, the CTD of CSL is not functionally analogous to Rel RHR-C domains; it does not promote dimerization and it does not make DNA contacts. Nevertheless, prior experiments implicate CTD as a region necessary for DNA binding (Chung et al, 1994; Roehl et al, 1996; Nam et al, 2003). We speculate that perhaps the contribution of the CTD of CSL to DNA binding is indirect through stabilization of the tertiary fold. This notion is supported by the importance of CTD to the structural integrity of CSL (see above), notably helix α1 and part of strand βC4.
In the absence of other known functions for CTD, it is interesting to note the reduced sequence conservation in this domain relative to NTD and BTD (Figures 1A, 5C and D). There is at least one example of the requirement for CTD to promote transcription in vivo; however, this activity is in the absence of NotchIC (Tang and Kadesch, 2001). In addition, a weak interaction between a region in CSL that corresponds to the CTD and the ankyrin repeats of Notch has been reported (Tani et al, 2001).
Structural basis for CSL site specificity
The interaction of CSL with DNA involves a number of strictly conserved protein residues that contribute specific and nonspecific DNA contacts (Figures 1A and 7A). Binding results in significant local DNA perturbations, but the DNA duplex maintains an overall straight B-form character. CSL specifically recognizes its cognate DNA site through a combination of major- and minor-groove contacts that achieves tight binding coupled with specificity. Major-groove DNA contacts are contributed by the NTD of CSL through residues Arg234, Lys368, and Gln226, which combine to specify the sequence 5′-G(8)GGA-3′ in the second half of the DNA-binding site. These contacts share a number of similarities with contacts made by the Rel proteins with DNA. In a singular manner, BTD makes specific minor-groove contacts through Gln401 and the backbone carbonyl of Ser400, which select for a pyrimidine–purine base pair at position 5–13′ in the DNA sequence and a guanine at position 6. Nonspecific contacts with the phosphate–ribose backbone extend the interactions over 11 bp.
The protein–DNA interactions seen in the crystal structure provide a molecular understanding of prior observations on specificity, but there are no direct interactions from CSL to explain the specificity observed at base pairs Thy7–Ade11′ and Ade12–Thy6′ (Tun et al, 1994). We posit that the requirement for these particular bases comes from their impact on architectural features of the DNA that are necessary for CSL binding, rather than direct read-out of these DNA bases by the CSL protein. This is best seen at positions 11–13 where there is a gradient of preference from Ade11–Ade13 for an adenine base such that the strongest predilection for adenine is at position 11 (∼94%), then position 12 (∼90%), and finally position 13 (∼43%) (Tun et al, 1994). The selectivity for Ade at position 11 was discussed above. The question is why there is a preference for adenine bases at positions 12 and 13. We suggest that the answer may lie with the tendency of A:T tracts to adopt conformations that have high degrees of propeller twist (Nelson et al, 1987; el Hassan and Calladine, 1996) caused by cross-stranded hydrogen bonds between consecutive base steps (Nelson et al, 1987). Indeed, the A:T tract between Ade11 and Ade13 has the highest degree of propeller twist in the CSL–DNA complex, and it is this twist that points the O4 carbonyl atom of Thy7′ toward the NZ nitrogen of Lys368. Thus, we believe the purpose of the A:T tract structure in the CSL–DNA complex, and the gradient of preference for A:T base pairs at positions 12 and 13, is to stabilize the propeller twist at Ade11 in order to optimize the bifurcated interaction made by Lys368.
We suspect that a similar DNA architectural feature explains the preference for a Thy–Ade base pair at positions 7–11′ in the binding site as there are no nearby protein contacts. This Thy–Ade base pair does display significant amounts of buckle and other perturbations. In particular, the base step from Thy7 to Gua8 is the site of a unique transition in the duplex from negative to positive propeller twist; however, the connection to specificity at this position in the DNA is unclear.
Materials and methods
Cloning, expression, and purification
The portion of the C. elegans lag-1 gene that corresponds to amino-acid residues 192–663 was cloned into the GST fusion vector pGEX-6P-1 (Pharmacia) using the BamHI and XhoI restriction sites. The expression vector was transformed into Rosetta(DE3)pLysS (Novagen) E. coli and bacteria were grown in LB media at 37°C until a cell density of 1.5 OD600 was reached. The cultures were then induced with 0.5 mM IPTG, grown overnight at 20°C, harvested by centrifugation the following day and cell pellets frozen. Frozen bacterial pellets were resuspended in PBS buffer containing 0.1% Triton X-100 and protease inhibitors (Roche), and lysed by sonication. The resulting lysate was clarified by centrifugation (15 000 rpm) and filtration (Millipore 0.22 μM), and then loaded onto a glutathione sepharose 4B (Pharmacia) column pre-equilibrated with PBS buffer containing 0.1% Triton X-100. The column was washed with 10–20 volumes of the PBS–Triton buffer followed by 10–20 volumes of PBS with no additives. The GST-Lag-1 fusion protein was eluted from the column using a glutathione buffer containing 20 mM reduced glutathione; the eluant was concentrated to 1–3 ml and digested overnight with PreScission Protease (Pharmacia) as per the vendor's protocol. The GST moiety was removed from the protein solution by an additional glutathione column purification step. Lag-1 was further purified by cation exchange chromatography (HiTrap SP Pharmacia) followed by gel filtration (Superdex S75 Pharmacia), and then concentrated to 10 mg/ml in a buffer containing 20 mM Tris pH 8.0, 0.5 M NaCl, 10% ethylene glycol, and 1 mM DTT. The typical yield was 1–2 mg of purified protein per liter of bacterial culture. SeMet protein was produced in E. coli using a non-auxotrophic protocol and purified in a manner similar to the native protein (Doublie, 1997).
Crystallization
Lag-1–DNA complexes were pre-formed prior to crystallization by mixing purified protein in a 1:1.2 (protein:DNA) ratio. An oligomeric 15-mer of duplex DNA containing the sequence, coding strand 5′-TTACTGTGGGAAAGA-3′ and template strand 5′-AATCTTTCCCACAGT-3′, was used for crystallization. Conditions for crystallization were initially screened using the Natrix kit from Hampton. The final crystallization condition consists of 1 μl of protein–DNA solution mixed with 1 μl of well solution (50 mM MES pH 5.6, 0.2 M (NH4)2SO4, 13% PEG 20K, 5% ethylene glycol) equilibrated over 500 μl of well solution and grown at 4°C with microseeding. Native and SeMet crystals grew under similar conditions. The crystals belong to the hexagonal space group P61 with unit cell dimensions a=b=127.55 Å, c=97.60 Å. The structure proves to have one CSL–DNA complex per asymmetric unit and a solvent content of 65%.
Data collection and structural determination
A three-wavelength MAD experiment was collected on a SeMet crystal at the NSLS beamline X4A. In addition, a SAD experiment of a SeMet crystal soaked in 1 mM YbCl3 was also collected in which the monochromator was set to the SeMet-peak wavelength. Additional higher resolution data were collected at the APS beamline 31-ID of SGX-CAT (Table I). All data were integrated and scaled with the DENZO, XDISPLAYF, and SCALEPACK suite of programs (Otwinowski and Minor, 1997). The six SeMet sites were located by automated Patterson searches using the X4A data, and initial phases were calculated and subsequently solvent flattened with SOLVE (Terwilliger and Berendzen, 1999). Resulting maps at 3.3 Å resolution revealed interpretable regions of secondary structure. The higher resolution native and SeMet data were combined with the X4A SAD data and refined with SHARP (delaFortelle and Bricogne, 1997). A single Yb site was located by calculating anomalous residual maps using the phases from the SeMet data. Experimental phases calculated to 2.85 Å resolution for the native data from the combined SeMet MAD and SeMet-Yb SAD data, and refined by solvent flattening, resulted in a fully interpretable electron-density map.
Table 1.
Diffraction data and structure refinement
| Native | SeMet—peak | SeMet—edge | SeMet—remote | Yb-SeMet | |
|---|---|---|---|---|---|
| Beamline | 31-ID | 31-ID | 31-ID | 31-ID | X4A |
| Wavelength (Å) | 0.9791 | 0.9793 | 0.9795 | 0.9686 | 0.9792 |
| Bragg Spacings (Å) | 20.0–2.8 | 20.0–2.9 | 20.0–2.9 | 20.0–2.9 | 20.0–3.0 |
| Completeness (%)a | 99.7 (100) | 99.7 (100) | 99.7 (100) | 99.8 (100) | 95.6 (97.2) |
| Redundancy | 7.5 | 12.6 | 12.6 | 12.7 | 7.6 |
| Rsyma | 4.6 (31.3) | 5.4 (40.5) | 4.8 (49.4) | 5.2 (48.5) | 8.1 (52.7) |
| Phasing power | NA | 1.84 | 0.72 | 1.4 | 1.18 |
| Rcullis | NA | 0.62 | 0.892 | 0.733 | 0.778 |
| FOMacena | 0.465 (0.091) | ||||
| FOMcena | 0.367 (0.025) | ||||
| Resolution (Å) | 20.0–2.85 | ||||
| Reflections | 21 051 | ||||
| Completeness | 99.6% | ||||
| Rfree | 27.34% | ||||
| Rfac | 20.32% | ||||
| R.m.s.d. bonds | 0.0105 | ||||
| R.m.s.d. angles | 1.55 | ||||
|
B r.m.s.d. bonds (Å2) |
Main chain 5.49 |
Side chain 8.32 |
|
|
|
| NA: not applicable. | |||||
| aNumbers in parentheses represent statistics for the highest resolution shell of data. | |||||
Model building and refinement
Approximately 83% of the main chain was traced by ARP/WARP (Perrakis et al, 1999), and side-chain placement and additional manual model building were carried out within the program O (Jones and Kjeldgaard, 1997). The program CNS was used for all crystallographic refinement (Brunger et al, 1998). The starting model was refined initially against phase-probability weighted structure factors using data to 3.0 Å, and additional rounds of refinement against just native amplitudes followed. The resolution was extended to 2.85 Å in later cycles of refinement and included restrained B-factor refinement. The final refined model consists of amino-acid residues 195–262, 280–304, 319–660, a 15-mer of DNA, 46 waters, and nine ethylene glycol molecules. The model has 79.8, 18.1, and 2.1% of the phi–psi angles within the respective most favored, additionally allowed, and generously allowed regions of the Ramachandran diagram; none are in ‘disallowed' regions. Quality assessment for CSL was performed with PROCHECK (Laskowski et al, 1993). Analysis of the DNA was carried out with 3DNA (Lu and Olson, 2003).
Structural overlays
The individual domains of CSL (NTD, BTD, CTD) were submitted to the Dali server for comparison to known protein folds (Holm and Sander, 1993). For the CSL NTD comparison with the RHR-N domain of NFAT, 97 Cα atoms were overlaid with a sequence identity of 14% and an r.m.s.d. of 2.7 Å; for the BTD comparison with interleukin-1α, 100 Cα atoms were superimposed with a sequence identity of 11% and an r.m.s.d. of 2.2 Å; for the CTD of CSL with the RHR-C domain of p65, 78 Cα atoms were overlaid with a sequence identity of 15% and an r.m.s.d. of 2.1 Å.
Gel shift
CSL BTDs from Lag-1 (aa 375–575) and RBP-Jκ (aa 203–393) were purified from GST fusions in a manner similar to the protocols used for the full-length Lag-1 protein as previously described. A peptide corresponding to the Lin-12 RAM domain residues 938–950 (RMINASVWMPPME) and a control peptide having the reversed sequence (EMPPMWVSANIMR) were chemically synthesized. For the gel-shift analysis, BTDs were at ∼1 mg/ml (45 μM) concentration and the RAM and the control peptides were at 2.0 mM. A 1 μl volume of either RAM peptide, control peptide, or both was added to 4 μl of CSL BTD in a buffer consisting of 20 mM Tris pH 8.0, 150 mM NaCl, 1 mM EDTA, 1 mM DTT, and 0.1% Triton X-100, and then incubated for 5 min at 37°C. An 8–25% gradient native gel (Pharmacia) was used to resolve the peptide-bound and free forms of the isolated BTDs.
Accession codes
Atomic coordinates have been deposited in the Protein Data Bank with the accession code 1TTU.
Supplementary Material
Supplemental Materials
Acknowledgments
We thank members of the Hendrickson laboratory for useful discussions, and Chris Min in particular for critique of the manuscript and assistance with data collection. We are particularly grateful for discussions about CSL and Notch signaling with Iva Greenwald and Sophie Jarriault, and for their critical review of the manuscript. We also thank Randy Abramowitz, Xiaochun Yang, and KR Rajashankar for synchrotron help and Iva Greenwald, Jan Kitajewski, and Diane Hayward for constructs. This work was supported in part by a Leukemia & Lymphoma Society Fellowship to RAK and by NIH grant GM34102. Beamline X4A at the National Synchrotron Light Source (NSLS) was supported by the Howard Hughes Medical Institute and beamline 31-ID at the Advanced Photon Source (APS) is supported by Structural GenomiX Inc. NSLS and APS are Department of Energy facilities.
References
- Artavanis-Tsakonas S, Rand MD, Lake RJ (1999) Notch signaling: cell fate control and signal integration in development. Science 284: 770–776 [DOI] [PubMed] [Google Scholar]
- Brunger AT, Adams PD, Clore GM, DeLano WL, Gros P, Grosse-Kunstleve RW, Jiang JS, Kuszewski J, Nilges M, Pannu NS, Read RJ, Rice LM, Simonson T, Warren GL (1998) Crystallography & NMR system: a new software suite for macromolecular structure determination. Acta Crystallogr D 54: 905–921 [DOI] [PubMed] [Google Scholar]
- Chen L, Glover JN, Hogan PG, Rao A, Harrison SC (1998) Structure of the DNA-binding domains from NFAT, Fos and Jun bound specifically to DNA. Nature 392: 42–48 [DOI] [PubMed] [Google Scholar]
- Christopher JA (1998) SPOCK: The Structural Properties Observation and Calculation Kit (Program Manual), College Station, TX [Google Scholar]
- Chung CN, Hamaguchi Y, Honjo T, Kawaichi M (1994) Site-directed mutagenesis study on DNA binding regions of the mouse homologue of Suppressor of Hairless, RBP-J kappa. Nucleic Acids Res 22: 2938–2944 [DOI] [PMC free article] [PubMed] [Google Scholar]
- delaFortelle E, Bricogne G (1997) Maximum-likelihood heavy-atom parameter refinement for multiple isomorphous replacement and multiwavelength anomalous diffraction methods. Methods Enzymol 276: 472–494 [DOI] [PubMed] [Google Scholar]
- Doublie S (1997) Preparation of selenomethionyl proteins for phase determination. Methods Enzymol 276: 523–530 [PubMed] [Google Scholar]
- el Hassan MA, Calladine CR (1996) Propeller-twisting of base-pairs and the conformational mobility of dinucleotide steps in DNA. J Mol Biol 259: 95–103 [DOI] [PubMed] [Google Scholar]
- Esnouf RM (1997) An extensively modified version of MolScript that includes greatly enhanced coloring capabilities. J Mol Graph Model 15: 132–134 [DOI] [PubMed] [Google Scholar]
- Fenn TD, Ringe D, Petsko GA (2003) POVScript+: a program for model and data visualization using persistence of vision ray-tracing. J Appl Crystallogr 36: 944–947 [Google Scholar]
- Fuchs KP, Bommer G, Dumont E, Christoph B, Vidal M, Kremmer E, Kempkes B (2001) Mutational analysis of the J recombination signal sequence binding protein (RBP-J)/Epstein–Barr virus nuclear antigen 2 (EBNA2) and RBP-J/Notch interaction. Eur J Biochem 268: 4639–4646 [DOI] [PubMed] [Google Scholar]
- Ghosh G, van Duyne G, Ghosh S, Sigler PB (1995) Structure of NF-kappa B p50 homodimer bound to a kappa B site. Nature 373: 303–310 [DOI] [PubMed] [Google Scholar]
- Gouet P, Courcelle E, Stuart DI, Metoz F (1999) ESPript: analysis of multiple sequence alignments in PostScript. Bioinformatics 15: 305–308 [DOI] [PubMed] [Google Scholar]
- Graves BJ, Hatada MH, Hendrickson WA, Miller JK, Madison VS, Satow Y (1990) Structure of interleukin 1 alpha at 2.7-Å resolution. Biochemistry 29: 2679–2684 [DOI] [PubMed] [Google Scholar]
- Greenwald I (1998) LIN-12/Notch signaling: lessons from worms and flies. Genes Dev 12: 1751–1762 [DOI] [PubMed] [Google Scholar]
- Gridley T (2003) Notch signaling and inherited disease syndromes. Hum Mol Genet 12 (Spec no. 1): R9–R13 [DOI] [PubMed] [Google Scholar]
- Henkel T, Ling PD, Hayward SD, Peterson MG (1994) Mediation of Epstein–Barr virus EBNA2 transactivation by recombination signal-binding protein J kappa. Science 265: 92–95 [DOI] [PubMed] [Google Scholar]
- Holm L, Sander C (1993) Protein structure comparison by alignment of distance matrices. J Mol Biol 233: 123–138 [DOI] [PubMed] [Google Scholar]
- Hsieh JJ, Hayward SD (1995) Masking of the CBF1/RBPJ kappa transcriptional repression domain by Epstein–Barr virus EBNA2. Science 268: 560–563 [DOI] [PubMed] [Google Scholar]
- Hsieh JJ, Zhou S, Chen L, Young DB, Hayward SD (1999) CIR, a corepressor linking the DNA binding factor CBF1 to the histone deacetylase complex. Proc Natl Acad Sci USA 96: 23–28 [DOI] [PMC free article] [PubMed] [Google Scholar]
- Jones TA, Kjeldgaard M (1997) Electron-density map interpretation. Methods Enzymol 277: 173–208 [DOI] [PubMed] [Google Scholar]
- Kabsch W, Sander C (1983) Dictionary of protein secondary structure: pattern recognition of hydrogen-bonded and geometrical features. Biopolymers 22: 2577–2637 [DOI] [PubMed] [Google Scholar]
- Kao HY, Ordentlich P, Koyano-Nakagawa N, Tang Z, Downes M, Kintner CR, Evans RM, Kadesch T (1998) A histone deacetylase corepressor complex regulates the Notch signal transduction pathway. Genes Dev 12: 2269–2277 [DOI] [PMC free article] [PubMed] [Google Scholar]
- Kraulis PJ (1991) Molscript—a program to produce both detailed and schematic plots of protein structures. J Appl Crystallogr 24: 946–950 [Google Scholar]
- Laskowski RA, Macarthur MW, Moss DS, Thornton JM (1993) Procheck—a program to check the stereochemical quality of protein structures. J Appl Crystallogr 26: 283–291 [Google Scholar]
- Ling PD, Hayward SD (1995) Contribution of conserved amino acids in mediating the interaction between EBNA2 and CBF1/RBPJk. J Virol 69: 1944–1950 [DOI] [PMC free article] [PubMed] [Google Scholar]
- Ling PD, Rawlins DR, Hayward SD (1993) The Epstein–Barr virus immortalizing protein EBNA-2 is targeted to DNA by a cellular enhancer-binding protein. Proc Natl Acad Sci USA 90: 9237–9241 [DOI] [PMC free article] [PubMed] [Google Scholar]
- Lu XJ, Olson WK (2003) 3DNA: a software package for the analysis, rebuilding and visualization of three-dimensional nucleic acid structures. Nucleic Acids Res 31: 5108–5121 [DOI] [PMC free article] [PubMed] [Google Scholar]
- Maillard I, Pear WS (2003) Notch and cancer: best to avoid the ups and downs. Cancer Cell 3: 203–205 [DOI] [PubMed] [Google Scholar]
- Muller CW, Rey FA, Sodeoka M, Verdine GL, Harrison SC (1995) Structure of the NF-kappa B p50 homodimer bound to DNA. Nature 373: 311–317 [DOI] [PubMed] [Google Scholar]
- Mumm JS, Kopan R (2000) Notch signaling: from the outside in. Dev Biol 228: 151–165 [DOI] [PubMed] [Google Scholar]
- Murzin AG, Lesk AM, Chothia C (1992) beta-Trefoil fold. Patterns of structure and sequence in the Kunitz inhibitors interleukins-1 beta and 1 alpha and fibroblast growth factors. J Mol Biol 223: 531–543 [DOI] [PubMed] [Google Scholar]
- Nam Y, Weng AP, Aster JC, Blacklow SC (2003) Structural requirements for assembly of the CSL.intracellular Notch1.Mastermind-like 1 transcriptional activation complex. J Biol Chem 278: 21232–21239 [DOI] [PubMed] [Google Scholar]
- Nellesen DT, Lai EC, Posakony JW (1999) Discrete enhancer elements mediate selective responsiveness of enhancer of split complex genes to common transcriptional activators. Dev Biol 213: 33–53 [DOI] [PubMed] [Google Scholar]
- Nelson HC, Finch JT, Luisi BF, Klug A (1987) The structure of an oligo(dA).oligo(dT) tract and its biological implications. Nature 330: 221–226 [DOI] [PubMed] [Google Scholar]
- Nicholls A, Bharadwaj R, Honig B (1993) Grasp—graphical representation and analysis of surface-properties. Biophys J 64: A166–A166 [Google Scholar]
- Otwinowski Z, Minor W (1997) Processing of X-ray diffraction data collected in oscillation mode. Methods Enzymol 276: 307–326 [DOI] [PubMed] [Google Scholar]
- Perrakis A, Morris R, Lamzin VS (1999) Automated protein model building combined with iterative structure refinement. Nat Struct Biol 6: 458–463 [DOI] [PubMed] [Google Scholar]
- Roehl H, Bosenberg M, Blelloch R, Kimble J (1996) Roles of the RAM and ANK domains in signaling by the C. elegans GLP-1 receptor. EMBO J 15: 7002–7012 [PMC free article] [PubMed] [Google Scholar]
- Sakai T, Taniguchi Y, Tamura K, Minoguchi S, Fukuhara T, Strobl LJ, Zimber-Strobl U, Bornkamm GW, Honjo T (1998) Functional replacement of the intracellular region of the Notch1 receptor by Epstein–Barr virus nuclear antigen 2. J Virol 72: 6034–6039 [DOI] [PMC free article] [PubMed] [Google Scholar]
- Tamura K, Taniguchi Y, Minoguchi S, Sakai T, Tun T, Furukawa T, Honjo T (1995) Physical interaction between a novel domain of the receptor Notch and the transcription factor RBP-J kappa/Su(H). Curr Biol 5: 1416–1423 [DOI] [PubMed] [Google Scholar]
- Tang Z, Kadesch T (2001) Identification of a novel activation domain in the Notch-responsive transcription factor CSL. Nucleic Acids Res 29: 2284–2291 [DOI] [PMC free article] [PubMed] [Google Scholar]
- Tani S, Kurooka H, Aoki T, Hashimoto N, Honjo T (2001) The N- and C-terminal regions of RBP-J interact with the ankyrin repeats of Notch1 RAMIC to activate transcription. Nucleic Acids Res 29: 1373–1380 [DOI] [PMC free article] [PubMed] [Google Scholar]
- Terwilliger TC, Berendzen J (1999) Automated MAD and MIR structure solution. Acta Crystallogr D 55: 849–861 [DOI] [PMC free article] [PubMed] [Google Scholar]
- Thompson JD, Higgins DG, Gibson TJ (1994) CLUSTAL W: improving the sensitivity of progressive multiple sequence alignment through sequence weighting, position-specific gap penalties and weight matrix choice. Nucleic Acids Res 22: 4673–4680 [DOI] [PMC free article] [PubMed] [Google Scholar]
- Tun T, Hamaguchi Y, Matsunami N, Furukawa T, Honjo T, Kawaichi M (1994) Recognition sequence of a highly conserved DNA binding protein RBP-J kappa. Nucleic Acids Res 22: 965–971 [DOI] [PMC free article] [PubMed] [Google Scholar]
- Zhou S, Fujimuro M, Hsieh JJ, Chen L, Miyamoto A, Weinmaster G, Hayward SD (2000) SKIP, a CBF1-associated protein, interacts with the ankyrin repeat domain of NotchIC to facilitate NotchIC function. Mol Cell Biol 20: 2400–2410 [DOI] [PMC free article] [PubMed] [Google Scholar]
Associated Data
This section collects any data citations, data availability statements, or supplementary materials included in this article.
Supplementary Materials
Supplemental Materials