

Abstract
In neural development, bone morphogenetic proteins (BMPs) restrict neuronal differentiation, thereby promoting the maintenance of progenitor cells or even inducing astrocytogenesis. We report that exposure of neuroendocrine lung carcinoma cells to BMP-2 leads to a rapid decline in steady-state levels of Mash1 protein and some neuron-specific markers. BMP-2 induces a post-transcriptional decrease in Mash1 levels through enhanced degradation. We demonstrate that Mash1 protein stability is tightly regulated by the E47/Id1 expression ratio. Transient induction of Id1 by BMP-2 negatively correlates with Mash1 levels. Furthermore, an ectopic increase in Id1 levels is sufficient to induce degradation of either ectopic or endogenous Mash1, whereas expression of Mash1 in Id1-deficient cells or overexpression of E47 makes Mash1 levels refractory to the addition of BMP-2. Furthermore, we show that the E47/Id1 expression ratio also regulates CK2-mediated phosphorylation of Mash1 on Ser152, which increases interaction of Mash1–E47 heterodimers. We propose a novel mechanism in which the balance between Id and E protein levels regulates not only the transcriptional function but also protein stability of the neurogenic bHLH transcription factor Mash1.
Keywords: BMP, cell differentiation, helix–loop–helix transcription factors, Id1, Mash1
Introduction
During differentiation, progenitor cells develop into more specialized phenotypes by highly specific changes in gene expression. The developmental maturation of precursor cells can be divided into at least two stages: the commitment of undifferentiated cells to a particular lineage, followed by terminal differentiation into a specific phenotype. Generally, the determination of cell fate depends on the activity of transcription factors. One of the best-known regulators of cell differentiation is the family of basic helix–loop–helix (bHLH) transcription factors. Most members of this family play a central role in the development of distinct mammalian cell lineages, including muscle and nerve cells. There is strong evidence that sequential expression of bHLH factors represents regulatory cascades in which early expressed factors modulate the appearance of others that are expressed later. For example, two members of the bHLH family, MyoD and myf-5, execute myogenic lineage determination, while myogenin and MRF4 appear to regulate the differentiation program (Rawls and Olson, 1997). Similarly, the bHLH factors Mash1, Math and neurogenin control neurogenesis in the central (CNS) and peripheral (PNS) nervous systems (Lee, 1997; Cai et al, 2000).
Mash1 is expressed in proliferating neural precursors in restricted regions of the CNS and PNS, olfactory epithelium and neuroendocrine cells (Lo et al, 1991; Guillemot et al, 1993; Borges et al, 1997; Casarosa et al, 1999). Mice that are homozygous for targeted disruption of the Mash1 gene show fewer autonomic, enteric and olfactory neurons as well as neuroendocrine cells in the lung (Guillemot et al, 1993; Borges et al, 1997). A variety of neuroendocrine marker genes, such as Phox2a, tyrosine hydroxylase (TH) and dopamine β-hydroxylase (DBH), are directly or indirectly regulated by Mash1 (Lo et al, 1998, 1999). For instance, disrupting Mash1 function by antisense treatment of small cell lung carcinoma (SCLC) cells results in a strong decrease in neuroendocrine markers, whereas overexpression of this gene in transgenic mice induces the appearance of neuroendocrine tumors from pulmonary epithelium (Linnoila et al, 2000). Mash1 and all the members of the bHLH family heterodimerize with ubiquitously expressed bHLH E proteins, such as E2A gene products, E12 and E47, through their HLH domain. Heterodimers bind to DNA through their basic domain and activate the transcription of genes that have a CANNTG sequence (E box) in their promoter region (Lee, 1997). Only one subfamily of HLH factors, known as Id proteins, lacks this basic region. Heterodimerization of Id proteins with bHLH is sufficient to block their DNA binding and function (Norton et al, 1998; Norton, 2000). Thus, Id family members are mainly known as negative regulators of the commitment and/or differentiation that the bHLH factors promote in muscle, lymphoid and neurogenic precursors (Sun, 1994; Spits et al, 2000; Kee et al, 2001). Four mammalian Id proteins, Id1 to Id4, that display partially overlapping expression patterns and certain levels of functional redundancy have been identified (Norton et al, 1998; Norton, 2000).
This network of expression and function of transcription factors and their antagonists is ultimately controlled by cell-intrinsic programs and by extracellular signaling factors. Although many studies have focused on positive signals, negative molecular signals are equally important in balancing both the timing of differentiation and cell specification (Ross et al, 2003). Bone morphogenetic proteins (BMPs) are good candidates for molecules that act as negative regulators of neurogenesis (reviewed in Mehler et al, 1997). BMPs belong to the TGF-β superfamily of cytokines (Derynck and Zhang, 2003; Shi and Massagué, 2003). Each ligand of this family exerts its biological function by inducing the formation of heteromeric complexes of specific type I and II serine/threonine kinase receptors, which in turn propagate the signal inside the cell through phosphorylation of the Smad family of transcription factors. Smads1, 5 and 8 are mainly involved in BMP signaling, whereas Smads 2 and 3 function in TGF-β/activin signaling. Following phosphorylation, receptor-specific Smads hetero-oligomerize with Smad4, the only co-Smad isolated from mammals to date, and translocate into the nucleus. The third subfamily includes Smads 6 and 7, which are named I-Smads because of their ability to inhibit receptor-mediated signaling. Upon entry to the nucleus, Smads usually form complexes that contain sequence-specific DNA-binding factors and transcriptional coactivators or corepressors in order to achieve stable binding and transcriptional regulation (ten Dijke et al, 2000; Shi and Massagué, 2003; Derynck and Zhang, 2003). Interestingly, BMP-2 and leukemia inhibitory factor (LIF) synergistically promote neuroepithelial cells to become astrocytes through interaction between Smad1 and STAT3 (Nakashima et al, 1999).
During embryonic neural induction, BMPs promote epidermal fate and suppress neural fate in the developing ectoderm (Wilson and Hemmati-Brivanlou, 1995). These cytokines promote glial differentiation in late embryonic or adult CNS precursors and simultaneously inhibit neurogenesis (Gross et al, 1996; Shou et al, 1999; Nakashima et al, 1999, 2001; Lim et al, 2000). However, BMPs also cause apoptosis in CNS precursor cells and induce neurogenesis in neural crest stem cells or cortical progenitors precursors (Shah et al, 1996). The mechanism by which BMPs mediate this wide variety of responses depending on the time of development is unclear. However, it may result from a diversity of signal transduction components that allow distinct cell populations to respond differentially to gradients of BMP concentration.
In addition, compared with this relatively strong phenomenological evidence, little is known about the molecular mechanisms that mediate the antineurogenic effects of BMPs. Therefore, we studied the molecular mechanisms involved in the antineurogenic function of BMPs in SCLC cells with a neuroendocrine phenotype. We show that BMP-2 decreases the expression of neuroendocrine markers and causes a post-transcriptional decrease in Mash1 protein levels. Our data indicate that induction of Id proteins by BMP-2 is necessary and sufficient to block stabilization of Mash1 by means of direct competition between Mash1 and Id1 for binding to ubiquitous E proteins. We propose a novel mechanism where the balance between Id and E protein levels regulates not only function but also protein stability of tissue-specific bHLH transcription factors.
Results
BMP-2 downregulates neuroendocrine markers in small cell lung carcinoma cells
To assess the effects of BMP-2 on the maintenance of the neuroendocrine phenotype, we first confirmed relatively high expression levels of several known neural markers in the SCLC cell line DMS53 (Borges et al, 1997). Addition of BMP-2 (5 nM) reduced the expression of TH and synaptophysin and did not affect other neural markers such as β-tubulin III or SNAP-25 (Figure 1A). Dose–response analysis of BMP-2 showed that TH protein levels were strongly decreased by BMP-2 stimulation at 5–10 nM. Similarly, to assess the temporal pattern of this response more accurately, we performed time-course assays indicating that both TH protein and mRNA reached minimal levels after 4–8 h and increased thereafter (Figure 1B). Interestingly, as previously described (Gómez-Santos et al, 2002), the related cytokine TGF-β had the opposite effects, and strongly increased TH expression. To further examine whether the regulation of TH by BMP-2 is mediated at the level of gene transcription, we transfected C17.2 cells with a reporter construct containing 4.3 kb of mouse TH promoter-enhancer region (Suzuki et al, 2002). Reporter activity was significantly reduced (up to 45% decrease with respect to control cells) in BMP-2-treated cells, indicating that the BMP-2 effects on TH protein levels were mainly due to a decreased transcriptional rate (Figure 1C).
Figure 1.
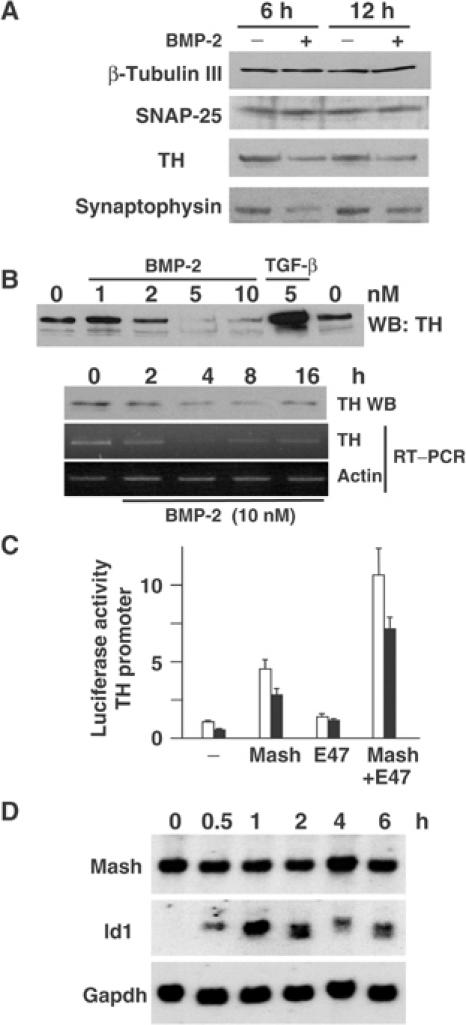
(A) DMS53 cells were treated with 5 nM BMP-2 for 6 or 12 h. Total extracts were obtained and analyzed by immunoblotting for the neural markers indicated. (B) DMS53 cells were treated for 4 h with the indicated amounts of BMP-2 or TGF-β (upper panel) or with 10 nM BMP-2 for the times indicated (lower panel). TH and actin expressions were analyzed by immunoblotting and/or semiquantitative RT–PCR. (C) C17.2 cells were cotransfected with a TH promoter-driven reporter construct and the combinations of Mash1 and/or E47 expression vectors indicated. Luciferase assay was performed after treatment for 16 h with 5 nM BMP-2 (filled bars) or no addition (empty bars). The results are expressed as mean±s.e.m. of triplicates from four independent transfections. (D) Northern blot analysis was performed with total RNA from DMS53 cells treated for the indicated times with 10 nM BMP-2 as described in Materials and methods.
SCLC exhibits a neuroendocrine phenotype in tight association with Mash1 and Phox2 expression (Borges et al, 1997; Lo et al, 1999; Ito et al, 2000; Brosenitsch and Katz, 2002). Thus, we explored the transcriptional regulation of TH transcription by the Mash1/E47 bHLH protein complex and their response to BMP-2 (Figure 1C). As expected, overexpression of Mash1 increased reporter responses, which were further augmented by coexpression of E47. Addition of 5 nM BMP-2 decreased transcriptional responses in both cases, indicating that BMP-2 interferes with the function of bHLH transcriptional complexes.
Post-transcriptional regulation of Mash1 expression by BMP-2
We analyzed modulation of endogenous levels of Mash1 mRNAs by BMP-2. We also analyzed the levels of Id1, a negative regulator of neurogenic bHLH transcription factors, which is induced by BMP-2 in several differentiation models (Nakashima et al, 2001; López-Rovira et al, 2002). BMP-2 induced a transient increase in Id1 mRNA levels. However, Mash1 mRNA levels showed no significant differences up to 6 h after BMP-2 addition (Figure 1D).
BMP-2 inhibits neurogenesis in olfactory epithelium cultures through enhanced proteolytic degradation of Mash1. These effects are very rapid (2 h) and require new transcription of an early induced gene by BMP (Shou et al, 1999). Immunoblot analysis showed a strong decrease in Mash1 protein levels (up to 60% decrease at 2 h) followed by a recovery after 6 h (Figure 2A). Dose–response assays also indicate that concentrations of BMP-2 higher than 5 nM were required to produce a significant decrease (Figure 2C). These profiles provide a temporal link that indicates that the decrease in Mash1 levels precede those of TH. Interestingly, immunoblot analysis of Id1 protein levels showed a marked negative correlation between Id1 and Mash1 protein levels (Figure 2A and B). To further confirm that the decrease in Mash1 protein levels arose from a post-transcriptional mechanism, we generated DMS53 cells stably overexpressing an epitope-tagged version of Mash1 under a heterologous CMV promoter. Transcription from the CMV promoter is not modulated by BMP-2 up to 6 h (data not shown). BMP-2 effects were analyzed in two independent clones. Similar to endogenous Mash1, ectopic Mash1 expression was downregulated 2 h after BMP-2 addition (Figure 2D).
Figure 2.
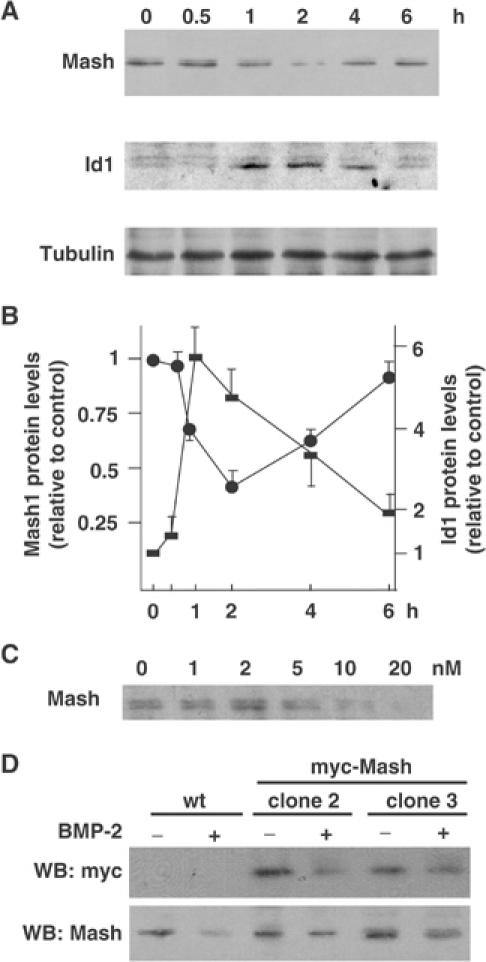
(A) Cell extracts were obtained from DMS53 cells treated with 5 nM BMP-2 for the times indicated and analyzed by immunoblotting. (B) Quantifications of Mash1 (filled circles) and Id1 (filled squares) protein levels from five separate assays were performed using α-tubulin as normalization and were expressed as fold-change over control samples at time zero and expressed as mean±s.e.m. (C) DMS53 cells were treated for 2 h with the indicated amounts of BMP-2 and Mash1 expression was analyzed by immunoblotting. (D) Parental and two independent myc-Mash1 overexpressing clones were treated for 2 h with 5 nM BMP-2 and expressions of ectopic Mash1 (upper panel) or endogenous Mash1 (lower panel) were analyzed by immunoblotting.
We then assayed N-Acetyl-Leu-Leu-Norleucinal (LLnL), which inhibits the activity of the 26S proteasome, for its ability to abolish BMP-induced Mash1 degradation. Addition of LLnL blocked the degradation of Mash1 after 2 h incubation with BMP-2 (Figure 3A). In order to confirm the ability of the ubiquitin system to target Mash1 for proteolytic degradation, HEK-293 cells were transfected with distinct combinations of myc-tagged Mash1 and His-tagged ubiquitin. Immunoblotting of Ni2+-NTA-purified complexes from cells cotransfected with these two constructs allowed us to detect higher molecular weight complexes containing ubiquitinated Mash1 (Figure 3B).
Figure 3.
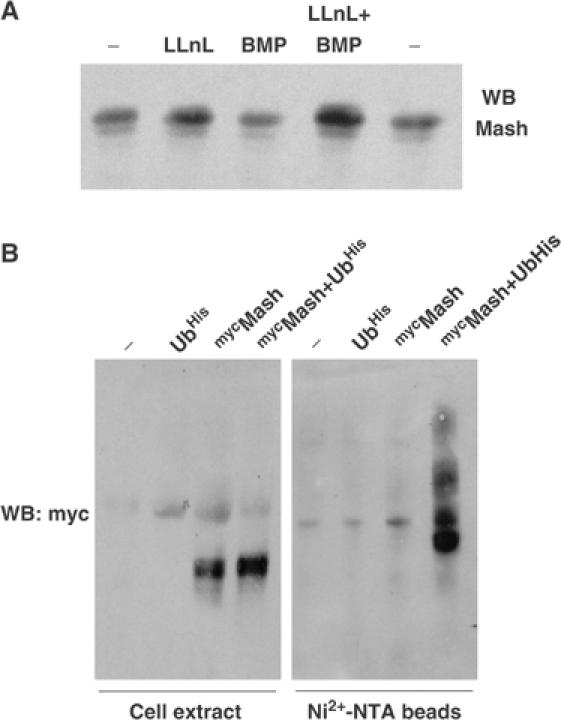
(A) DMS53 cells were treated with 50 μM LLnL and/or 5 nM BMP-2 for 2 h and expression of Mash1 was analyzed by immunoblotting. (B) Extracts from HEK-293 cells transfected with the indicated expression constructs and treated overnight with 50 μM LLnL were subjected to immunoblotting to detect myc-Mash1 expression before (left panel) or after Ni2+-NTA-agarose purification (right panel).
The ratio between Id1 and E47 levels modulates Mash1 protein stability
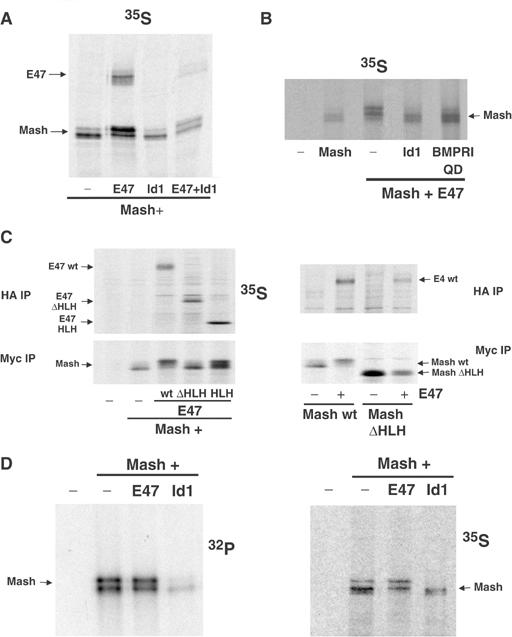
These previous data led us to hypothesize that, in addition to inhibiting Mash1/E47 transcriptional complexes and function, the induction of Id proteins is responsible for the BMP-2-increased degradation of Mash1. To test this, HEK-293 cells were transfected with distinct combinations of myc-tagged Mash1, E47 and Id1 expression vectors. As previously described (Bounpheng et al, 1999; Shou et al, 1999; Sriuranpong et al, 2002), Mash1 and Id1 levels were strongly enhanced by the addition of LLnL, indicating that these proteins are quickly turned over in the cell (Figure 4A). More importantly, coexpression of Mash1 and E47 resulted in a profound stabilization of Mash1 in the absence of the proteasome inhibitor. Furthermore, Mash1 stabilization by E47 was partially lost by coexpression of Id1. We confirmed that E47 heterodimerizes with either Id1 or Mash1, whereas Mash1 and Id1 do not (Norton, 2000; Jögi et al, 2002; data not shown). To analyze the importance of Mash1–E47 heterodimer formation in Mash1 stabilization, we made similar assays using two E47 deletion mutants (E47 HLH, which contains bHLH, and E47 ΔHLH, defective in heterodimer formation; Voronova and Baltimore, 1990). The E47 mutant, which was unable to heterodimerize with Mash1, was also defective in Mash1 stabilization (Figure 4B). Interestingly, expression of a mutant form of Mash1, devoid of the bHLH region, was much less enhanced by the addition of LLnL, suggesting that bHLH might contain determinants for the rapid turnover of Mash1 (Figure 4B). We further confirmed the decreased Mash1 protein turnover in the heterodimeric state by pulse-chase assays in HEK-293 cells. Overexpression of E47 markedly enhanced the half-life of exogenous Mash1, which was about 3 h compared with only 50 min in cells that overexpressed Id1 either in combination with Mash1 alone or with both Mash1 and E47 (Figure 4C). These data indicate that Mash1 protein stability is strongly enhanced when Mash1 forms heterodimers with E proteins, which is competed by the presence of Id1.
Figure 4.
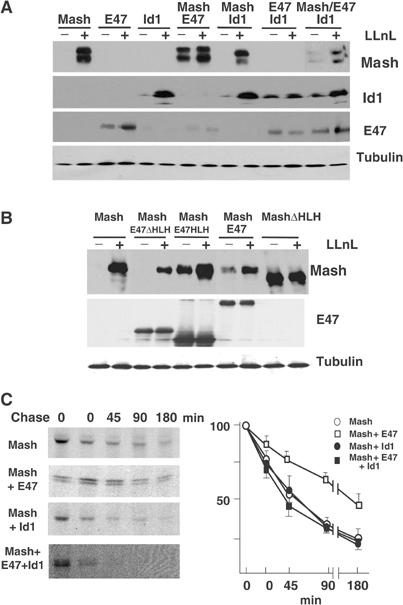
(A, B) Extracts from HEK-293 cells transfected with the expression constructs indicated, treated or not with 50 μM LLnL for 8 h, were analyzed by immunoblotting. (C) HEK-293 cells, transfected with the constructs indicated, were pulsed with [35S]methionine for 3 h and labeled proteins were chased in unlabeled media for different times. Labeled Mash1 was immunoprecipitated and visualized by SDS–PAGE. Quantification of Mash1 levels from three to four separate assays is expressed as mean±s.e.m. of percentage values of samples at time zero.
To modulate Id1 protein levels independently of cytokine addition, we generated DMS53 clones that expressed murine Id1 under a tetracycline-responsive promoter (Tet off) (Chambard and Pognonec, 1998). Several clones resulted positive for tetracycline-regulated expression of exogenous Id1. Exogenous murine Id1 has a slightly higher electrophoretic mobility compared with human Id1, which allows us to discriminate easily between ectopic and endogenous Id1 expression (Figure 5A). We then performed time-course and dose–response analysis of Id1 induction and analyzed endogenous levels of Mash1 expression. When two independent clones were incubated with decreasing amounts of tetracycline, they displayed increasing levels of ectopic Id1 that correlated with decreasing amounts of Mash1 protein (Figure 5B). Similarly, parental and two Id1-overexpressing clones were incubated overnight with 30 ng/ml tetracycline in order to repress ectopic Id1 expression, and then depleted of tetracycline for a range of times. The induction profile of Id1 protein levels correlated with a decrease in Mash1 expression (Figure 5C).
Figure 5.
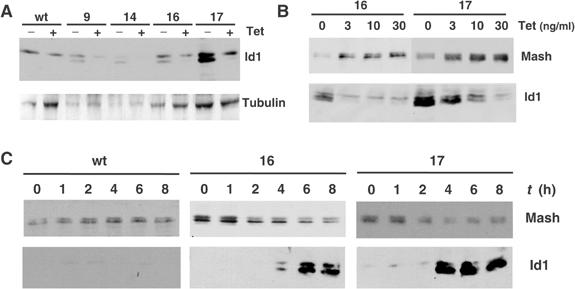
(A) Immunoblot analysis of tetracycline (Tet) responsiveness of several stable DMS53-Id1 clones. (B) Id1-overexpressing clones (Id16 and Id17) were incubated in the presence of 30 ng/ml of tetracycline overnight, and then incubated for 8 h in the presence of different concentrations of tetracycline. Expressions of Mash1 and Id1 were analyzed by immunoblotting. (C) Parental and two Id1-overexpressing clones (Id16 and Id17) were incubated overnight with 30 ng/ml of tetracycline in order to block ectopic Id1 expression. Then cells were deprived of tetracycline for the times indicated and expressions of Mash1 and Id1 were analyzed by immunoblotting.
DMS53 cell clones, which stably overexpressed E47, were generated and analyzed (Figure 6A). Clones 10 and 17 showed an increase in the steady-state levels of endogenous Mash1 compared with wild-type cells (Figure 6A). More importantly, after addition of BMP-2 for 2 h, overexpressed E47 partially prevented the degradation of Mash1.
Figure 6.
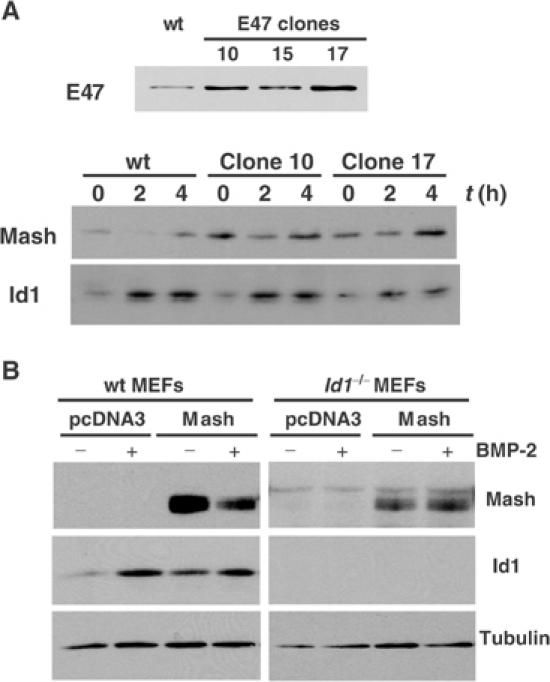
(A) E47 expression of DMS53 cell clones, stably overexpressing E47, was analyzed by immunoblotting and is shown in the upper panel. Parental and two independent clones (E10 and E17) were treated for 2 or 4 h with 5 nM BMP-2 and expressions of endogenous Mash1 and Id1 were analyzed by immunoblotting (lower panel). (B) Wild-type or Id1−/− MEFs were transfected with the indicated expression constructs. After 24 h, cells were splitted and treated with 10 nM BMP-2 for 3 h. Expressions of Mash1, Id1 and tubulin were analyzed by immunoblotting.
To examine the requirement of Id1 for the BMP-induced effects on Mash1 levels, we analyzed BMP-induced Mash1 degradation in Id1−/− mouse embryonic fibroblasts (MEFs). Wild-type as well as Id1−/− MEFs were able to respond to BMP-2. This was observed using a reporter containing the BMP-specific enhancer of the Id1 gene promoter (López-Rovira et al, 2002) (data not shown). When Mash1 was ectopically expressed in wild-type or Id1−/− MEFs, BMP-2-induced degradation of Mash1 was lost in Id1−/− MEFs (Figure 6B). These results indicate that the induction of Id1 is necessary and sufficient to mediate the BMP effects on Mash1 levels.
E47-dependent phosphorylation on Ser152 increases Mash1 protein stability
SDS–PAGE analysis of cell extracts from HEK-293 cells cotransfected with Mash1 and E47 showed that Mash1 appeared as two major species compared with a single band in extracts from cells transfected with Mash1 alone (Figure 4C). To determine whether the retarded band is due to phosphorylation events, we immunoprecipitated 35S-labeled Mash1 from cells cotransfected with E47 and tested the immunoprecipitates with alkaline phosphatase. Phosphatase treatment converted the upper form into the lower Mash1 species, indicating that the upper band was caused by phosphorylation events (data not shown). We next examined the effects of cotransfection of E47 and Id1 on Mash1 phosphorylation and E47 interaction. Cotransfection of E47 led to increased levels of phosphorylated forms of Mash1 and the appearance of co-immunoprecipitated E47, compared with cells transfected with Mash1 alone (Figure 7A). In contrast, cotransfection of E47 plus Id1 partially reverted the appearance of phosphorylated forms of Mash1 and levels of co-immunoprecipitated E47, which further supports a correlation between the amounts of E47 that can interact with Mash1 and levels of hyperphosphorylated Mash1. Similar to Id1, when a constitutively active form of BMP receptor type I was cotransfected with E47, we also observed a decrease in the hyperphosphorylated forms of Mash1 (Figure 7B). To analyze the requirement of Mash1–E47 heterodimer formation in Mash1 phosphorylation, we made similar assays using two E47 deletion mutants (E47 HLH, which contains bHLH, and E47 ΔHLH, defective in heterodimer formation). The E47 mutant, which was unable to heterodimerize with Mash1, was also unable to induce Mash1 phosphorylation (Figure 7C). Similarly, expression of a mutant form of Mash1, devoid of the bHLH region, was not phosphorylated in the presence of E47. We also analyzed extracts from transfected cells labeled with 32Pi and [35S]methionine and compared the ratios of the major labeled forms of Mash1. Mash1 was present as two main phosphorylated bands and a higher mobility unphosphorylated one. While coexpression of E47 induced the appearance of the higher phosphorylated band, coexpression of Id1 increased the amount of Mash1 in the unphosphorylated form (Figure 7D). Phosphoamino acid analysis revealed that all phosphorylated residues were phosphoserine (data not shown). To determine E47-induced phosphorylation sites on Mash1, tryptic peptides were generated from the two phosphorylated bands, and the resulting peptides were analyzed by Tris–Tricine SDS–PAGE. Comparison of 32P-labeled peptides from these bands indicated that differential phosphorylation was located in a peptide with a molecular mass of about 400–800 Da (data not shown). Sequence analysis revealed that only three distinct peptides of about that mass contain serines conserved in Mash1 orthologs. We generated site-directed mutants corresponding to these sites and confirmed them by sequencing. Analysis of these mutants demonstrated that the mutant in which Ser152 was changed to Ala (S152A) lost E47-dependent phosphorylation (Figure 8A). Examination of the structure of bHLH transcription factors revealed that Ser152 is located in the solvent-exposed loop that joins the two α-helices involved in transcription factor heterodimerization (Chavali et al, 2001). It is noteworthy that Mash1(S152A) co-immunoprecipitated significantly lower levels of E47. To assess the relevance of Ser152 phosphorylation on transcriptional activity, mutants were transfected with the TH reporter construct. The Ser152 mutant showed higher transcriptional activity than wild type or the other mutants when transfected alone, whereas no significant differences were observed when cotransfected with E47 (Figure 8B). On the basis of our previous results, we tested whether Ser152 phosphorylation was involved in the stabilization of Mash1 protein levels by heterodimerization with E47. Pulse-chase assays indicated that, as previously shown, wild-type Mash1 levels were stabilized by coexpression of E47. In contrast, Mash1(S152A) levels were much less stabilized (Figure 8C and D).
Figure 7.
HEK-293 cells, transfected with the constructs indicated, were labeled with [35S]methionine or 32Pi for 3 h as described in Materials and methods. Labeled Mash1 or E47 was immunoprecipitated and visualized by SDS–PAGE (see text).
Figure 8.
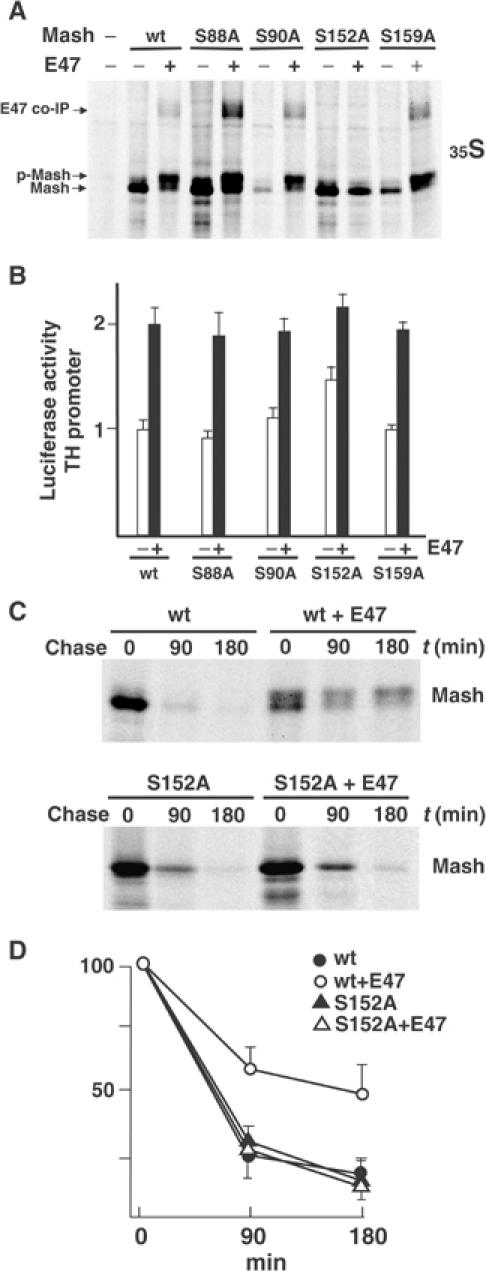
(A) HEK-293 cells, transfected with the wild-type or mutant Mash1 constructs, with or without E47 expression construct as indicated, were labeled with [35S]methionine and Mash1 was immunoprecipitated as above. (B) C17.2 cells were cotransfected with a TH promoter-driven reporter construct and the indicated combinations of wild-type and mutant Mash1 with (filled bars) or without (empty bars) E47 expression vectors. The results are expressed as mean±s.e.m. of triplicates from five independent transfections. (C, D) Pulse-chase assays and quantification were performed in HEK-293 cells, transfected with the constructs indicated, as described in Figure 4B.
Involvement of CK2 in E47-dependent phosphorylation of Mash1
Analysis of the sequence flanking Ser152 of Mash1 from several species revealed consensus sites for PKA (KKx Ser152) and CK2 (Ser152xxE). To assess the involvement of distinct signaling pathways in E47-dependent phosphorylation of Mash1, we used several small-molecule drugs. Among those tested, we consistently observed that 2 h exposure to 5,6-dichloro-1-β-ribofuranosylbenzimidazole (DRB), a specific inhibitor of CK2, significantly reduced E47-dependent phosphorylation of Mash1 (Figure 9A). To further confirm the involvement of CK2 in Ser152 phosphorylation, we extended these assays by using three structurally unrelated CK2 inhibitors: emodin, a quinone; apigenin, a flavonoid; and DRB, a halogenated benzimidazole (Sarno et al, 2002). Addition of these inhibitors not only reduced Mash1 phosphorylation but also significantly reduced the levels of co-immunoprecipitated E47 (Figure 9B). To confirm that CK2 is a Mash1 kinase, we knocked down expression of its CK2β subunit by RNA interference. Transfection of HEK-293 cells with Mash1 and E47 expression constructs and increasing amounts of a specific siRNA directed against CK2β subunit resulted in a significant reduction in CK2β subunit expression (Figure 9C). In this condition, hyperphosphorylated Mash1 as well as co-immunoprecipitated E47 were also significantly reduced. Transfection of an unrelated siRNA did not result in such an effect (data not shown).
Figure 9.
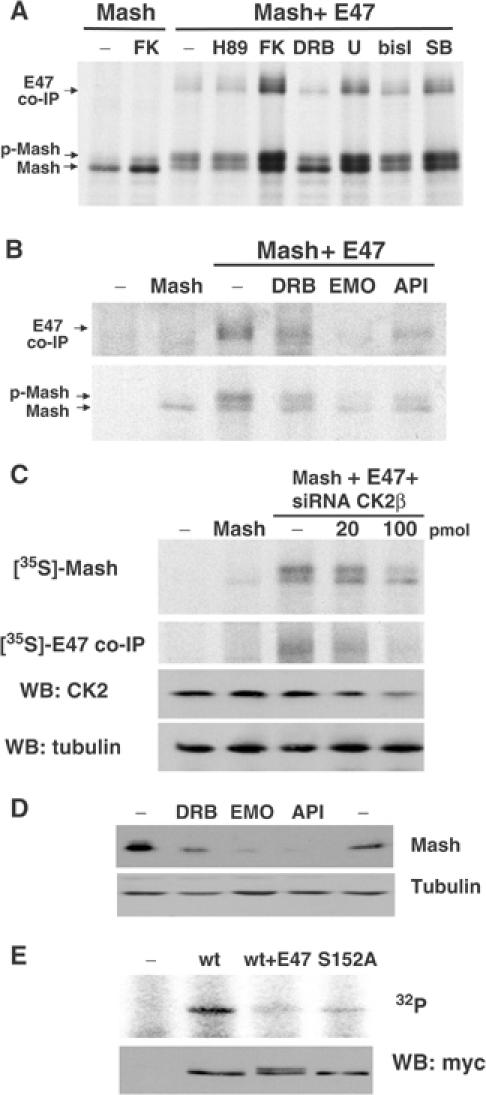
(A, B) HEK-293 cells, transfected with the wild-type Mash1 with or without E47 expression constructs as indicated, were labeled with [35S]methionine and treated for 2 h with the drugs indicated (FK (forskolin); H89; DRB (5,6-dichloro-1-β-ribofuranosylbenzimidazole); U (U0126); bisI (bisindoleylmaleimide I); SB (SB203580); emo (emodin); api (apigenin)). Immunoprecipitated Mash1 and co-immunoprecipitated E47 were visualized as described above. (C) HEK-293 cells were transfected with the indicated expression constructs and siRNA for CK2β subunit mRNA or an unrelated siRNA directed against uPF2K as a control. After 24 h, cells were either metabolically labeled and both Mash1 and co-immunoprecipitated E47 were visualized as described above, or lysed and both CK2β and tubulin were analyzed by immunoblotting. (D) DMS53 cells were treated with DRB, emodin or apigenin for 2 h and Mash1 or α-tubulin were visualized by immunoblotting. (E) Immunoprecipitates of extracts from HEK-293 cells transfected with the indicated constructs were split and either incubated with recombinant CK2 and [γ-32P]ATP (upper panel) or subjected to immunoblotting in order to visualize the relative amounts of immunoprecipitated Mash1 (lower panel).
We also examined the effects of these inhibitors on endogenous Mash1 levels. Treatment of DMS53 cells with these inhibitors for 2 h induced a substantial reduction of Mash1 steady-state levels (Figure 9D). We next tested whether protein kinase CK2 could directly phosphorylate Mash1. Extracts from HEK-293 cells that expressed either Mash1 wild type, alone or in combination with E47, or Mash1(S152A) were immunoprecipitated and incubated in the presence of recombinant CK2. Addition of the kinase resulted in the phosphorylation of Mash1 (Figure 9E). However, Mash1(S152A) and wild-type Mash1 from E47-cotransfected cells were much less efficiently phosphorylated. Taken together, these observations implicate protein kinase CK2 in the E47-induced phosphorylation of Mash1 on Ser152.
Discussion
Here, we show that exposure of cultured neuroendocrine lung carcinoma cells to BMP-2 rapidly downregulates steady-state levels of Mash1 and some neural-specific markers such as TH and synaptophysin. BMP-2 induced a post-transcriptional decrease in Mash1 protein levels. We also demonstrate that Mash1 protein stability is tightly regulated by the E47/Id1 expression ratio. We also provide several findings that suggest that induction of Id proteins by BMP-2 might mediate Mash1 degradation. First, transient induction of Id1 by BMP-2 negatively correlates with Mash1 protein levels. Second, ectopic increase of Id1 levels is sufficient to induce degradation of either ectopic or endogenous Mash1 protein. Third, ectopic expression of E47 or expression of Mash1 in Id1−/− MEFs makes Mash1 refractory to addition of BMP-2. In addition, we provide evidence that suggests a model in which the E47/Id1 expression ratio also regulates CK2-mediated phosphorylation of Mash1 on Ser152, which in turn increases the stability of the Mash1–E47 heterodimers (Figure 10).
Figure 10.
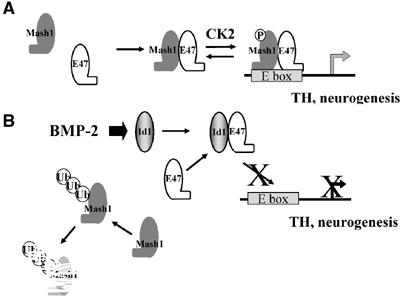
Model of mechanisms of repression of Mash1 by BMP-2/Id1. (A) In differentiating neurogenic precursors, Mash1 heterodimerizes with E proteins, which promotes phosphorylation of Mash1 on Ser152, increasing further heterodimer interaction. (B) Activation of the BMP signaling pathway leads to increased levels of Id proteins. Id proteins sequester E proteins away from Mash1, which leads not only to transcriptionally inactive complexes but also enhances degradation of Mash1 monomers.
It has been suggested that for a cell committed to a neuronal fate, the transition from proliferation to neurogenesis involves a coordinate increase in proneural bHLH activity and decrease in Id protein activities (Ross et al, 2003; Ying et al, 2003). Ids are expressed in dividing neuroblasts in sites of active progenitor proliferation up to about embryonic day 12.5 (Jen et al, 1997). In older animals, in sites where active neurogenesis takes place, Id1 and Id3 are no longer expressed (Lyden et al, 1999). The premature neuronal differentiation in Id1–Id3 double knockout mice indicates that both Id proteins are required to maintain the timing of differentiation in mammalian development (Lyden et al, 1999). Gain-of-function studies in which Ids are overexpressed also indicate that Ids exert an inhibitory role in neurogenesis while increasing astrocytogenesis (Cai et al, 2000; Kondo and Raff, 2000; Nakashima et al, 2001). Similarly, treatment of stem cells or cortical progenitors with BMPs blocks neurogenesis (Gross et al, 1996; Nakashima et al, 1999, 2001; Ying et al, 2003). In a model of neurogenesis in the adult subventricular zone, the spatial pattern of expression of noggin, an extracellular BMP inhibitor, creates a neurogenic microenvironment by inhibiting antineurogenic BMP signaling in proliferating precursors (Lim et al, 2000). Interestingly, BMP-2 also appears to inhibit neurogenesis in cultured olfactory cells through enhanced degradation of Mash1 by an unknown mechanism that requires new gene expression (Shou et al, 1999). Our results strongly indicate that induction of Id1, a BMP-2 early response gene (López-Rovira et al, 2002), might be involved in this inhibitory mechanism.
Biochemical and genetic data have generated a consensus view whereby Id proteins act primarily by sequestering ubiquitous class A bHLH proteins (E proteins), thereby preventing them from binding DNA alone or as heterodimers with tissue-specific bHLH (Norton et al, 1998). However, Id proteins poorly associate with tissue-specific class B bHLH. In this respect, Id proteins do not interact with Mash1 (Jögi et al, 2002) (data not shown). Our findings provide the first direct biochemical evidence for an additional regulatory mechanism of repression of tissue-specific bHLH by Id proteins. Induction of Id1 not only sequesters E proteins but also induces enhanced degradation of Mash1 protein. This dual regulation by Id1 ensures a stronger short-term control of Mash1 function. Furthermore, Id1-induced degradation shows specificity for some bHLH proteins. While Mash1 was susceptible to BMP-2 induced degradation, E47 levels were unaffected. When a distinct class B bHLH, myogenin, was analyzed, BMP-induced Id1 levels also increased myogenin protein degradation (Viñals and Ventura, manuscript submitted). Furthermore, it has been shown that post-translational modification and degradation regulate the levels of the bHLH MyoD (Song et al, 1998; Floyd et al, 2001). These results indicate that, besides sequestering ubiquitous E proteins, Id-mediated degradation of tissue-specific bHLH might be a relevant mechanism in the antineurogenic properties of BMPs and may be applicable to other cell differentiation contexts.
In its monomeric form, the HLH domain does not adopt a definitive structure (Chavali et al, 2001). One potential interpretation of our results is that Mash1 monomers are intrinsically prone to proteasomal degradation through exposure of a targeting epitope. This is supported by evidence showing that overexpression of monomeric Mash1 results in a very short-lived protein and that a mutant form of Mash1, devoid of its HLH, is much more stable. Heterodimerization with E proteins and subsequent DNA binding change the conformation of Mash1 and protect Mash from degradation. Thus, we propose a model where induction of Id1 by BMP-2, through its ability to block formation of protective complexes with E proteins, is sufficient to increase monomeric Mash1, which is rapidly degraded (Figure 10).
Here, we also demonstrate that heterodimerization of Mash1 with E47 promotes multiple phosphorylations of Mash1, which include Ser152. These phosphorylations could efficiently be reverted by expression of either Id1. In support of this hypothesis, we consistently observed that there was a strong correlation between the amount of phosphorylated Mash1 and the levels of E47 that co-immunoprecipitated with Mash1. Phosphorylation of Mash1 did not alter its subcellular localization, since we did not detect changes in the ratio between phosphorylated and unphosphorylated Mash1 in either cytoplasmic or nuclear cell extracts (data not shown). The observation that the phosphorylation mutant form of Mash1 (MashS152A) became less stabilized by coexpression of E47 than the wild-type form could indicate that E47-dependent phosphorylation of Ser152 might hinder motifs required for efficient degradation of Mash1. However, a plausible alternative hypothesis is that Ser152 phosphorylation triggered by E47 induces increased heterodimer interaction and affinity, which, in turn, protect Mash1 from its default pathway of degradation. This hypothesis is supported by several evidences. First, E47 expression stabilizes both phosphorylated and unphosphorylated forms of Mash1 (Figure 4). Second, Mash1(S152A) has less affinity for E47, judged by the amount of co-immunoprecipitated E47. Similarly, addition of CK2 inhibitors or knockdown of the CK2β subunit, which inhibits Mash1 phosphorylation, also decreases the amount of co-immunoprecipitated E47 (Figure 9). Ser152 is located in a solvent-exposed loop between helices 1 and 2 of the HLH domain. It has been shown that the two α-helices are the major contributors to the dimerization properties of HLH. However, structural studies also indicate that a few contacts of residues in the loop region could facilitate spatial juxtaposition of the two helices of the motif (Chavali et al, 2001). Thus, phosphorylation of Ser152, close to the first lysine of helix 2, which is strongly involved in dimerization, would alter the net charge of that region and might increase heterodimer stability.
CK2 is a constitutively active kinase independent of second messenger signals and localized both in the nucleus and cytoplasm (Litchfield, 2003). Here we show that CK2 is involved in the direct phosphorylation of Mash1 in Ser152. First, recombinant CK2 phosphorylates Mash1 in vitro, whereas the mutant S152A or Mash1, purified from complexes with E47 and already phosphorylated, showed less phosphorylation in vitro. Second, pharmacological and genetic inhibition of CK2 activity reduces phosphorylation and E47 heterodimerization of Mash1. These findings indicate that CK2 (or a closely related kinase) is one of the kinases involved in E47-dependent phosphorylation of Mash1.
It has been assumed that consensus sequences for protein kinases represent a necessary condition for phosphorylation; however, efficient targeting of an individual substrate depends on additional features, notably recruitment to specific subcellular compartments or formation of protein complexes (Meggio and Pinna, 2003). Ser152 conforms a minimal CK2 consensus site (S-xx-D/E), which is conserved across Mash1 orthologs. However, we found that efficient phosphorylation of Mash1 requires heterodimerization with E47. Whether E47 contains determinants recognized by the catalytic subunit of CK2, or instead the conformational change induced by E47 exposes determinants already present in Mash1 primary sequence, remains to be solved.
Materials and methods
Plasmids, reagents and antibodies
cDNA encoding myc-tagged Mash1 was kindly provided by Dr R Kageyama and subcloned into pcDNA3 expression vector, which was used as a parental plasmid to generate the phosphorylation mutants using PCR approaches. A mutant Mash1 lacking its bHLH domain (deletion of amino acids (aa) 132–178) was generated by cutting with HpaI and Eco47III wild-type Mash1. The expression vectors encoding HA-tagged full-length E47 and deletion mutants containing (aa 386–649) or lacking (aa 1–386) its bHLH were kindly provided by Dr P Muñoz-Canoves. Murine Id1 cDNA was obtained by PCR, sequenced and subcloned into pcDNA3 and into a tetracycline-responsive expression vector pTISN (Chambard and Pognonec, 1998). The His-tagged ubiquitin expression vector was provided by Dr D Bohmann. A luciferase reporter construct from TH promoter-enhancer was provided by Dr H Ichinose (Suzuki et al, 2002). BMP-2 was a generous gift from the Genetics Institute and TGF-β1 was from Sigma. LLnL (Sigma) was used at 50 μM, forskolin (Sigma) was used at 25 μM, DRB (Calbiochem) was used at 50 μM, and apigenin and emodin, each at 50 μM, were a gift from Dr E Itarte. H89, U0126 (U), bisindoleylmaleimide I (bisI) and SB203580 (SB) were from Calbiochem and were used at 5 μM, except for SB, which was used at 10 μM. Antibodies against β-tubulin III, SNAP-25 and synaptophysin were a gift from Dr I Ferrer. Antibodies against c-myc (9E10, Santa Cruz Biotechnology), HA12CA5 (Roche), TH (TH-2, Sigma), Mash1 (BD Pharmingen), Id1 (C-20, Santa Cruz Biotechnology), E47 (N-649, Santa Cruz Biotechnology), casein kinase II β-subunit (BD Transduction Laboratories) and α-tubulin (Sigma) were used for immunoblotting.
Cell culture and transfection
DMS53 cells were maintained in Waymouth MB 752 media supplemented with 10% FBS and antibiotics. HEK-293 cells were maintained in DMEM supplemented with 10% FBS and antibiotics. C17.2 cells (obtained from Dr E Arenas) were maintained in DMEM supplemented with 10% FBS, 5% horse serum, antibiotics and sodium pyruvate. HEK-293 and C17.2 cells were transiently transfected using polyethyleneimine (Abdallah et al, 1996) and Fugene6 (Roche), respectively. Fibroblasts derived from either wild-type or Id1−/− mouse embryos (a gift from Dr R Benezra) were transiently transfected using Lipofectamine 2000 (Invitrogen). The DMS53-tTA cell line was obtained by stably transfecting the tTa vector into DMS53 cells, and stable clones were isolated after puromycin selection as previously described (Chambard and Pognonec, 1998). Then, pTISN-Id1 was transfected and clones were obtained after G418 selection. Similarly, DMS53 clones, stably expressing myc-Mash1 or E47, were obtained after transfection of myc-Mash1-pcDNA3 or E47-pcDNA3 and selection with G418 for 1–2 weeks.
Northern and RT–PCR analysis
Northern blot analysis was performed as previously described (Chalaux et al, 1998). For RT–PCR analysis, 2 μg of RNA was reverse-transcribed using a Ready-to-Go First Strand Kit (Amersham Pharmacia) and oligo-dT as a primer. A total of 25–35 cycles of semiquantitative PCR amplification were carried out using 2 μl of the reverse-transcribed RNA product and specific oligonucleotides.
Reporter assays
DMS53, C17.2 or fibroblasts derived from either wild-type or Id1−/− mouse embryos were split 24 h after transfection and treated with indicated concentrations of BMP-2 for 16 h. Luciferase activities were quantified using the Luciferase Assay System (Promega). Luciferase values were normalized using β-galactosidase activity measured with the Luminescent β-Galactosidase Detection Kit II (Clontech) and expressed as mean±s.e.m. assayed in triplicate in three to five independent experiments.
Immunoblotting and immunoprecipitation
Protein extracts were resolved on 10–15% SDS–PAGE (acrylamide/bisacrylamide ratio 37.5/1). Immunoblot analysis was performed as described (López-Rovira et al, 2002). Immunoprecipitations with 9E10 or HA12CA5 antibodies were performed as previously described (Ventura et al, 1994). Immunoprecipitates were resolved in 10% SDS–PAGE, dried and autoradiographed. In these experiments, in order to maximize the lower electrophoretic mobility of phosphorylated Mash1, the acrylamide/bisacrylamide ratio was changed to 150/1. Quantification was performed using the BioRad Molecular Imager software.
Metabolic labeling
Labeling with [35S]methionine or 32Pi followed by immunoprecipitation of labeled protein was performed as previously described (Ventura et al, 1994) using HEK-293-T cells that overexpressed the indicated constructs.
In vivo ubiquitination assays
Detection of ubiquitinated Mash1 was performed in HEK-293 cells that overexpressed different combinations of His-tagged ubiquitin and Mash1, essentially as described by Treier et al (1994).
RNA interference experiments
To knock down CK2β expression, siRNA oligonucleotides against CK2β mRNA were generated (Dharmacon). The targeted sequence was 5′-AAUGAAUUCUUCUGUGAAGUG-3′, which has been shown to suppress CK2β expression in human cells (Kato et al, 2003). As a control, we used an unrelated siRNA directed against uPF2K (5′-AAGCUGCCUGGACAAAACAUG-3′). HEK-293 cells were transfected with the corresponding constructs and siRNA oligos using Lipofectamine 2000 (Invitrogen). After 24 h, cells were metabolically labeled and analyzed by immunoprecipitation with 9E10 antibody or by immunoblotting with the indicated antibodies.
In vitro phosphorylation by CK2
Immunoprecipitates from transfected HEK-293 cells, obtained as described above, were incubated in the presence of 100 μM [γ-32P]ATP and 100 U of purified CK2 (New England Biolabs) for 15 min at 30°C. Phosphorylated products were resolved by SDS–PAGE and autoradiographed.
Acknowledgments
We thank the Genetics Institute for providing BMP-2 and Drs E Arenas, R Benezra, D Bohmann, JC Chambard, H Ichinose and R Kageyama for reagents and Drs C Caelles, I Ferrer, E Itarte and P Muñoz-Cánoves for reagents and helpful suggestions. We also thank Esther Adanero, Maria Molas and Àurea Navarro for technical assistance. F Viñals is a recipient of a research contract from MCyT (Programa Ramón y Cajal). This research was supported by grants from MCyT (BMC2002-00737 to F Ventura and BFI2001-2987 to F Viñals) and Generalitat de Catalunya (Distinció de la Generalitat a joves investigadors).
References
- Abdallah B, Hassan A, Benoist C, Goula D, Behr JP, Demeneix BA (1996) A powerful nonviral vector for in vivo gene transfer into the adult mammalian brain: polyethylenimine. Hum Gene Ther 7: 1947–1954 [DOI] [PubMed] [Google Scholar]
- Borges M, Linnoila RI, van de Velde HJ, Chen H, Nelkin BD, Mabry M, Baylin SB, Ball DW (1997) An achaete-scute homologue essential for neuroendocrine differentiation in the lung. Nature 386: 852–855 [DOI] [PubMed] [Google Scholar]
- Bounpheng MA, Dimas JJ, Dodds SG, Christy BA (1999) Degradation of Id proteins by the ubiquitin–proteasome pathway. FASEB J 13: 2257–2264 [PubMed] [Google Scholar]
- Brosenitsch TA, Katz DM (2002) Expression of Phox2 transcription factors and induction of the dopaminergic phenotype in primary sensory neurons. Mol Cell Neurosci 20: 447–457 [DOI] [PubMed] [Google Scholar]
- Cai L, Morrow EM, Cepko CL (2000) Misexpression of basic helix–loop–helix genes in the murine cerebral cortex affects cell fate choices and neuronal survival. Development 127: 3021–3030 [DOI] [PubMed] [Google Scholar]
- Casarosa S, Fode C, Guillemot F (1999) Mash1 regulates neurogenesis in the ventral telencephalon. Development 126: 525–534 [DOI] [PubMed] [Google Scholar]
- Chalaux E, López-Rovira T, Rosa JL, Bartrons R, Ventura F (1998) JunB is involved in the inhibition of myogenic differentiation by bone morphogenetic protein-2. J Biol Chem 273: 537–543 [DOI] [PubMed] [Google Scholar]
- Chambard JC, Pognonec P (1998) A reliable way of obtaining stable inducible clones. Nucleic Acids Res 26: 3443–3444 [DOI] [PMC free article] [PubMed] [Google Scholar]
- Chavali GB, Vijayalakshmi C, Salunke DM (2001) Analysis of sequence signature defining functional specificity and structural stability in helix–loop–helix proteins. Proteins 42: 471–480 [DOI] [PubMed] [Google Scholar]
- Derynck R, Zhang YE (2003) Smad-dependent and Smad-independent pathways in TGF-β family signalling. Nature 425: 577–584 [DOI] [PubMed] [Google Scholar]
- Floyd ZE, Trausch-Azar JS, Reinstein E, Ciechanover A, Schwartz AL (2001) The nuclear ubiquitin–proteasome system degrades MyoD. J Biol Chem 276: 22468–22475 [DOI] [PubMed] [Google Scholar]
- Gross RE, Mehler MF, Mabie PC, Zang Z, Santschi L, Kessler JA (1996) Bone morphogenetic proteins promote astroglial lineage commitment by mammalian subventricular zone progenitor cells. Neuron 17: 595–606 [DOI] [PubMed] [Google Scholar]
- Gómez-Santos C, Ambrosio S, Ventura F, Ferrer I, Reiriz J (2002) TGF-beta1 increases tyrosine hydroxylase expression by a mechanism blocked by BMP-2 in human neuroblastoma SH-SY5Y cells. Brain Res 958: 152–160 [DOI] [PubMed] [Google Scholar]
- Guillemot F, Lo LC, Johnson JE, Auerbach A, Anderson DJ, Joyner AL (1993) Mammalian achaete-scute homolog 1 is required for the early development of olfactory and autonomic neurons. Cell 75: 463–476 [DOI] [PubMed] [Google Scholar]
- Ito T, Udaka N, Yazawa T, Okudela K, Hayashi H, Sudo T, Guillemot F, Kageyama R, Kitamura H (2000) Basic helix–loop–helix transcription factors regulate the neuroendocrine differentiation of fetal mouse pulmonary epithelium. Development 127: 3913–3921 [DOI] [PubMed] [Google Scholar]
- Jen Y, Manova K, Benezra R (1997) Each member of the Id gene family exhibits a unique expression pattern in mouse gastrulation and neurogenesis. Dev Dyn 208: 92–106 [DOI] [PubMed] [Google Scholar]
- Jögi A, Persson P, Grynfeld A, Pahlman S, Axelson H (2002) Modulation of basic helix–loop–helix transcription complex formation by Id proteins during neuronal differentiation. J Biol Chem 277: 9118–9126 [DOI] [PubMed] [Google Scholar]
- Kato T, Delhase M, Hoffmann A, Karin M (2003) CK2 is a C-terminal IκB kinase responsible for NF-κB activation during UV response. Mol Cell 12: 829–839 [DOI] [PubMed] [Google Scholar]
- Kee BL, Rivera RR, Murre C (2001) Id3 inhibits B lymphocyte progenitor growth and survival in response to TGF-beta. Nat Immunol 2: 242–247 [DOI] [PubMed] [Google Scholar]
- Kondo T, Raff M (2000) The Id4 HLH protein and the timing of oligodendrocyte differentiation. EMBO J 19: 1998–2007 [DOI] [PMC free article] [PubMed] [Google Scholar]
- Lee JL (1997) Basic helix–loop–helix genes in neural development. Curr Opin Neurobiol 7: 13–20 [DOI] [PubMed] [Google Scholar]
- Lim DA, Tramontin AD, Trevejo JM, Herrera DG, Garcia-Verdugo JM, Alvarez-Buylla A (2000) Noggin antagonizes BMP signaling to create a niche for adult neurogenesis. Neuron 28: 713–726 [DOI] [PubMed] [Google Scholar]
- Linnoila RI, Zhao B, De Mayo JL, Nelkin BD, Baylin SB, De Mayo FJ, Ball DW (2000) Constitutive achaete-scute homologue-1 promotes airway dysplasia and lung neuroendocrine tumors in transgenic mice. Cancer Res 60: 4005–4009 [PubMed] [Google Scholar]
- Litchfield DW (2003) Protein kinase CK2: structure, regulation and role in cellular decisions of life and death. Biochem J 369: 1–15 [DOI] [PMC free article] [PubMed] [Google Scholar]
- Lo L, Johnson JE, Wuenschell CW, Saito T, Anderson DJ (1991) Mammalian achaete-scute homolog 1 is transiently expressed by spatially restricted subsets of early neuroepithelial and neural crest cells. Genes Dev 9: 1524–1537 [DOI] [PubMed] [Google Scholar]
- Lo L, Morin X, Brunet JF, Anderson DJ (1999) Specification of neurotransmitter identity by Phox2 proteins in neural crest stem cells. Neuron 22: 693–705 [DOI] [PubMed] [Google Scholar]
- Lo L, Tiveron MC, Anderson DJ (1998) MASH1 activates expression of the paired homeodomain transcription factor Phox2a, and couples pan-neuronal and subtype-specific components of autonomic neuronal identity. Development 125: 609–620 [DOI] [PubMed] [Google Scholar]
- López-Rovira T, Chalaux E, Massagué J, Rosa JL, Ventura F (2002) Direct binding of Smad1 and Smad4 to two distinct motifs mediates bone morphogenetic protein-specific transcriptional activation of Id1 gene. J Biol Chem 277: 3176–3185 [DOI] [PubMed] [Google Scholar]
- Lyden D, Young AZ, Zagzag D, Yan W, Gerald W, O'Reilly R, Bader BL, Hynes RO, Zhuang Y, Manova K, Benezra R (1999) Id1 and Id3 are required for neurogenesis, angiogenesis and vascularization of tumour xenografts. Nature 401: 670–677 [DOI] [PubMed] [Google Scholar]
- Meggio F, Pinna LA (2003) One-thousand-and-one substrates of protein kinase CK2? FASEB J 17: 349–368 [DOI] [PubMed] [Google Scholar]
- Mehler MF, Mabie PC, Zhang D, Kessler JA (1997) Bone morphogenetic proteins in the nervous system. Trends Neurosci 20: 309–317 [DOI] [PubMed] [Google Scholar]
- Nakashima K, Takizawa T, Ochiai W, Yanagisawa M, Hisatsune T, Nakafuku M, Miyazono K, Kishimoto T, Kageyama R, Taga T (2001) BMP2-mediated alteration in the developmental pathway of fetal mouse brain cells from neurogenesis to astrocytogenesis. Proc Natl Acad Sci USA 98: 5868–5873 [DOI] [PMC free article] [PubMed] [Google Scholar]
- Nakashima K, Yanagisawa M, Arakawa H, Kimura N, Hisatsune T, Kawabata M, Miyazono K, Taga T (1999) Synergistic signaling in fetal brain by STAT3–Smad1 complex bridged by p300. Science 284: 479–482 [DOI] [PubMed] [Google Scholar]
- Norton JD (2000) ID helix–loop–helix proteins in cell growth, differentiation and tumorigenesis. J Cell Sci 113: 3897–3905 [DOI] [PubMed] [Google Scholar]
- Norton JD, Deed RW, Craggs G, Sablitzky F (1998) Id helix–loop–helix proteins in cell growth and differentiation. Trends Cell Biol 8: 58–65 [PubMed] [Google Scholar]
- Rawls A, Olson EN (1997) MyoD meets its maker. Cell 89: 5–8 [DOI] [PubMed] [Google Scholar]
- Ross SE, Greenberg ME, Stiles CD (2003) Basic helix–loop–helix factors in cortical development. Neuron 39: 13–25 [DOI] [PubMed] [Google Scholar]
- Sarno S, Moro S, Meggio F, Zagotto G, Dal Ben D, Ghisellini P, Battistutta R, Zanotti G, Pinna LA (2002) Toward the rational design of protein kinase casein kinase-2 inhibitors. Pharmacol Ther 93: 159–168 [DOI] [PubMed] [Google Scholar]
- Shah NM, Groves AK, Anderson DJ (1996) Alternative neural crest cell fates are instructively promoted by TGFbeta superfamily members. Cell 85: 331–343 [DOI] [PubMed] [Google Scholar]
- Shi Y, Massagué J (2003) Mechanisms of TGF-beta signaling from cell membrane to the nucleus. Cell 113: 685–700 [DOI] [PubMed] [Google Scholar]
- Shou J, Rim PC, Calof AL (1999) BMPs inhibit neurogenesis by a mechanism involving degradation of a transcription factor. Nat Neurosci 2: 339–345 [DOI] [PubMed] [Google Scholar]
- Song A, Wang Q, Goebl MG, Harrington MA (1998) Phosphorylation of nuclear MyoD is required for its rapid degradation. Mol Cell Biol 18: 4994–4999 [DOI] [PMC free article] [PubMed] [Google Scholar]
- Spits H, Couwenberg F, Bakker AQ, Weijer K, Uittenbogaart CH (2000) Id2 and Id3 inhibit development of CD34(+) stem cells into predendritic cell (pre-DC)2 but not into pre-DC1. J Exp Med 192: 1775–1783 [DOI] [PMC free article] [PubMed] [Google Scholar]
- Sriuranpong V, Borges MW, Strock CL, Nakakura EK, Watkins DN, Blaumueller CM, Nelkin BD, Ball DW (2002) Notch signaling induces rapid degradation of achaete-scute homolog 1. Mol Cell Biol 22: 3129–3139 [DOI] [PMC free article] [PubMed] [Google Scholar]
- Sun XH (1994) Constitutive expression of the Id1 gene impairs mouse B cell development. Cell 79: 893–900 [DOI] [PubMed] [Google Scholar]
- Suzuki T, Yamakuni T, Hagiwara M, Ichinose H (2002) Identification of ATF-2 as a transcriptional regulator for the tyrosine hydroxylase gene. J Biol Chem 277: 40768–40774 [DOI] [PubMed] [Google Scholar]
- ten Dijke P, Miyazono K, Heldin CH (2000) Signaling inputs converge on nuclear effectors in TGF-beta signaling. Trends Biochem Sci 25: 64–70 [DOI] [PubMed] [Google Scholar]
- Treier M, Staszewski LM, Bohmann D (1994) Ubiquitin-dependent c-Jun degradation in vivo is mediated by the delta domain. Cell 78: 787–798 [DOI] [PubMed] [Google Scholar]
- Ventura F, Doody J, Liu F, Wrana JL, Massagué J (1994) Reconstitution and transphosphorylation of TGF-beta receptor complexes. EMBO J 13: 5581–5589 [DOI] [PMC free article] [PubMed] [Google Scholar]
- Voronova A, Baltimore D (1990) Mutations that disrupt DNA binding and dimer formation in the E47 helix–loop–helix protein map to distinct domains. Proc Natl Acad Sci USA 87: 4722–4726 [DOI] [PMC free article] [PubMed] [Google Scholar]
- Wilson PA, Hemmati-Brivanlou A (1995) Induction of epidermis and inhibition of neural fate by BMP-4. Nature 376: 331–336 [DOI] [PubMed] [Google Scholar]
- Ying Q-L, Nichols J, Chambers I, Smith A (2003) BMP induction of Id proteins suppresses differentiation and sustains embryonic stem cell self-renewal in collaboration with STAT3. Cell 115: 281–292 [DOI] [PubMed] [Google Scholar]