Abstract
Due to the importance of exercise in prehabilitation, we conducted this study to understand the effects of different exercise intensities on cancer-related cachexia.
Forty adult male CDF1 mice were randomly divided into a non-cancer control group (N=10, NC), cancer control group (N=10, CC), cancer with moderate exercise group (N=10, ME, 70% maxHR), and cancer with intense exercise group (N=10, SE, 90% maxHR) for obtaining data such as tissue weight and body weight changes, quality of life (QoL) indicators, and levels of cytokines and a muscle homeostasis regulatory protein.
We verified that mouse colonic carcinoma cancer cells metastasized based on our observation that the weight of CC group lungs was almost 87% greater than NC group lungs. Survival rates of SE, NC, ME, and CC groups were 100%, 100%, 80%, and 50%, respectively (p<0.01). Other results such as tissue and body weight changes, QoL indicators, and protein analyses also supported our hypothesis that the SE group had improved survival compared to CC and ME groups (p<0.05 and p<0.01, respectively).
Our results suggest that exercise, especially intense exercise, improves QoL and survival rate and prevents muscle atrophy. These data suggest that exercise is an optimal prehabilitation choice to alleviate the negative impacts of cancer cachexia.
Keywords: treadmill exercise, mice cancer model, prehabilitation, cancer cachexia, severe intensity exercise.
Introduction
The word cachexia is derived from the Greek words kakos, bad and hexis, condition 1. Cancer cachexia is associated with a loss of fat and muscle tissue, and results in higher mortality 2. Cancer cachexia is defined as a change of at least 5% in any of 3 parameters including muscle strength, fatigue, anorexia, low fat-free mass, and normal biochemistry 3.
The regulation of protein synthesis and breakdown via the complex inflammation system is thought to be involved in cachexia 4. It is not known exactly which proteolysis-related cascade is specifically related with catabolism caused by cancer cachexia, since different animal models have indicated different molecular pathway mechanisms. One study showed that in a cancer cachexia animal model, degradation predominantly occurs via the ubiquitin proteasome pathway 5.
Exercise, by virtue of its anti-inflammatory effect, possibly facilitates the blockage of cytokines such as tumor necrosis factor-alpha (TNF-alpha), which is involved in catabolism during cancer cachexia. Thus, exercise can lead to improved anticancer effects, muscle function, and quality of life 6. However, the restoration or improvement of muscular strength and endurance through exercise is dependent on the type of exercise and the degree of nutrition 7.
In cardiovascular surgery, prehabilitation has been shown to improve cardiac function, respiratory recovery, and postoperative function 8. Prehabilitation is a form of pre-treatment, including exercise training, to prevent or delay cancer cachexia symptoms. In cancer cachexia, prognostic factors should maximize the effect of prehabilitation by using methods such as a cardiopulmonary exercise test (CPET) to improve muscle function, survival rate, recovery, post treatment function, and quality of life 9.
There has yet to be a study on the effects of exercise intensity in a mouse cancer model. We hypothesized that: 1. Mice with cancer have a shorter lifespan than non-cancer control mice. 2. Different exercise intensities may affect cancer cachexia symptoms to different degrees. High intensity treadmill exercise produced a more positive affect on cancer cachexia symptoms than moderate intensity treadmill exercise in a mouse cancer model.
We aimed to emphasize the importance of exercise for prehabilitation and to gain insight into the effects of different intensities of treadmill exercise on cancer cachexia symptoms.
Materials and Methods
Experimental animals and exercise protocol
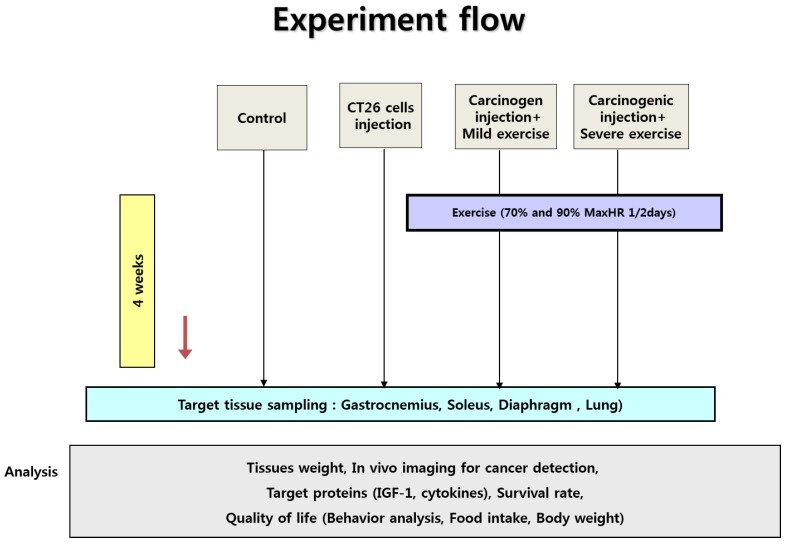
Forty male CDF1 mice weighing 18-20 g at four weeks of age were purchased from the Central Animal Laboratory (Seoul, Korea) and randomly divided into a non-cancer control group (N=10, NC), cancer control group (N=10, CC), cancer with moderate exercise group (N=10, ME), and cancer with intense exercise group (N=10, SE) (Fig. 1). All animals were supplied with standard chow and water ad libitum. They were housed in a sterile room at 22-24 °C with a 12:12 h light-dark cycle. For treadmill exercise, a protocol modified from Zogaib 10 was used. The mice ran on a motorized treadmill (45 min with 0° slope) once every 2 days. Moderate-intensity exercise was conducted at 0.5 km/h (70% maxHR) for the ME group and 1.0 km/h (90% maxHR) for the SE group 10.
Figure 1.
Experiment design. Ten male mice were randomly divided into non-cancer control group (NC), cancer control group (CC), cancer with moderate exercise group (ME), and cancer with intense exercise group (SE). Mice in ME and SE ran at 0.5 km/h (70% maxHR) and 1.0 km/h (90% max HR), respectively. After the end of the experiments (4th week), all mice (except the mice dead in advance) were sacrificed under anesthesia.
Animals were sacrificed at the end of experiments (4th wk) by exsanguination during anesthesia induced by a mixture of tiletamine, zolazepam, and xylazine (40 mg/kg body mass). On daily basis, the health of the animals was monitored. Five (CC) and two (ME) mice were died before the end of experiments.
Animal use and maintenance protocols were approved by the Seoul National University Bundang Hospital Institutional Animal Care and Use Committee (BA-1506-178/040-01). The evaluation criteria were: 1. The rationale and purpose of the proposed use of animals. 2. Justification of species and number of animals requested. 3. Unnecessary duplication of tests or experiments. 4. Availability or appropriateness of the use of less-invasive procedures. 5. Adequacy of training and experience of personnel. 6. Conducting multiple major surgical procedures. 7. Unusual housing and husbandry requirements. 8. Appropriate sedation, analgesia, and anesthesia. 9. Method of euthanasia or disposition of animal. 10. Criteria and process for timely intervention, removal, or euthanasia if required. 11. Safety of working environment for personnel.
Cell culture
The mouse colon carcinoma cell line-derived CT 26 was purchased from the Korea Cell Line Bank (Cat. No. 80009, Seoul, Korea) and cells were cultured in Dulbecco's Modified Eagle Medium (DMEM) supplemented with 10% fetal bovine serum (FBS), 100 IU/mL penicillin, and 100 mg/mL streptomycin in a 5% CO2/95% air humidified atmosphere 11. CT 26 cells were passaged every 3-4 days and diluted to 1.5 × 10⁵ cells per well (90 mm size in diameter) when the cells became confluent.
Cancer cell metastasis
Harvested CT 26 cells (1 × 10⁵ per mouse) were injected into each mouse via the tail vein. Mice were then returned to individual cages. Cancer cell-injected mice were periodically examined with an in vivo imaging system (Lumina II, Caliper Life Sci., N.E., U.S.), and lung cancers had metastasized on the 29th day (the endpoint of experiments) after injection 2, 12 (Fig. 2).
Figure 2.
In vivo imaging of cancer metastasis in mice. Metastasis of the injected CT 26 cells was verified by an in vivo imaging system as described in Materials and Methods.
Tissue to body weight ratio
The body weight of each mouse was recorded daily. The lung tissue, diaphragm, gastrocnemius muscle, and soleus muscle were isolated at the end of the study and the tissue to body weight ratios were calculated to obtain the change in absolute value of each tissue between groups.
Quality of life indicators: Behavior test, food intake, and body weight change
We designed behavior tests to assess quality of life (QoL). The behavior test included step counts and average walking speed while a mouse moved 60 cm within a 3 dimensional transparent box (Fig. 3, Fig. S1).
Figure 3.
Behavior test used in the mouse cancer model. To measure QoL in our animal cancer model, the behavior test was used since physical activity is also a standard for QoL. Mice walked in a transparent tunnel (Length × width = 200 × 20 cm) while a CCD camera recorded the mouse to analyze the average walking speed and number of footsteps.
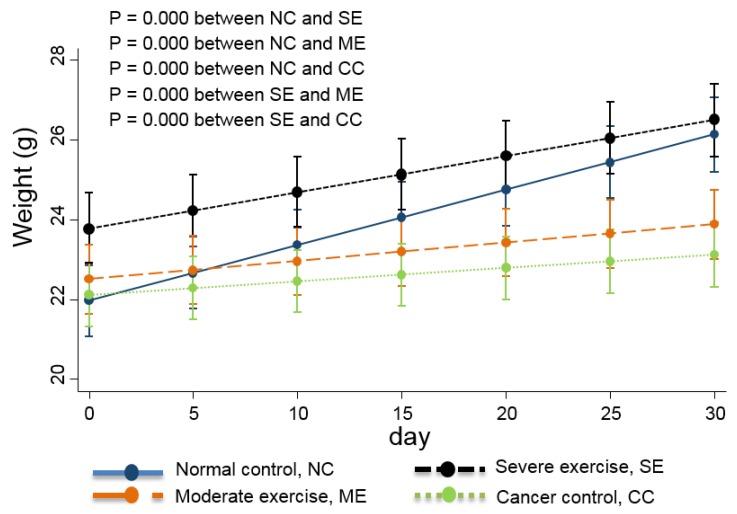
Food intake is also usually used as a QoL indicator 13 so the daily quantity consumed was monitored. Daily body weight changes were also recorded and are shown in Fig. 4.
Figure 4.
Weight changes in the animal cancer model. As a QoL indicator, weight change was also tracked. The linear-mixed model with an interaction of days and groups was used for statistical analysis and all groups were statistically different from each other, except CC and ME (p<0.01).
Measuring IGF-1, IL-6, and TNF-alpha levels
Protein levels of IGF-1 were detected by a multiplex ELISA array (Mouse/Rat IGF-1 Quantikine #MG100, R&D systems, M.N., U.S.). Levels of IL-6 (Mouse IL-6 Quantikine #LXSAMSM, R&D systems, M.N., U.S.) and TNF-alpha (Mouse TNF-alpha Quantikine #LXSAMSM, R&D systems, M.N., U.S.) in plasma were measured by ELISA. Blood samples were collected from mice via the cardiac ventricle and heparin serum plasma was stored at -80 °C until analysis 14-16.
Statistical analysis
All data are presented as the mean ± standard deviation (S.D.). The NC, CC, ME, and SE groups were compared by Bonferroni analysis to determine significant differences in protein analysis, food intake, body weight, tissue weight, tissue weight to whole body weight ratios, and behavioral test results. We also used a linear mixed model to analyze differences in food intake and body weight (Figs. 4 and 5).
Figure 5.
Food intake analysis. Daily food intake during the 29-day experimental period was analyzed by a linear-mixed model. The interaction between days and groups was considered and all groups were significantly different from each other (p<0.01). The decreased food intake in each cancer group is shown compared to the NC group.
For survival analysis, we calculated the Kaplan-Meier survival rate followed by t-test for mutual verification (Fig. 6). SPSS Version 18.0 was used for all statistical analyses. A value of p<0.05 was considered to indicate a statistically significant difference in all analyses.
Figure 6.
Kaplan-Meier survival rate. High intensity treadmill exercise (90% maximal HR) in relation to moderate intensity treadmill exercise (70% maximal HR) reduces mortality rate and the SE group showed a similar survival rate to the NC group. Survival was 100% for NC and SE groups, and survival was 80% and 50% for ME and CC groups, respectively. Kaplan Meier survival analysis showed significant differences (p<0.01) and the significant differences between NC and CC (p<0.05) and between SE and CC (p<0.05) were verified by t-test. *p<0.05 indicates significant difference.
Results
Tissue weight
Four tissues (lung, diaphragm, gastrocnemius muscle, and soleus muscle) were obtained at the end of experiments for each group. Cancer cells metastasized; the average lung weight of CC group mice was almost 87% greater than lungs from NC mice (Table 1). The maximum lung tissue weight with tumor metastasis was about 1.33 g.
Table 1.
Tissue weight and the ratio to body weight.
| Lung | Diaphragm | Gastrocnemius | Soleus | |||||
|---|---|---|---|---|---|---|---|---|
| Tissue weight (g) | Ratio to weight | Tissue weight (g) | Ratio to weight | Tissue weight (g) | Ratio to weight | Tissue weight (g) | Ratio to weight | |
| Normal control | 151. 67 ± 15.87 | 6.10 ± 0.66 | 75.18 ± 6.92▣▣ | 3.02 ± 0.29 | 108.15 ± 7.07 | 4.35 ± 0.27 | 6.10 ± 0.58▣▣ | 0.24 ± 0.03 |
| Cancer control | 284.24 ± 284.48 | 15.77 ± 18.58 | 69.30 ± 12.21▣▣ | 3.60 ± 1.12 | 79.87 ± 9.20▨▨♀♀ | 4.13 ± 0.96 | 4.62 ± 0.67▣▣♀♀ | 0.24 ± 0.05 |
| Moderate exercise | 240.49 ± 220.37 | 12.43 ± 17.14 | 78.41 ± 16.28 | 3.52 ± 1.24 | 106.46 ± 22.75▨▨◑ | 4.64 ± 1.03 | 5.03 ± 0.76◑◑ | 0.22 ± 0.05 |
| Severe exercise | 152.15 ± 14.10 | 5.80 ± 0.37 | 88.62 ± 9.06 | 3.39 ± 0.37 | 124.35 ± 8.40♀♀◑ | 4.75 ± 0.34 | 6.95 ± 1.40♀♀◑◑ | 0.26 ± 0.05 |
N = 10 for each group. Values are means ± S.D. Gastrocnemius = Gastrocnemius muscle, Soleus = Soleus muscle, Moderate exercise = Cancer with moderate exercise, Severe exercise = Cancer with severe exercise. ▣▣P<0.01: statistical significances between Normal control and Cancer control, ▨▨P<0.01: statistical significances between Cancer control and Moderate exercise, ♀♀P<0.01: statistical significances between Cancer control and Severe exercise, and ◑P<0.05, ◑◑P<0.01: statistical significances between Moderate exercise and Severe exercise.
Lung tissue weight from the ME group was about 59% greater than lung weight from NC group mice, and there was no significant difference between lung weights of SE and NC group mice. Tissue weight to body weight ratios showed the same pattern as tissue weight alone. However, there was no statistical difference in lung weight.
For diaphragm tissue weight, there was a significant difference between CC and SE groups (p<0.01). Diaphragms were the heaviest in the SE group. NC and ME group diaphragms were similar and CC group diaphragms showed the lowest weight. Gastrocnemius and soleus muscles showed a similar pattern; they were most atrophied in the CC group, moderately atrophied in the ME group, but hypertrophied and maintained in the SE group compared to the NC group (p<0.05, p<0.01).
Quality of life indicators: Behavior test, food intake, and body weight changes
Behavioral test results were analyzed by Bonferroni analysis as shown in Table 2.
Table 2.
Behavioral test.
| Distance (cm) | Right forelimb steps | Left forelimb steps | Right hindlimb steps | Left hindlimb steps | Total steps | Average speed (cm/sec) | |
|---|---|---|---|---|---|---|---|
| Normal control | 60 | 12. 17 ± 3.78 | 12.82 ± 3.50 | 12.28 ±3.70 | 13.08 ± 4.40 | 51.46 ± 16.64 | 12.10 ± 6.93 |
| Cancer control | 60 | 13.24 ± 2.82 | 14.09 ± 2.71* | 11.57 ± 1.69 | 11.57 ± 1.61 | 51.75 ± 6.86 | 7.17 ± 3.09 |
| Moderate exercise | 60 | 10.43 ± 1.57 | 10.29 ± 1.19* | 10.07 ± 0.84 | 10.21 ± 1.00 | 42.67 ± 4.73 | 12.05 ± 7.03 |
| Severe exercise | 60 | 10.97 ± 1.92 | 11.33 ± 1.59 | 11.00 ± 2.25 | 11.25 ± 1.74 | 44.55 ± 7.24 | 15.19 ± 7.76 |
N = 10 for each group. Values are means ± S.D., *P<0.05 indicates significant differences compared to the normal control.
Only left forelimb step count showed a significant difference between CC and ME groups (p<0.05). Analysis of average walk speed showed that mice in the CC group were the slowest among the four groups. Mice in NC and ME groups had similar average walking speeds and mice in the SE group walked with the highest speed among the four groups.
Linear-mixed analysis indicated that mice in the SE group had similar food intake to the NC group mice. ME group mice had moderate food intake quantity, and mice in the CC group had the lowest food intake (p<0.01)
Linear-mixed model analysis indicates that the degree of body weight decline was greatest in CC group mice, moderate in ME group mice, and SE group mice had similar body weights to NC group mice (p<0.01) (Fig. 4).
Survival rate
The overall survival rates were 50% and 80% for CC and ME, respectively. The survival rate for NC and SE groups were 100%. Kaplan-Meier survival analysis indicated that there are significant differences (p<0.01) and we found that there are significant differences between NC and CC (p<0.05) and between SE and CC (p<0.05) by using t-test. Survival curves are shown in Fig. 6.
Muscular homeostasis and cytokine-related proteins
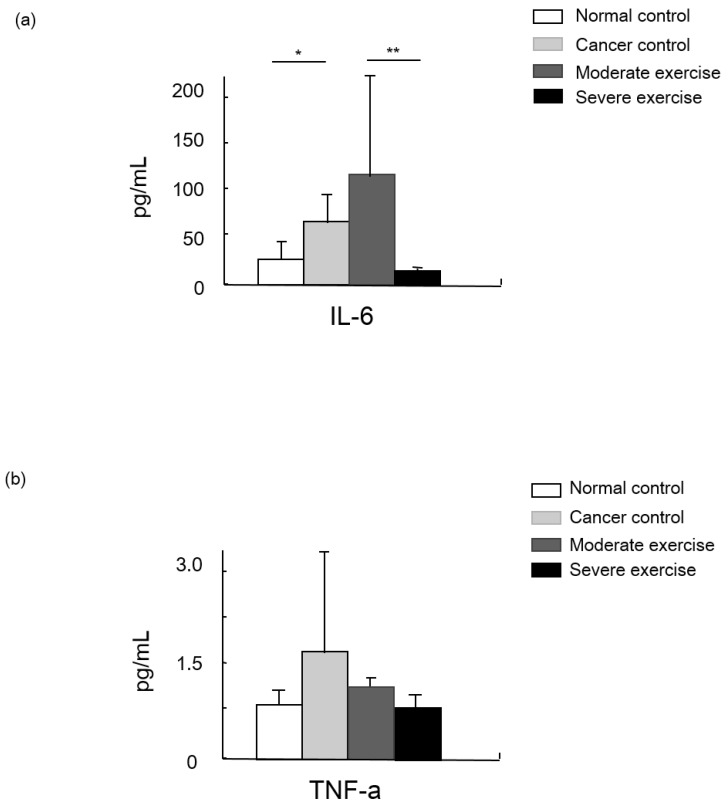
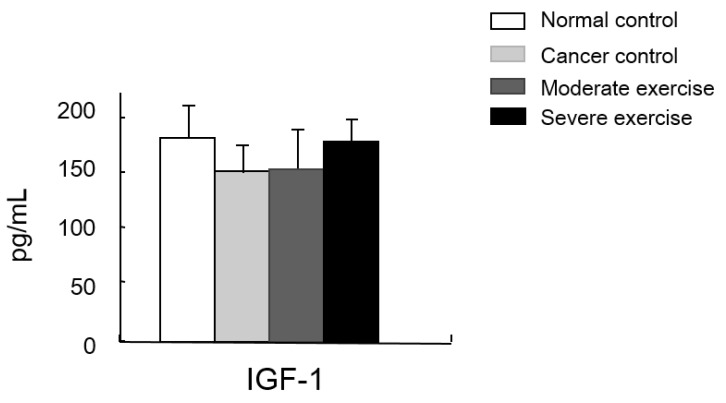
IGF-1 was measured as a muscle mass mediating factor and cytokines IL-6 and TNF-alpha were measured as indicators of immune function (Figs. 7 and 8).
Figure 7.
Cytokine levels in animal cancer model. Levels of IL-6 (a) and TNF-alpha (b) were measured from the sera of experimental mice.
Figure 8.
Muscle homeostasis regulatory protein IGF-1 levels in serum. IGF-1 levels in plasma was measured. There was no significant difference among group, however, there was a pattern shown that IGF-1 levels from the least to greatest were found in mice from the CC group, the ME group, and levels were similar in mice from SE and NC group.
Levels of the cytokine TNF-alpha were highest in CC group mice, moderate in ME mice, and SE mice showed a similar level to NC. Levels of another cytokine, IL-6, were significantly different between NC and CC, and between ME and SE (p<0.05, and p<0.01, respectively).
We also measured a factor regulating muscle mass, IGF-1. Levels of IGF-1 were similar between SE and NC groups. Mice in the CC group had the lowest IGF-1 levels and mice in the ME group had a moderate level, although the difference between these groups was not significant (Fig. 8).
Discussion
We observed that the lung weight of CC group mice was almost 87% greater than lungs of NC group mice. Moderate exercise showed a modest benefit on survival while intense exercise showed a greater benefit. Other results such as tissue and body weight changes, QoL indicators, and protein analyses also supported our hypothesis that intense exercise positively affects cancer cachexia symptoms greater than moderate exercise or the no-exercise cancer control (p<0.05 and p<0.01 respectively). Thus, treadmill exercise, especially with severe intensity, could positively affect QoL, survival rate, muscle mass maintenance, and levels of cytokines and IGF-1 in a model of cancer cachexia.
Effective exercise type and intensity for alleviating cancer cachexia
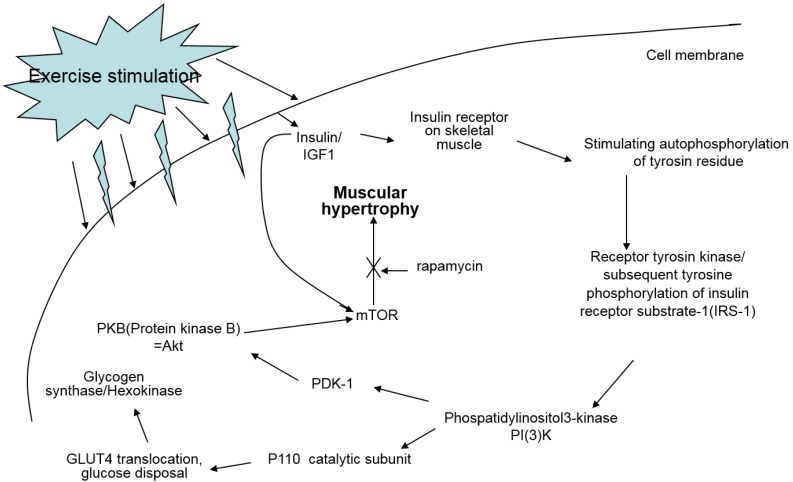
Oxidative exercise increases oxidative capacity upon oxidative metabolic adaptation and promotes maintenance of muscle mass. Resistance training is usually known to cause muscle hypertrophy. Resistance training stimulates the complex Akt/mTOR signaling cascade, however, resistance training in cancer patients does not prevent muscle atrophy via the same signaling pathway because this pathway is not affected or is even already hyperactivated in cancer 7 (Fig. 9).
Figure 9.
Signal pathway of IGF-1 by exercise. IGF-1 measured in this study is known to be a major factor positively affecting muscle hypertrophy; however, treadmill exercise did not change the quantity of IGF-1 in the sera of the experiment mice.
The exercise program in this study included different intensities of endurance exercise because resistance training does not always play a role in the anti-catabolic process in muscles during cancer cachexia 7. Consequently, we examined if exercise intensity can elicit positive effects on symptoms of cancer cachexia.
One of the main drawbacks of endurance training is anemia 7. However, animals used in this study showed no indication of anemia because intense exercise at 90% maxHR was able to be performed for 45 min during each set of exercise.
The effect of prehabilitation on cancer cachexia
Exercise capacity is gradually decreased as cancer metastasis occurs and muscle cachexia is subsequently induced 17.
We attempted to prevent cancer cachexia-induced decreases in exercise capacity by initiating a treadmill exercise regimen before muscle atrophy occurred. This preventative treatment is known as prehabilitation. The results from this study indicate that most parameters analyzed to represent cancer cachexia symptoms were affected according to the degree of exercise intensity. Severe intensity treadmill exercise resulted in favorable QoL indices, high survival rate, and prevention or delay of muscle atrophy. The different lung weights between groups indicate that cancer cells successfully metastasized. In vivo imaging also confirmed the metastasis (Fig. 2). Hypertrophied diaphragms were observed between CC and SE (p<0.01). The diaphragm, which directly functions for respiration, is divided into the lumbar part that originates in the sternum, the rib part, and the lower rib part. Treadmill exercises at 90% maxHR for 45 min require severe extension and contraction of the diaphragm, which induces hypertrophy of this muscle that is susceptible to cancer cachexia. This suggests that the degree of muscular hypertrophy has a linear relationship with the volume and intensity of exercise, and intense exercise can prevent the loss of respiratory muscle function that leads to hypostatic pneumonia which is a factor responsible for death in 48% of cancer patients 18.
QoL parameters
Body weight changes, food intake, and behavior tests were conducted to assess QoL in our cancer cachexia model. Previous cancer cachexia studies showed that body weight changes and food intake were valid parameters for QoL 7, 19, however, we also added a behavior test in this study. In the behavior test, analysis of average walking speed showed that SE mice had a similar speed to NC mice, and speed was decreased in ME and CC mice. This suggests that active movement reflects animals' state of health (Table 2).
Linear-mixed model analysis showed the same pattern in body weight and food intake; that exercise intensity is linearly related with QoL parameters (p<0.01).
Cytokine-related proteins
Cytokines such as IL-6 and TNF-alpha are secreted by cancer cells to modulate the immune system. Those cytokines stimulate neurons, bone marrow cells, adipocytes, and endothelial cells to release signaling molecules as a complex biological response in cancer cachexia. TNF-alpha, the most relevant molecule for cancer cachexia, is able to increase the expression of apoptosis-related genes via the NF-kappaB signaling pathway, and IL-6 possibly enhances proteolysis 20. Hojiman et al reported that during voluntary running, rats release adrenaline that stimulates IL-6-carrying NK cells (leukocytes) to cancer cells, which inhibits metastasis 21. In our results, IL-6 levels in the SE group were about 41% and 89% lower than those in the NC and ME groups, respectively (p<0.01), which possibly represses cancer growth.
TNF-alpha, which is also involved in insulin resistance, regulates the activity of cytokines to mediate lipolysis, which may have a synergistic effect on catabolism. However, our results showed that TNF-alpha levels from least to greatest were found in CC mice, ME mice, and then SE and NC mice that had similar levels 6.
Muscle homeostasis regulatory proteins
A study reported that lower IGF-1 levels appear to be effective for alleviating spontaneous activity, food intake, body weight, muscle mass loss, and survival rate in cancer cachexia 13. We suggested that IGF-1 levels would be influenced by different intensities of treadmill exercise in our cancer cachexia animal model. Although there were no significant differences between groups, our results showed a similar pattern seen for the other parameters measured, that the highest IGF-1 levels were seen in SE and NC groups, followed by the ME group and CC group (Fig. 8). This suggests that various muscle regulatory factors may be involved in inducing muscular hypertrophy (Fig. 9) 22, 23.
Conclusion
Our results suggest that metabolic changes resulting from 90% maxHR exercise should be simulated by developing an exercise modality with an identical impact, since it is difficult to apply preclinical trial data to clinical tests such as treadmill exercises at 90% maxHR in cancer patients.
Our results also suggest that intense exercise has positive effects on various cancer cachexia symptoms assessed in this study, such as body weight changes and survival rate when exercise and cancer metastasis are simultaneously applied in a state of precachexia. To produce the maximal effect, an exercise-oriented lifestyle is optimal for cancer cachexia prehabilitation, not just palliatively for a brief cure.
Supplementary Material
S1, Behavior test as a QoL indicator. We designed the behavior test to measure animal quality of life.
Acknowledgments
We appreciate Ms. Jung Hyo Ju's kind assistance during experiments. This study was supported by a grant from Seoul National University Bundang Hospital Research Fund (no. 13-2015-011) and partially supported by the Ministry of Education of the Republic of Korea and the National Research Foundation of Korea (NRF-2015S1A5B8036349).
References
- 1.Myrianthefs PM, Batistaki C. Cancer cachexia and immunomodulation. Journal of BUON: official journal of the Balkan Union of Oncology. 2005;10:181–8. [PubMed] [Google Scholar]
- 2.Choi E, Carruthers K, Zhang L, Thomas N, Battaglino RA, Morse LR. et al. Concurrent muscle and bone deterioration in a murine model of cancer cachexia. Physiological reports. 2013;1:e00144. doi: 10.1002/phy2.144. [DOI] [PMC free article] [PubMed] [Google Scholar]
- 3.Argiles JM, Lopez-Soriano FJ, Toledo M, Betancourt A, Serpe R, Busquets S. The cachexia score (CASCO): a new tool for staging cachectic cancer patients. Journal of cachexia, sarcopenia and muscle. 2011;2:87–93. doi: 10.1007/s13539-011-0027-5. [DOI] [PMC free article] [PubMed] [Google Scholar]
- 4.Johns N, Hatakeyama S, Stephens NA, Degen M, Degen S, Frieauff W. et al. Clinical classification of cancer cachexia: phenotypic correlates in human skeletal muscle. PloS one. 2014;9:e83618. doi: 10.1371/journal.pone.0083618. [DOI] [PMC free article] [PubMed] [Google Scholar]
- 5.Fearon KC, Glass DJ, Guttridge DC. Cancer cachexia: mediators, signaling, and metabolic pathways. Cell metabolism. 2012;16:153–66. doi: 10.1016/j.cmet.2012.06.011. [DOI] [PubMed] [Google Scholar]
- 6.Gould DW, Lahart I, Carmichael AR, Koutedakis Y, Metsios GS. Cancer cachexia prevention via physical exercise: molecular mechanisms. Journal of cachexia, sarcopenia and muscle. 2013;4:111–24. doi: 10.1007/s13539-012-0096-0. [DOI] [PMC free article] [PubMed] [Google Scholar]
- 7.Argiles JM, Busquets S, Lopez-Soriano FJ, Costelli P, Penna F. Are there any benefits of exercise training in cancer cachexia? Journal of cachexia, sarcopenia and muscle. 2012;3:73–6. doi: 10.1007/s13539-012-0067-5. [DOI] [PMC free article] [PubMed] [Google Scholar]
- 8.Le Roy B, Selvy M, Slim K. The concept of prehabilitation: What the surgeon needs to know? Journal of visceral surgery; 2016. [DOI] [PubMed] [Google Scholar]
- 9.Amedro P, Picot MC, Moniotte S, Dorka R, Bertet H, Guillaumont S. et al. Correlation between cardio-pulmonary exercise test variables and health-related quality of life among children with congenital heart diseases. International journal of cardiology. 2016;203:1052–60. doi: 10.1016/j.ijcard.2015.11.028. [DOI] [PubMed] [Google Scholar]
- 10.Zogaib FG, Monte-Alto-Costa A. Moderate intensity physical training accelerates healing of full-thickness wounds in mice. Brazilian journal of medical and biological research = Revista brasileira de pesquisas medicas e biologicas / Sociedade Brasileira de Biofisica [et al] 2011;44:1025–35. doi: 10.1590/s0100-879x2011007500115. [DOI] [PubMed] [Google Scholar]
- 11.Maeng HJ, Kim ES, Chough C, Joung M, Lim JW, Shim CK. et al. Addition of amino acid moieties to lapatinib increases the anti-cancer effect via amino acid transporters. Biopharmaceutics & drug disposition. 2014;35:60–9. doi: 10.1002/bdd.1872. [DOI] [PubMed] [Google Scholar]
- 12.Yang R, Shim WS, Cui FD, Cheng G, Han X, Jin QR. et al. Enhanced electrostatic interaction between chitosan-modified PLGA nanoparticle and tumor. International journal of pharmaceutics. 2009;371:142–7. doi: 10.1016/j.ijpharm.2008.12.007. [DOI] [PubMed] [Google Scholar]
- 13.Schmidt K, von Haehling S, Doehner W, Palus S, Anker SD, Springer J. IGF-1 treatment reduces weight loss and improves outcome in a rat model of cancer cachexia. Journal of cachexia, sarcopenia and muscle. 2011;2:105–9. doi: 10.1007/s13539-011-0029-3. [DOI] [PMC free article] [PubMed] [Google Scholar]
- 14.Kaminski RW, Clarkson K, Kordis AA, Oaks EV. Multiplexed immunoassay to assess Shigella-specific antibody responses. Journal of immunological methods. 2013;393:18–29. doi: 10.1016/j.jim.2013.04.002. [DOI] [PubMed] [Google Scholar]
- 15.Keustermans GC, Hoeks SB, Meerding JM, Prakken BJ, de Jager W. Cytokine assays: an assessment of the preparation and treatment of blood and tissue samples. Methods. 2013;61:10–7. doi: 10.1016/j.ymeth.2013.04.005. [DOI] [PubMed] [Google Scholar]
- 16.Chacon-Cabrera A, Fermoselle C, Urtreger AJ, Mateu-Jimenez M, Diament MJ, de Kier Joffe ED. et al. Pharmacological strategies in lung cancer-induced cachexia: effects on muscle proteolysis, autophagy, structure, and weakness. Journal of cellular physiology. 2014;229:1660–72. doi: 10.1002/jcp.24611. [DOI] [PubMed] [Google Scholar]
- 17.Op den Kamp CM, Langen RC, Minnaard R, Kelders MC, Snepvangers FJ, Hesselink MK. et al. Pre-cachexia in patients with stages I-III non-small cell lung cancer: systemic inflammation and functional impairment without activation of skeletal muscle ubiquitin proteasome system. Lung Cancer. 2012;76:112–7. doi: 10.1016/j.lungcan.2011.09.012. [DOI] [PubMed] [Google Scholar]
- 18.Windsor JA, Hill GL. Risk factors for postoperative pneumonia. The importance of protein depletion. Annals of surgery. 1988;208:209–14. doi: 10.1097/00000658-198808000-00013. [DOI] [PMC free article] [PubMed] [Google Scholar]
- 19.Busquets S, Almendro V, Barreiro E, Figueras M, Argiles JM, Lopez-Soriano FJ. Activation of UCPs gene expression in skeletal muscle can be independent on both circulating fatty acids and food intake. Involvement of ROS in a model of mouse cancer cachexia. FEBS letters. 2005;579:717–22. doi: 10.1016/j.febslet.2004.12.050. [DOI] [PubMed] [Google Scholar]
- 20.Argiles JM, Busquets S, Felipe A, Lopez-Soriano FJ. Muscle wasting in cancer and ageing: cachexia versus sarcopenia. Advances in gerontology = Uspekhi gerontologii / Rossiiskaia akademiia nauk, Gerontologicheskoe obshchestvo. 2006;18:39–54. [PubMed] [Google Scholar]
- 21.Pedersen L, Idorn M, Olofsson GH, Lauenborg B, Nookaew I, Hansen RH, Voluntary Running Suppresses Tumor Growth through Epinephrine- and IL-6-Dependent NK Cell Mobilization and Redistribution. Cell metabolism; 2016. [DOI] [PubMed] [Google Scholar]
- 22.Kimball SR, Farrell PA, Jefferson LS. Invited Review: Role of insulin in translational control of protein synthesis in skeletal muscle by amino acids or exercise. J Appl Physiol (1985) 2002;93:1168–80. doi: 10.1152/japplphysiol.00221.2002. [DOI] [PubMed] [Google Scholar]
- 23.Christ-Roberts CY, Pratipanawatr T, Pratipanawatr W, Berria R, Belfort R, Kashyap S. et al. Exercise training increases glycogen synthase activity and GLUT4 expression but not insulin signaling in overweight nondiabetic and type 2 diabetic subjects. Metabolism: clinical and experimental. 2004;53:1233–42. doi: 10.1016/j.metabol.2004.03.022. [DOI] [PubMed] [Google Scholar]
Associated Data
This section collects any data citations, data availability statements, or supplementary materials included in this article.
Supplementary Materials
S1, Behavior test as a QoL indicator. We designed the behavior test to measure animal quality of life.


