Significance
With-no-lysine (K) 1 (WNK1) is widely expressed, yet little is known about its actions beyond its well-studied regulation of ion transport proteins. We find that WNK1 suppresses autophagy in multiple cell types, indicative of WNK1 actions outside of ion transport. Because autophagy is a complex cellular pathway with many regulatory inputs, identifying steps influenced by WNK1 may also be of value to better understand how autophagy is controlled. Our results show a connection between WNK1 and regulation of PI3KC3 that may have implications for other processes mediated by products of this lipid kinase complex. This study demonstrates a function of WNK1 as a regulator of autophagy.
Keywords: UVRAG, ULK1, Vps34, SPAK, PI3KC3
Abstract
The with-no-lysine (K) (WNK) kinases are an atypical family of protein kinases that regulate ion transport across cell membranes. Mutations that result in their overexpression cause hypertension-related disorders in humans. Of the four mammalian WNKs, only WNK1 is expressed throughout the body. We report that WNK1 inhibits autophagy, an intracellular degradation pathway implicated in several human diseases. Using small-interfering RNA-mediated WNK1 knockdown, we show autophagosome formation and autophagic flux are accelerated. In cells with reduced WNK1, basal and starvation-induced autophagy is increased. We also show that depletion of WNK1 stimulates focal class III phosphatidylinositol 3-kinase complex (PI3KC3) activity, which is required to induce autophagy. Depletion of WNK1 increases the expression of the PI3KC3 upstream regulator unc-51–like kinase 1 (ULK1), its phosphorylation, and activation of the kinase upstream of ULK1, the AMP-activated protein kinase. In addition, we show that the N-terminal region of WNK1 binds to the UV radiation resistance-associated gene (UVRAG) in vitro and WNK1 partially colocalizes with UVRAG, a component of a PI3KC3 complex. This colocalization decreases upon starvation of cells. Depletion of the SPS/STE20-related proline-alanine–rich kinase, a WNK1-activated enzyme, also induces autophagy in nutrient-replete or -starved conditions, but depletion of the related kinase and WNK1 substrate, oxidative stress responsive 1, does not. These results indicate that WNK1 inhibits autophagy by multiple mechanisms.
The with-no-lysine (K) (WNK) protein kinase family is an evolutionarily conserved, atypical group of serine/threonine kinases with the conserved ATP-binding lysine residue shifted to a different position within the kinase domain (1, 2). WNKs are the only kinases in the eukaryotic protein kinase superfamily with this unusual arrangement. This arrangement confers on them unique structural and functional properties (3). There are four WNK proteins in mammals, of which WNK1 is the largest, over 2,000 residues, and most widely expressed (4).
The best-characterized function of WNKs is their binding and activation of downstream target kinases, oxidative stress responsive 1 (OSR1) and SPS/STE20-related proline-alanine–rich kinase (SPAK) (5–7). Once activated, OSR1 and SPAK phosphorylate and regulate downstream cation-chloride cotransporters of the SLC12 family (8–10). This WNK–SPAK/OSR1 pathway enables cells to adjust intracellular ions and cell volume in response to ion imbalances and osmotic stress (11). It is noteworthy that mutations in the regulatory components of the WNK pathway, including WNK1, WNK4, kelch-likes (KLHLs), and cullins, have been shown to cause increased expression of WNKs and ion reabsorption defects in kidney that lead to hypertension-related genetic diseases, such as Gordon’s syndrome (pseudohypoaldosteronism II) (12–16). In addition, WNKs have been linked to the regulation of cell proliferation (17, 18), cell death (19), cell migration (20–23), endocytosis (24–27), and angiogenesis (22, 28). They also impact multiple signal transduction pathways, including the ERK1/2 and ERK5 MAP kinase pathways (17, 29).
Autophagy is a process conserved throughout evolution that degrades intracellular materials to remove damaged and outdated components and to supply cells with nutrients and building blocks (30–33). Autophagy is induced by cellular stress and protects against infections by pathogens (34–40). Critical to maintain intracellular homeostasis, autophagy has roles in diseases, such as neurodegeneration (41, 42) and cancer (43, 44). In this study, we show that WNK1 is involved in regulating autophagy.
Results
WNK1 Depletion Increases Autophagy.
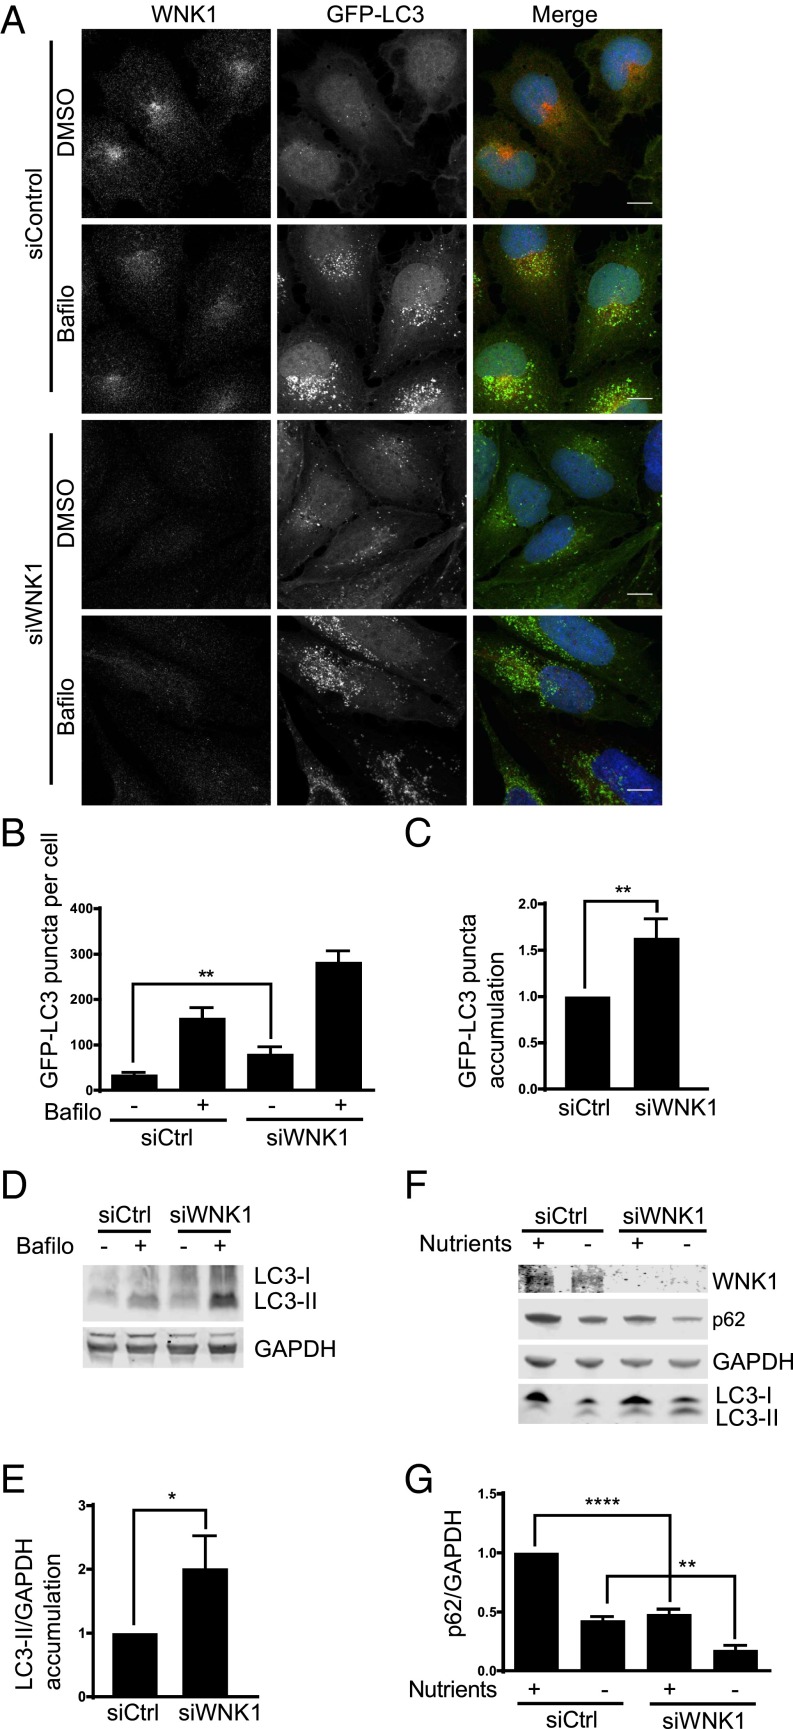
To analyze its role in autophagy, WNK1 was knocked down with small interfering RNA (siRNA) in U2OS cells stably expressing green fluorescent protein-tagged light chain 3 (GFP-LC3) (32, 45). WNK1 depletion increased the number of GFP-LC3 puncta (Fig. 1 A and B), showing that reducing the amount of WNK1 increased autophagosome formation. Bafilomycin, which inhibits autophagosome-lysosome fusion, increased the accumulation of GFP-LC3 puncta in WNK1-depleted cells (Fig. 1 A and C), indicating that the knockdown of WNK1 increased autophagic flux. The accumulation of LC3-II, a marker of autophagy (46), in bafilomycin-treated cells increased with WNK1 depletion (Fig. 1 D and E), consistent with the conclusion that reduced WNK1 expression accelerated autophagy.
Fig. 1.
WNK1 depletion increases autophagy. (A) U2OS GFP-LC3 cells were treated with 20 nM siControl or siWNK1 oligonucleotides. After 3 d, fresh medium was added containing DMSO or bafilomycin for 4 h. Cells were analyzed by immunofluorescence. The images were deconvoluted, opened in Imaris 8 (Bitplane), and were subjected to background subtraction (filter width, 26.6 μm). The DAPI channel was masked and output was generated for GFP channel to remove the nuclear GFP from the analysis. The puncta-size threshold was set at 0.3 μ and puncta was selected by adjusting the quality in the spots. Then, the puncta were automatically counted by the software. At least 40 cells were selected per condition in each experiment. (Scale bars, 12 μm.) (B) Quantitation of change in number of GFP-LC3 puncta per cell in A. (C) Quantitation of relative change in GFP-LC3 puncta in bafilomycin-treated cells in A. (D) WNK1 was knocked down in U2OS GFP-LC3 cells which were then treated with bafilomycin as in A. Immunoblots are shown. (E) Quantitation of relative change of LC3-II in bafilomycin-treated cells in D. (F) HeLa cells were treated with 20 nM siControl or siWNK1#2 for either 3 d or repeated after 2 d. Before lysis cells were incubated in medium without or with nutrients for 4 h. Proteins were analyzed by immunoblotting. (G) Quantitation of relative change of p62 in F. *P < 0.05, **P < 0.01, ****P < 0.0001.
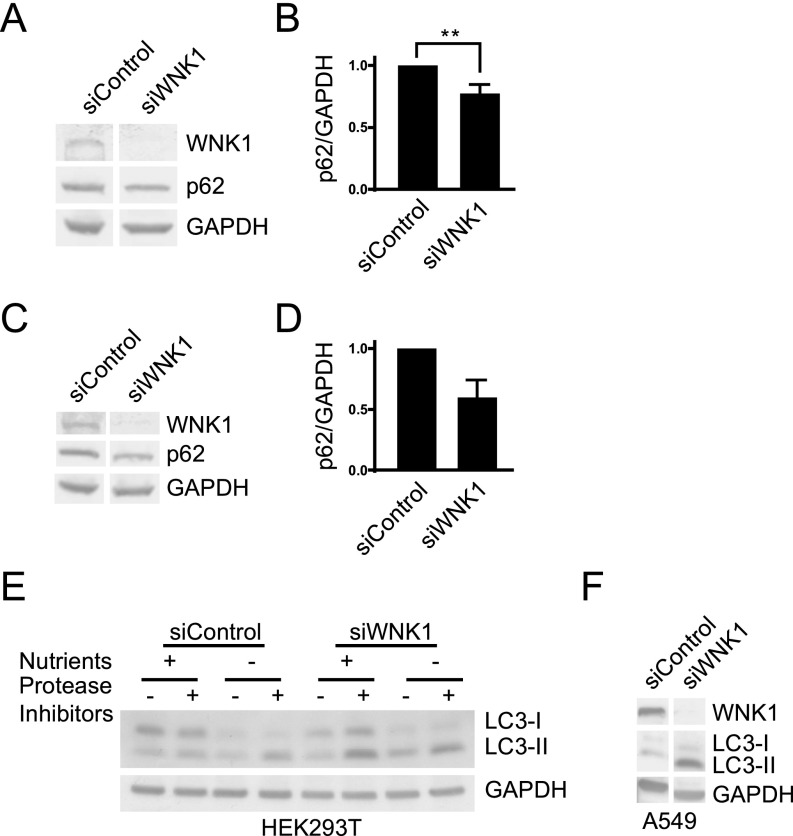
We depleted WNK1 from HeLa cells and found a decrease in the selective autophagy substrate p62 (SQSTM1) (47) and an increase in LC3-II in both nutrient-replete and nutrient-starved cells (Fig. 1 F and G). We found similar increases in autophagy following WNK1 knockdown using multiple siRNA oligonucleotides and also in HEK293T and A549 cells (Fig. S1 and Table S1). We conclude that WNK1 inhibits basal and starvation-induced autophagy in multiple systems.
Fig. S1.
WNK1 depletion increases autophagy in mutliple cell lines. (A) HeLa cells were treated with 20 nM siControl or siWNK1 #3 oligonucleotides. After 3 d, the medium was replaced with fresh medium for 4 h. Cells were then lysed and proteins analyzed by immunoblotting. (B) Quantitation of the relative change of p62 in A. **P < 0.01. (C) HeLa cells were treated with 20 nM siControl or siWNK1 #4 oligonucleotides. After 3 d, the medium was replaced with fresh medium for 4 h. Cells were lysed and proteins analyzed by immunoblotting. n = 2. (D) Quantitation of the relative change of p62 in C. (E) HEK293T cells were treated with 10 nM siControl or siWNK1 #2 oligonucleotides. After 3 d, cells were treated with E-64d/pepstatin A or DMSO for 4 h. Cells were then lysed in (150 mM NaCl, 10 mM Tris pH 7.4, 2 mM EDTA, 1 mM EGTA, 1% Triton X-100, and 0.5% Nonidet P-40 with 1% protease inhibitors), mixed with Laemmli sample buffer, and proteins were analyzed by immunoblotting. Secondary antibodies conjugated with horseradish peroxidase were used for blotting by enhanced chemiluminescence. Other WNK1 knockdown experiments in this cell line yielded similar results. (F) A549 cells were treated with 10 nM siControl or siWNK1#2 oligonucleotides. After 3 d, cells were lysed and proteins analyzed by immunoblotting as in E.
Table S1.
siRNA oligonucleotides for WNK1 knockdown
| siRNA Name | Type | Sequence (5′–3′) |
| siWNK1 | Silencer select custom | CAGACAGUGCAGUAUUCACtt |
| siWNK1 #2 | Silencer select custom | GGAUCAAGUGCGAGAAAUUtt |
| siWNK1 #3 | Silencer select validated (s35233) | |
| siWNK1 #4 | Silencer select validated (s35234) |
WNK1 Depletion Increases the Activity of PI3KC3.
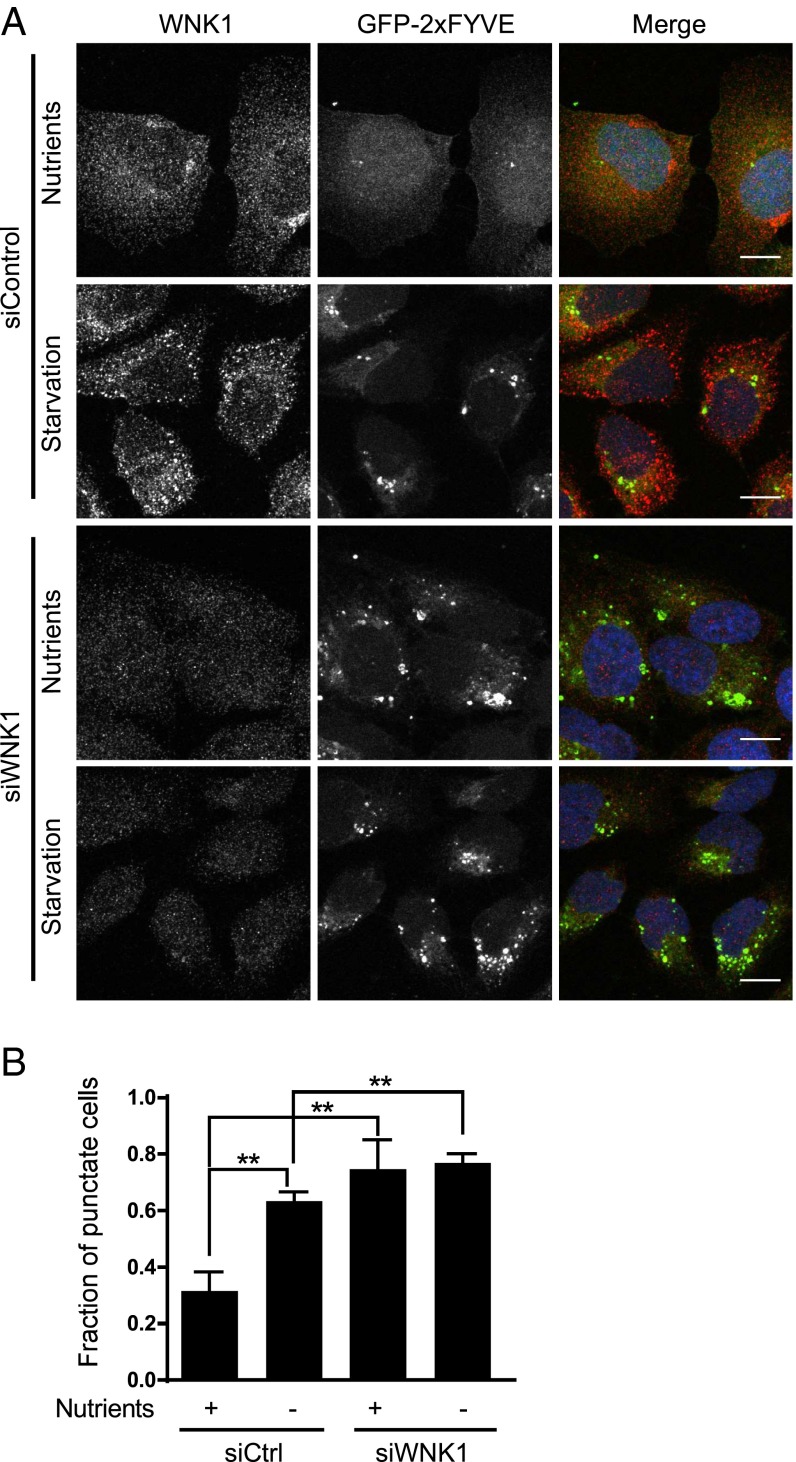
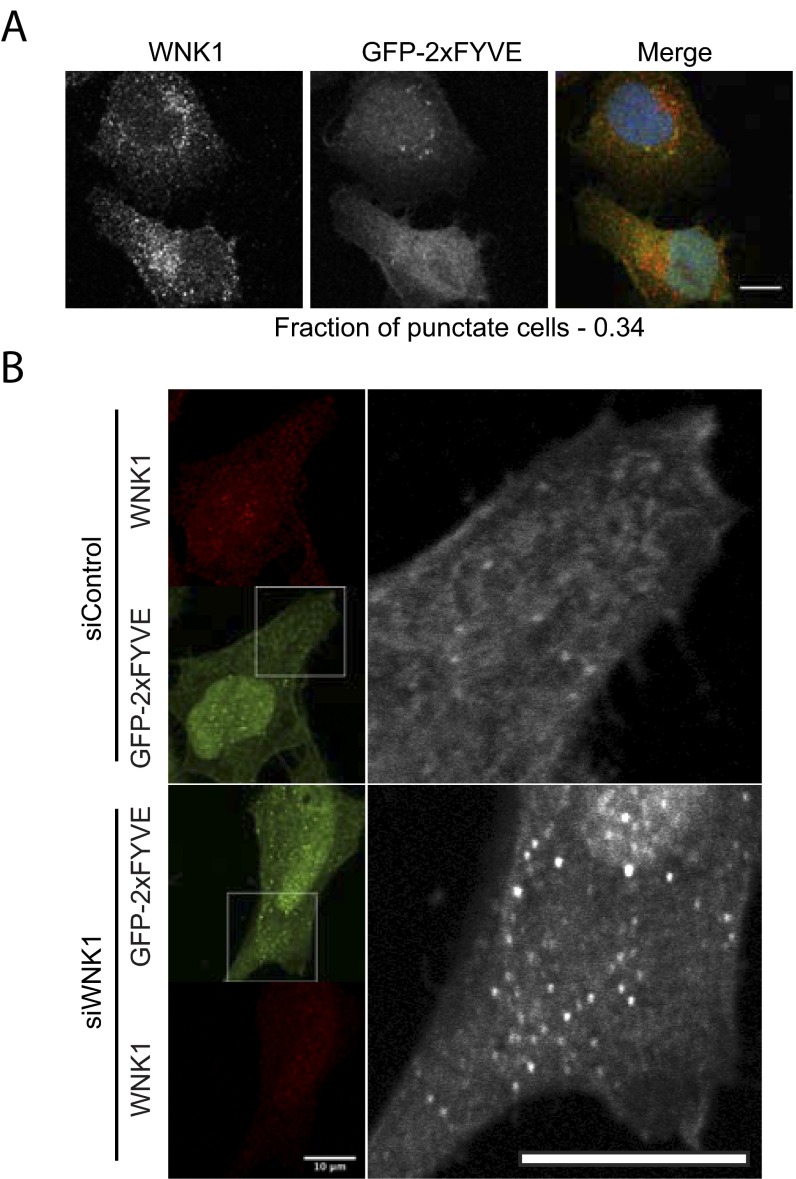
The class III phosphatidylinositol 3-kinase (PI3KC3) complex initiates autophagy upon activation (48, 49). The complex contains Vps34 as its catalytic subunit, which converts the cellular phosphatidylinositol (PI) to phosphatidylinositol 3-phosphate (PI3P) to assist in autophagosome formation. Because PI3P binds to FYVE domain-containing proteins, a localized increase in PI3KC3 activity will be detected as an increase in FYVE domain puncta (50). We expressed a GFP-2xFYVE domain construct in U2OS cells and validated its ability to detect PI3KC3 activity using starvation to induce autophagy. As expected, starvation increased the fraction of cells that displayed dominantly punctate GFP-2xFYVE staining (Fig. 2). Wortmannin, which inhibits PI3KC3 (51), converted the staining pattern from punctate to diffuse (Fig. S2A). Similar to starvation, depletion of WNK1 increased the fraction of cells in which GFP-2xFYVE staining was punctate, whether in nutrient-rich or nutrient-poor medium (Fig. 2). Similar effects of WNK1 depletion on PI3KC3 were also observed in HeLa cells (Fig. S2B). These data support the conclusion that WNK1 knockdown increases PI3KC3 complex activity.
Fig. 2.
WNK1 depletion increases the activity of PI3KC3. (A) WNK1 was knocked down with 20 nM siRNA in U2OS cells. After 1 d, the cells were transfected with a GFP-2xFYVE domain-expressing plasmid. After 2 d, cells were placed in normal or starvation medium containing DMSO (Fig. S2) for 4 h and then analyzed by immunofluorescence. The images were opened in Imaris 8 (deconvoluted) or ImageJ; images opened in Imaris 8 were subjected to background subtraction (filter width 26.6 μm). Cells were categorized as having obvious GFP-2xFYVE puncta or with diffuse GFP-2xFYVE expression. At least 100 cells were selected per condition in each experiment. (Scale bars, 12 μm.) (B) Quantitation of the fraction of GFP-2xFYVE punctate cells in A. **P < 0.01.
Fig. S2.
WNK1 depletion increases the activity of the PI3KC3 complex. (A) The experiment was performed as described in Fig. 2A in U2OS cells. Cells treated with wortmannin (150 nM) in starvation medium are shown in this figure. (Scale bar, 12 μm.) (B) WNK1 was knocked down by 20 nM siRNA from HeLa cells. The next day, the cells were transfected with a plasmid expressing a GFP-2xFYVE domain. After 2 more days, the medium was replaced by fresh medium for 4 h. Then the cells were analyzed by immunofluorescence on a Zeiss LSM 780. Images shown on the right are enlargements of boxed portions of images on the left. Images shown here are taken from the midplane of the Z stack. (Scale bars, 10 μm.)
WNK1 Depletion Increases the Amount and Phosphorylation of Unc-51–Like Kinase 1.
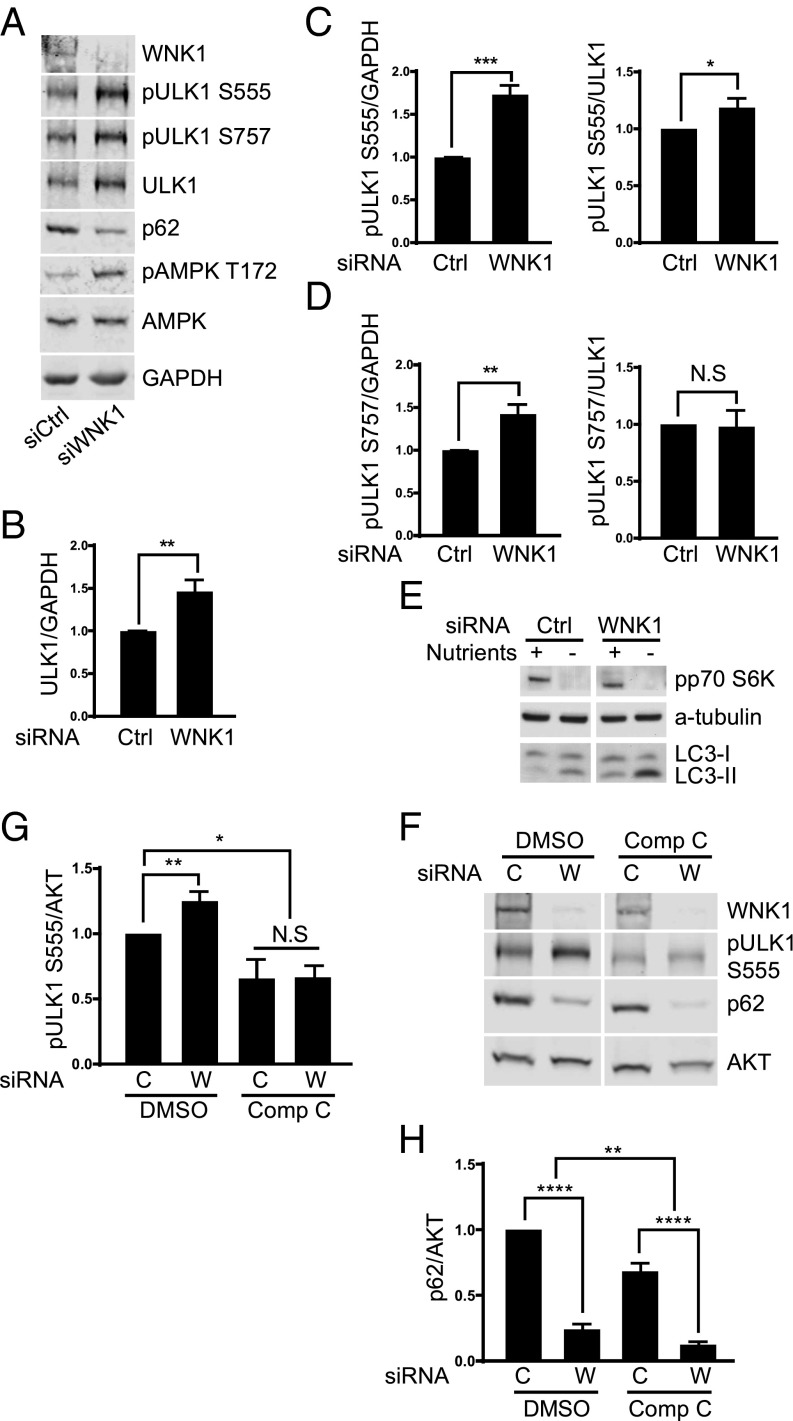
The initiation step of autophagy is catalyzed by the unc-51–like kinase 1 (ULK1) protein complex, which activates PI3KC3, thereby inducing autophagy (52, 53). ULK1 activity is controlled by the upstream kinases, the mammalian target of rapamycin complex 1 (mTORC1) and the AMP-activated protein kinase (AMPK) (54, 55). Phosphorylation of ULK1 by AMPK at S555 activates ULK1, whereas ULK1 phosphorylation by mTORC1 at S757 inhibits ULK1. Depletion of WNK1 increased the phosphorylation of S555 (pS555) as well as the total amount of ULK1, resulting in a net increase in the ratio of pS555 ULK1/ULK1 (Fig. 3 A–C). pS757 ULK1 also increased with WNK1 depletion; however, the ratio of pS757 ULK1/ULK1 did not change (Fig. 3 A and D).
Fig. 3.
WNK1 depletion increases the amount and phosphorylation of ULK1. (A) HeLa cells were treated with 20 nM siControl or siWNK1, plus an additional 20 nM siControl. After 3 d, cells were placed in fresh medium for 4 h, lysed, and proteins were analyzed by immunoblotting. (B) Quantitation of relative change of ULK1 expression in A. (C) Quantitation of relative change in total ULK1 pS555 and ULK1 pS555/total ULK1 in A. (D) Quantitation of relative changes in total ULK1 pS757 and ULK1 pS757/total ULK1 in A. (E) HeLa cells were treated with 10 nM siControl or siWNK1#2 for 3 d, placed in normal or starvation medium for 2 h, lysed (see Fig. S1E for lysis buffer) and proteins were analyzed by immunoblotting; secondary antibodies conjugated with horseradish peroxidase were detected by enhanced chemiluminescence. (F) WNK1 was knocked down by 20 nM siRNA in HeLa. After 3 d, cells were treated with DMSO (control) or 10 µM compound C for 4 h, lysed and proteins were analyzed by immunoblotting. (G) Quantitation of ULK1 pS555 relative change in E. (H) Quantitation of relative change in p62 in E, n = 4. Compound C decreased p62 in siControl, P < 0.0001 and with siWNK1, P < 0.01. Despite the fact that compound C inhibits AMPK, it has been shown previously to induce autophagy (73). *P < 0.05, **P < 0.01, ***P < 0.001, and ****P < 0.0001. NS, not significant.
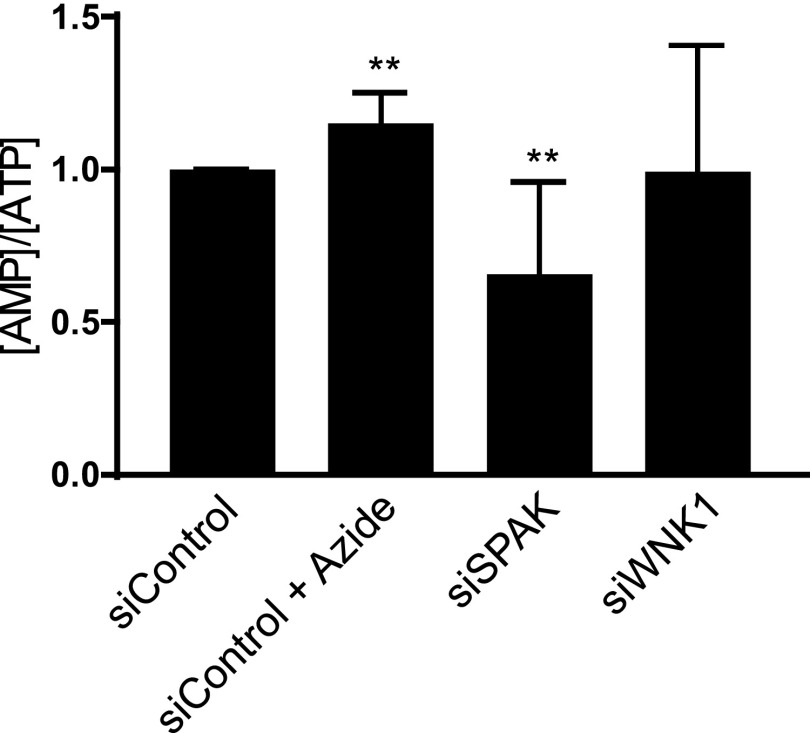
We assessed mTORC1 activity independently by measuring phosphorylation of p70 S6 kinase (56) and found that the activity of mTORC1 was unchanged by WNK1 depletion (Fig. 3E). In contrast, the loss of WNK1 increased phosphorylation of the activating site T172 on AMPK, suggesting enhanced AMPK activation (Fig. 3A), and consistent with increased ULK1 pS555. The AMP/ATP ratio in cells depleted of WNK1 was unchanged (Fig. S3). Treatment of cells with the AMPK inhibitor compound C decreased ULK1 pS555 and prevented the increase caused by WNK1 depletion (Fig. 3 F and G). Compound C had relatively little effect on the reduction of p62 caused by WNK1 depletion (Fig. 3 F and H). From these data, we suggest that autophagy inhibition exerted by WNK1 is partially dependent on its effect on ULK1 but depends more on other mechanisms.
Fig. S3.
Effect of WNK1 and SPAK knockdown on AMP/ATP ratio. HeLa cells were treated with 20 nM siControl, siWNK1 and siSPAK for 3 d. Before lysis, half of siControl cells were treated with 5–10 mM NaN3 for 2 h as a positive control to decrease ATP. Cells were then lysed and their adenosine nucleotide content was measured, as stated in SI Materials and Methods. n = 7. For NaN3 treatment, n = 3. **P < 0.01.
WNK1 Colocalizes and Interacts with UV Radiation Resistance-Associated Gene.
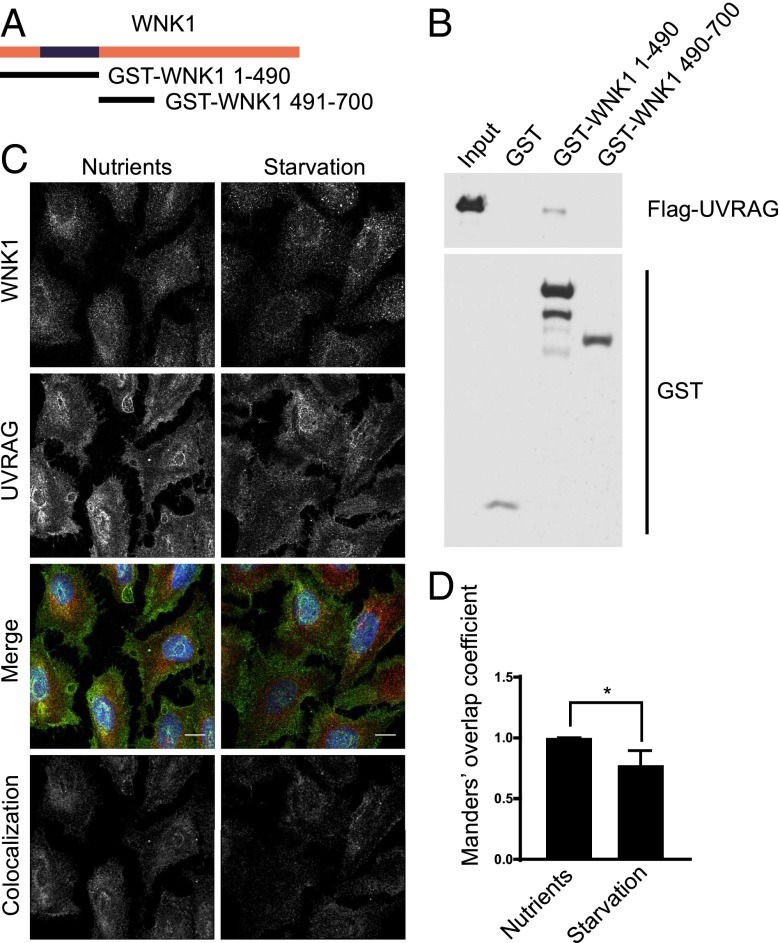
We analyzed whether WNK1 can interact with components of the PI3KC3 complex as a possible mechanism by which it exerts additional inhibitory effects on autophagy. Of several components tested, we found that WNK1 bound to UV radiation resistance-associated gene (UVRAG) in vitro using a GST pull-down assay with recombinant Flag-UVRAG and GST-WNK1 fragments (Fig. 4A). Flag-UVRAG bound GST-WNK1 1–490 but not GST-WNK1 491–700 or GST alone (Fig. 4B). These data indicate that UVRAG can interact with the N-terminal region of WNK1.
Fig. 4.
WNK1 colocalizes and interacts with UVRAG. (A) Rat WNK1 fragments. WNK1 1–490 encompasses the kinase domain, residues 193–490. (B) Recombinant Flag-UVRAG proteins were captured in vitro with the indicated GST proteins. Binding was detected by immunoblotting and chemiluminescence as in Fig. 3E. (C) U2OS cells were plated on glass coverslips. After 3 d, fresh normal or starvation medium was added for 4 h. Cells were analyzed by immunofluorescence. Images were deconvoluted and corrected for background as in Fig. 2. Colocalization thresholds for WNK1 and UVRAG channels were calculated and a colocalization channel was generated by the Imaris 8 software. The colocalization image shown was captured by the software. (Scale bars, 12 μm.) (D) Quantitation of the change of colocalization between WNK1 and UVRAG in C, using the relative Manders’ coefficient. *P < 0.05.
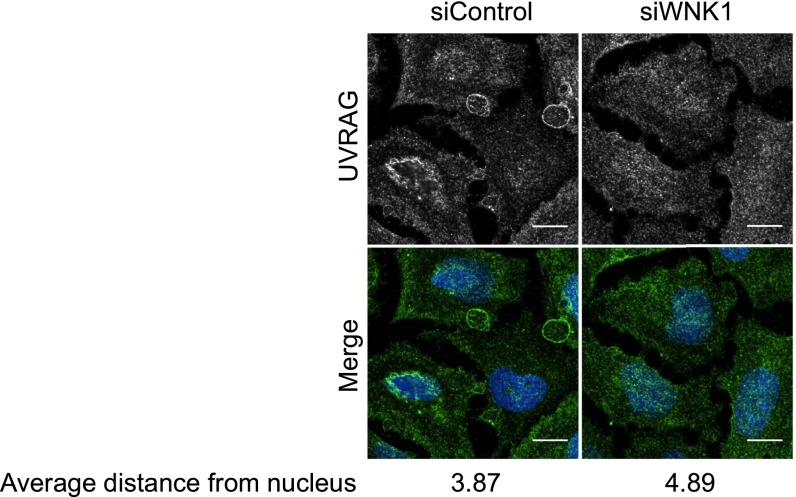
To determine whether these proteins were in proximity in cells, we assessed the localization of endogenous WNK1 and UVRAG by immunofluorescence. WNK1 is found in a punctate pattern throughout the cytoplasm of many cells (18, 57, 58) and displayed some colocalization with UVRAG (Fig. 4C). Activation of autophagy by starvation decreased the colocalization between the two proteins (Fig. 4 C and D). Depletion of WNK1 in U2OS cells changed the distribution of UVRAG, as observed by immunofluorescence, indicating that WNK1 may influence the cellular localization of UVRAG (Fig. S4). Therefore, we suggest that WNK1 also affects the PI3KC3 complex via its component UVRAG.
Fig. S4.
WNK1 depletion relocalizes UVRAG. WNK1 was knocked down by 20 nM siRNA in U2OS cells. After 3 d, the cells were treated with fresh medium for 4 h. Then the cells were analyzed by immunofluorescence. The UVRAG cellular distribution was calculated using CellProfiler software (74). For each cell, the median Euclidean distance between UVRAG-staining speckles and the center of nucleus was obtained and normalized to median cell radius. The resulting value was taken as the distance of UVRAG from the nucleus. (Scale bar, 150 pixels.)
The Depletion of SPAK in Cells Increases Autophagy.
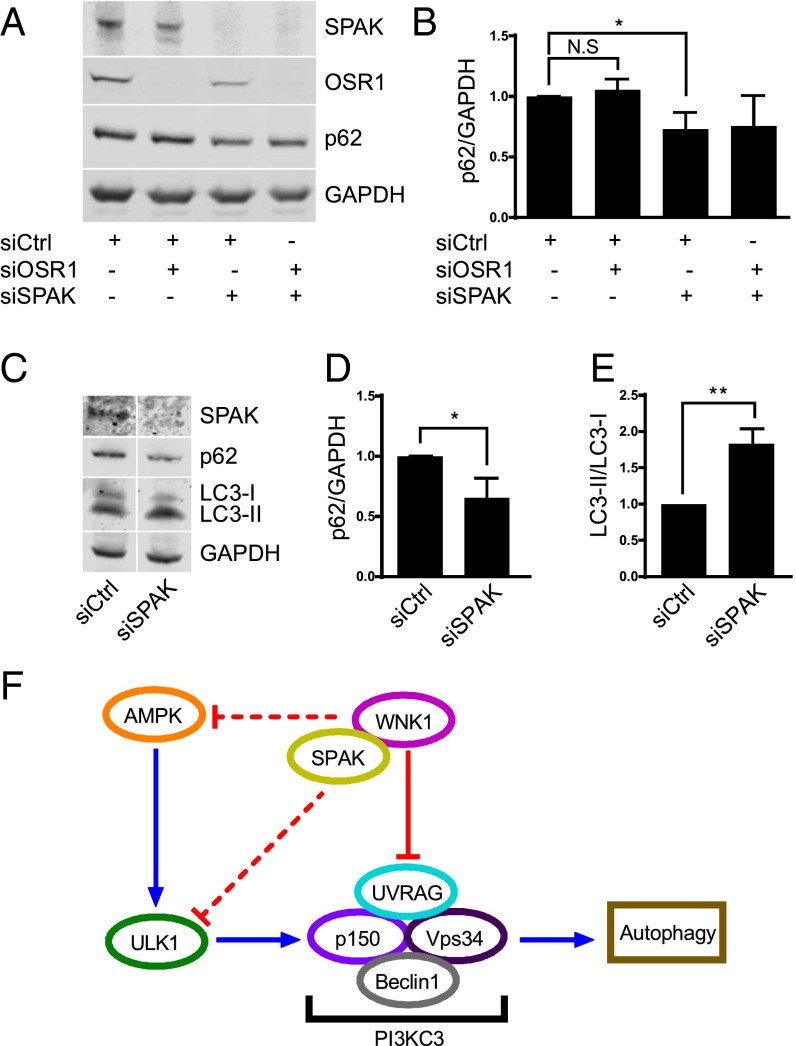
Because most of the known functions of WNKs are mediated by their downstream targets OSR1 and SPAK, we compared their effects on autophagy. Depletion of SPAK, but not OSR1, caused a reduction of p62 (Fig. 5) and increased the ratio of LC3-II/LC3-I (Fig. 5 C and E). These data show that the WNK1 downstream kinase SPAK also inhibits autophagy under nutrient-rich and -starved conditions, and may serve as a mediator of WNK1 actions on autophagy, whereas its relative OSR1 has no apparent effect on this process.
Fig. 5.
SPAK depletion increases autophagy. (A) HeLa cells were treated with 30 nM siRNA for OSR1 and SPAK, individually or in combination (total 60 nM), as indicated. After 3 d, fresh medium was added for 4 h before harvest and protein immunoblotting. (B) Quantitation of the relative p62 change in A. *P < 0.05. NS, not significant. (C) HeLa cells were treated with 20 nM siRNA for SPAK and after 3 d, cells were starved for 4 h. Lysate proteins were immunoblotted. (D) Quantitation of the relative p62 change in C. *P < 0.05. (E) Quantitation of the relative change of LC3-II/LC3-I ratio in C. **P < 0.01. (F) A model of autophagy regulation by WNK1.
Discussion
In this study, we show that reduced expression of WNK1 accelerates autophagy in diverse cell types, leading to our conclusion that a normal function of WNK1 is to suppress autophagy. Previously, WNK2 has been implicated in autophagy, although as an autophagy activator (59, 60). WNK1 appears to restrain autophagy by acting at multiple levels in the process (Fig. 5F). Increased phosphorylation of AMPK and its substrate ULK1 in cells with reduced WNK1 expression indicates a small inhibitory effect of WNK1 at the initial autophagy-inducing steps of the pathway. The fact that compound C has only a minor effect on autophagy induction by WNK1 depletion is evidence that this step contributes relatively little to the action of WNK1 on autophagy. In contrast to several autophagy regulators, WNK1 works independently of mTORC1, based on the lack of change in mTORC1 activity using phosphorylation of ULK1 and p70S6 kinase as readouts.
Autophagy regulation by WNK1 action on PI3KC3 complexes is most clearly demonstrated by changes in PI3KC3 activity and the mechanism is suggested by WNK1 interaction with UVRAG. Reduced WNK1 increases PI3KC3 activity deduced from a cellular reporter assay, indicating that the presence of WNK1 suppresses PI3KC3. WNK1 colocalization with UVRAG is reduced upon induction of autophagy, consistent with the idea that the interaction of WNK1 with UVRAG inhibits autophagy. UVRAG is a component of the PI3KC3 complex that enhances autophagosome maturation (61). The interaction with WNK1 may redirect UVRAG away from its role in autophagy. For example, WNK1 may extract UVRAG from the PI3KC3 complex or divert UVRAG toward endocytic trafficking, another function of the UVRAG–PI3KC3 complex (62–64). WNK1 itself has been associated with endocytic trafficking (24–27). Based on our current findings, the UVRAG–PI3KC3 step accounts for the most substantial effect of WNK1 on autophagy.
Previous studies using gene disruption in mice suggested that OSR1 and WNK1 have some overlapping functions in endothelial cells during cardiovascular development (65), and further in vitro studies suggested different functions of OSR1 and SPAK (22). In examining the possibility that OSR1 or SPAK induce the effects of WNK1 on autophagy, we found that depletion of SPAK, but not OSR1, stimulated autophagy. From side-by-side comparison in multiple experiments, depletion of SPAK causes only a fraction of the increase in autophagy caused by decreased WNK1 expression. This is added evidence suggesting that there is more than one mechanism through which WNK1 slows autophagy.
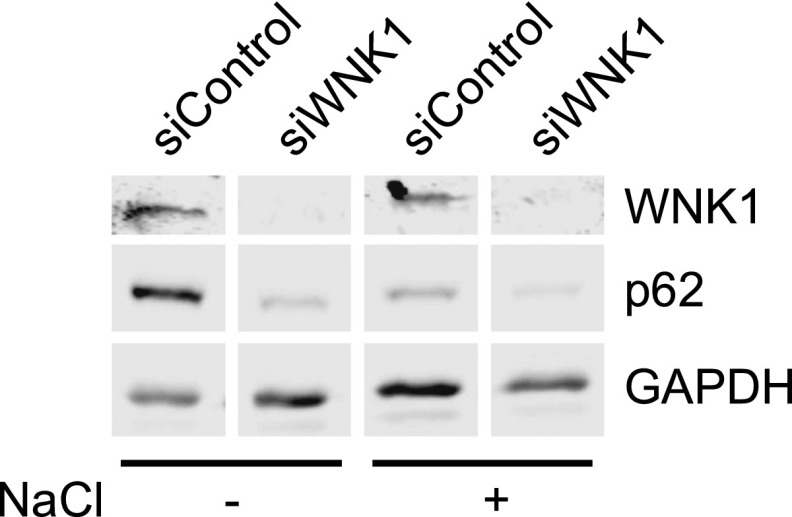
Osmotic stress has been shown to induce autophagy (66, 67). Because WNK1 is activated by osmotic stress, we tested the idea that the osmotic response occurs via WNK1. If so, loss of WNK1 should have prevented any further activation of autophagy by hypo- or hyperosmotic stress. We found that autophagy was further stimulated by exposure to either type of osmotic challenge even in cells with little WNK1 expression (Fig. S5). Thus, we were unable to make a connection between osmotic stress-induced autophagy and WNK1 and expect that the osmotic response is mediated by some other pathway.
Fig. S5.
Hyperosmotic stress-induced autophagy is independent of WNK1. WNK1 was knocked down by 20 nM siRNA in HeLa cells. After 3 d, the cells were treated with medium containing 0.05–0.2 M NaCl (Also with 0.1% DMSO) for 4 h. Then the cells were analyzed by immunoblotting. n = 2.
Some mechanisms have been identified for regulating the amount of the autophagy kinase ULK1 (68, 69). One of these involves the Kelch-like adaptor, KLHL20, which connects ULK1 to cullin 3 for degradation by an Fbox E3 ligase. WNKs are also regulated by binding Kelch-like adaptors, KLHL2 and KLHL3, which target them for degradation (12–16). Concentrations of WNKs can be changed relatively rapidly in cells by this type of degradative process with pathophysiological implications (70). Changing the WNK1 amount through degradation, distinct from changing WNK1 activity, may be a physiologically significant mechanism to induce autophagy. We demonstrate here that WNK1 can exert inhibitory control over autophagy that is sensitive to WNK1 expression. Among our findings, the connection between WNK1 and regulation of PI3KC3, although not fully defined mechanistically, may have implications for other processes mediated by products of this lipid kinase.
Materials and Methods
Materials.
The following antibodies were used: WNK1, SPAK, OSR1, ULK1, ULK1 pS555, ULK1 pS757, AKT1 (Cell Signaling Technology); p62, GAPDH, GST (Santa Cruz); LC3 (MBL); UVRAG, Flag M2 (Sigma-Aldrich); HRP-conjugated secondary antibodies (MBP). The following siRNAs were obtained from Life Technologies/Ambion: siOSR1 (Silencer select validated s19303), siSPAK (Silencer select validated s26208); WNK1 siRNAs are in Table S1. The following plasmids were used: pFlag-UVRAG-11d, [hUVRAG cloned into pFlag-11d, made by combining pFlag-CMV2 (Sigma) and pET-11d (Stratagene)], pGEX-KG-WNK1 1–490, pGEX-KG-WNK1 491–700 (71). Chemicals were obtained as indicated: compound C (Calbiochem), bafilomycin (LC Laboratories), wortmannin (Sigma-Aldrich).
Cell Culture and Transfection.
HeLa, U2OS, and U2OS GFP-LC3 were grown in DMEM with 10% (vol/vol) FBS, 1% (vol/vol) l-glutamine at 37 °C, 5% CO2. Earl’s balanced salt solution was the starvation medium. Knockdown was for 3 d, except in indicated experiments in which it was repeated with a 2-d interval. When plated, cells were transfected with the indicated concentrations of siRNA using Lipofectamine RNAiMAX reagent (Life Technologies) according to the manufacturer’s instructions. The medium was changed the day after transfection. Plasmid transfection was with Lipofectamine 2000 (Life Technologies), according to manufacturers’ instructions. The Lipofectamine 2000 to DNA ratio used was 2 µl:1 µg. In some cases, DMSO was included as a solvent control.
Immunofluorescence and Image Representation.
Unless stated otherwise, the following protocol was used for immunofluorescence. Cells on glass coverslips were fixed with 4% (vol/vol) paraformaldehyde in PBS for 15 min at room temperature followed by permeabilization with 0.1% of Triton X-100 in PBS for 4.5 min and blocking with 10% (vol/vol) normal goat serum (Invitrogen). Incubation with primary antibodies for 1 h at room temperature or overnight at 4 °C was followed by fluorescently labeled Alexa Fluor secondary antibodies diluted 1:500 for 1 h at room temperature. Coverslips were mounted on DAPI Fluoromount-G (SouthernBiotech) medium. Fluorescent images were obtained with a Zeiss LSM 880 laser scanning confocal microscope as z-stacks. Where indicated, the images were deconvoluted by 3D deconvolution using Autoquant X3 (Bitplane). The deconvoluted z-stacks were opened in FIJI (ImageJ) and compressed into 2D z-projections of maximum intensity (72). The brightness and contrast of each channel of the image panels was adjusted similarly across experimental conditions.
SDS/PAGE and Immunoblotting Analysis.
The following protocol was used unless otherwise noted. Cells were lysed with 2× Laemmli SDS sample buffer [250 mM Tris⋅HCl, pH 6.8, 10% (wt/vol) SDS, 30% (vol/vol) glycerol], heated and sonicated or passed through a 25-gauge needle, followed by addition of 5% (vol/vol) β-mercaptoethanol and 0.02% bromophenol blue. Equal amounts of protein were resolved on SDS 8% (wt/vol) polyacrylamide gels or 15% (wt/vol) Tricine gels and transferred onto PVDF membranes. Membranes were blocked with Odyssey blocking buffer (#927-40000) diluted in 10 mM Tris, pH 8.0, 150 mM NaCl, 0.1% Tween 20. Membranes were incubated with primary antibodies diluted in the above solution overnight at 4 °C. After washing, they were incubated with Odyssey IRDye secondary antibodies diluted 1:5,000 at room temperature for 1 h, followed by imaging with a LI-COR Odyssey imager. The immunoblots were quantified using Image Studio software (LI-COR).
Recombinant Protein Expression and Purification.
Flag-UVRAG was expressed in Escherichia coli Rosetta2 cells. Expression of recombinant proteins was induced with 1 mM isopropyl-β-d-thiogalactopyranoside (IPTG) for 3 h. The bacterial pellet was sonicated after addition of 80 mM Pipes, pH 6.8, 20% (vol/vol) glycerol, 1 mM MgCl2, 1 mM EGTA, 0.2 mM EDTA, 0.5 M NaCl, 0.5 mM ATP, 0.1% Nonidet P-40, protease inhibitors. After sedimentation, M2 agarose beads in 80 mM Pipes, 20% (vol/vol) glycerol, 0.5 mM MgCl2, 0.2 mM EDTA, 0.5 mM ATP, 1 mM DTT with protease inhibitors were added followed by rotation overnight at 4 °C. The beads were sedimented, washed with the buffer above containing 300 mM KCl plus 0.1% Nonidet P-40, and again without Nonidet P-40. Beads were transferred to a spin column and recombinant proteins were eluted with 0.2 mg/mL Flag peptide in the above buffer with 100 mM KCl and 0.03% Nonidet P-40.
GST Pull-Down Assay.
The plasmid pGEX-KG that expresses GST and GST-tagged WNK1 fragments were expressed in E. coli. After lysis and sonication (see above), Pierce glutathione agarose beads (Thermo Scientific) were added to the lysates, rotated at 4 °C and obtained by centrifugation. The beads were washed three times with lysis buffer, twice with wash buffer with 0.1 M KCl, and mixed with recombinant Flag-UVRAG proteins in vitro at 4 °C for 1 h. The beads were then sedimented, washed, and proteins eluted with Laemmli buffer with 5% (vol/vol) β-mercaptoethanol. Protein association was assessed by immunoblotting.
Statistical Analysis.
Prism software (GraphPad) was used for statistical analysis and the Student’s t test was used to determine the statistical significance of the changes between the conditions. Results are presented as the mean of three or more independent experiments unless specified otherwise. *P < 0.05, **P < 0.01, ***P < 0.001, and ****P < 0.0001.
SI Materials and Methods
Protease Inhibitor Mixture Preparation.
Protease inhibitors were purchased from Sigma. Pepstatin A (25 mg), leupeptin (25 mg), TAME (N-alpha p-tosyl L-arginine methyl ester; 250 mg), TLCK (N-alpha p-tosyl L-lysine chloromethyl ketone; 250 mg), BAME (N-alpha-benzoyl L-arginine methyl ester; 250 mg), and soybean trypsin inhibitor (250 mg) were dissolved in 62.5 mL of DMSO and stored at −20 °C.
Measurement of AMP and ATP Concentrations.
AMP and ATP were measured using the ATP/ADP/AMP Assay Kit (Biomedical Research Service and Clinical Application) according to the manufacturer’s instructions. In brief, the cells were washed twice with cold 1× PBS, collected and sedimented at 12,000 × g for 10 min. The cell pellets were resuspended in 0.1 mL of cold water, vortexed vigorously, and boiled for 10 min and sedimented at 21,130 × g for 5 min. Measurements were made on the supernatants according to the manufacturer’s protocol. Luminescence was measured using a plate reader.
Acknowledgments
We thank members of the M.H.C. laboratory and former member Hashem Dbouk, as well as Joseph Albanesi (Department of Pharmacology, University of Texas Southwestern) and Kate Luby-Phelps (Department of Cell Biology and Live Cell Imaging Facility, University of Texas Southwestern) for their advice about this project. The work was supported by NIH Grant R01GM53032 (to M.H.C.), Welch Foundation Grant I1243 (to M.H.C.), and National Cancer Institute Grant P30CA142543 to the Harold C. Simmons Comprehensive Cancer Center (Live Cell Imaging Facility). S.G.K. was supported in part by the Cancer Intervention and Prevention Discoveries Program RP140110.
Footnotes
The authors declare no conflict of interest.
This article contains supporting information online at www.pnas.org/lookup/suppl/doi:10.1073/pnas.1617649113/-/DCSupplemental.
References
- 1.Xu B, et al. WNK1, a novel mammalian serine/threonine protein kinase lacking the catalytic lysine in subdomain II. J Biol Chem. 2000;275(22):16795–16801. doi: 10.1074/jbc.275.22.16795. [DOI] [PubMed] [Google Scholar]
- 2.Veríssimo F, Jordan P. WNK kinases, a novel protein kinase subfamily in multi-cellular organisms. Oncogene. 2001;20(39):5562–5569. doi: 10.1038/sj.onc.1204726. [DOI] [PubMed] [Google Scholar]
- 3.Piala AT, et al. Chloride sensing by WNK1 involves inhibition of autophosphorylation. Sci Signal. 2014;7(324):ra41. doi: 10.1126/scisignal.2005050. [DOI] [PMC free article] [PubMed] [Google Scholar]
- 4.Vidal-Petiot E, et al. A new methodology for quantification of alternatively spliced exons reveals a highly tissue-specific expression pattern of WNK1 isoforms. PLoS One. 2012;7(5):e37751. doi: 10.1371/journal.pone.0037751. [DOI] [PMC free article] [PubMed] [Google Scholar]
- 5.Moriguchi T, et al. WNK1 regulates phosphorylation of cation-chloride-coupled cotransporters via the STE20-related kinases, SPAK and OSR1. J Biol Chem. 2005;280(52):42685–42693. doi: 10.1074/jbc.M510042200. [DOI] [PubMed] [Google Scholar]
- 6.Vitari AC, Deak M, Morrice NA, Alessi DR. The WNK1 and WNK4 protein kinases that are mutated in Gordon’s hypertension syndrome phosphorylate and activate SPAK and OSR1 protein kinases. Biochem J. 2005;391(Pt 1):17–24. doi: 10.1042/BJ20051180. [DOI] [PMC free article] [PubMed] [Google Scholar]
- 7.Anselmo AN, et al. WNK1 and OSR1 regulate the Na+, K+, 2Cl- cotransporter in HeLa cells. Proc Natl Acad Sci USA. 2006;103(29):10883–10888. doi: 10.1073/pnas.0604607103. [DOI] [PMC free article] [PubMed] [Google Scholar]
- 8.Piechotta K, Lu J, Delpire E. Cation chloride cotransporters interact with the stress-related kinases Ste20-related proline-alanine-rich kinase (SPAK) and oxidative stress response 1 (OSR1) J Biol Chem. 2002;277(52):50812–50819. doi: 10.1074/jbc.M208108200. [DOI] [PubMed] [Google Scholar]
- 9.Dowd BF, Forbush B. PASK (proline-alanine-rich STE20-related kinase), a regulatory kinase of the Na-K-Cl cotransporter (NKCC1) J Biol Chem. 2003;278(30):27347–27353. doi: 10.1074/jbc.M301899200. [DOI] [PubMed] [Google Scholar]
- 10.Vitari AC, et al. Functional interactions of the SPAK/OSR1 kinases with their upstream activator WNK1 and downstream substrate NKCC1. Biochem J. 2006;397(1):223–231. doi: 10.1042/BJ20060220. [DOI] [PMC free article] [PubMed] [Google Scholar]
- 11.Gagnon KB, England R, Delpire E. Volume sensitivity of cation-Cl- cotransporters is modulated by the interaction of two kinases: Ste20-related proline-alanine-rich kinase and WNK4. Am J Physiol Cell Physiol. 2006;290(1):C134–C142. doi: 10.1152/ajpcell.00037.2005. [DOI] [PubMed] [Google Scholar]
- 12.Louis-Dit-Picard H, et al. International Consortium for Blood Pressure (ICBP) KLHL3 mutations cause familial hyperkalemic hypertension by impairing ion transport in the distal nephron. Nat Genet. 2012;44(4):456–460, S1–S3. doi: 10.1038/ng.2218. [DOI] [PubMed] [Google Scholar]
- 13.Ohta A, et al. The CUL3-KLHL3 E3 ligase complex mutated in Gordon’s hypertension syndrome interacts with and ubiquitylates WNK isoforms: disease-causing mutations in KLHL3 and WNK4 disrupt interaction. Biochem J. 2013;451(1):111–122. doi: 10.1042/BJ20121903. [DOI] [PMC free article] [PubMed] [Google Scholar]
- 14.Takahashi D, et al. KLHL2 interacts with and ubiquitinates WNK kinases. Biochem Biophys Res Commun. 2013;437(3):457–462. doi: 10.1016/j.bbrc.2013.06.104. [DOI] [PubMed] [Google Scholar]
- 15.McCormick JA, et al. Hyperkalemic hypertension-associated cullin 3 promotes WNK signaling by degrading KLHL3. J Clin Invest. 2014;124(11):4723–4736. doi: 10.1172/JCI76126. [DOI] [PMC free article] [PubMed] [Google Scholar]
- 16.Wilson FH, et al. Human hypertension caused by mutations in WNK kinases. Science. 2001;293(5532):1107–1112. doi: 10.1126/science.1062844. [DOI] [PubMed] [Google Scholar]
- 17.Moniz S, et al. Protein kinase WNK2 inhibits cell proliferation by negatively modulating the activation of MEK1/ERK1/2. Oncogene. 2007;26(41):6071–6081. doi: 10.1038/sj.onc.1210706. [DOI] [PubMed] [Google Scholar]
- 18.Tu SW, Bugde A, Luby-Phelps K, Cobb MH. WNK1 is required for mitosis and abscission. Proc Natl Acad Sci USA. 2011;108(4):1385–1390. doi: 10.1073/pnas.1018567108. [DOI] [PMC free article] [PubMed] [Google Scholar]
- 19.Veríssimo F, Silva E, Morris JD, Pepperkok R, Jordan P. Protein kinase WNK3 increases cell survival in a caspase-3-dependent pathway. Oncogene. 2006;25(30):4172–4182. doi: 10.1038/sj.onc.1209449. [DOI] [PubMed] [Google Scholar]
- 20.Mäusbacher N, Schreiber TB, Daub H. Glycoprotein capture and quantitative phosphoproteomics indicate coordinated regulation of cell migration upon lysophosphatidic acid stimulation. Mol Cell Proteomics. 2010;9(11):2337–2353. doi: 10.1074/mcp.M110.000737. [DOI] [PMC free article] [PubMed] [Google Scholar]
- 21.Zhu W, et al. WNK1-OSR1 kinase-mediated phospho-activation of Na+-K+-2Cl- cotransporter facilitates glioma migration. Mol Cancer. 2014;13:31. doi: 10.1186/1476-4598-13-31. [DOI] [PMC free article] [PubMed] [Google Scholar]
- 22.Dbouk HA, et al. Actions of the protein kinase WNK1 on endothelial cells are differentially mediated by its substrate kinases OSR1 and SPAK. Proc Natl Acad Sci USA. 2014;111(45):15999–16004. doi: 10.1073/pnas.1419057111. [DOI] [PMC free article] [PubMed] [Google Scholar]
- 23.Moniz S, et al. Loss of WNK2 expression by promoter gene methylation occurs in adult gliomas and triggers Rac1-mediated tumour cell invasiveness. Hum Mol Genet. 2013;22(1):84–95. doi: 10.1093/hmg/dds405. [DOI] [PubMed] [Google Scholar]
- 24.Cai H, et al. WNK4 kinase regulates surface expression of the human sodium chloride cotransporter in mammalian cells. Kidney Int. 2006;69(12):2162–2170. doi: 10.1038/sj.ki.5000333. [DOI] [PubMed] [Google Scholar]
- 25.He G, Wang HR, Huang SK, Huang CL. Intersectin links WNK kinases to endocytosis of ROMK1. J Clin Invest. 2007;117(4):1078–1087. doi: 10.1172/JCI30087. [DOI] [PMC free article] [PubMed] [Google Scholar]
- 26.Cha SK, Huang CL. WNK4 kinase stimulates caveola-mediated endocytosis of TRPV5 amplifying the dynamic range of regulation of the channel by protein kinase C. J Biol Chem. 2010;285(9):6604–6611. doi: 10.1074/jbc.M109.056044. [DOI] [PMC free article] [PubMed] [Google Scholar]
- 27.Cheng CJ, Huang CL. Activation of PI3-kinase stimulates endocytosis of ROMK via Akt1/SGK1-dependent phosphorylation of WNK1. J Am Soc Nephrol. 2011;22(3):460–471. doi: 10.1681/ASN.2010060681. [DOI] [PMC free article] [PubMed] [Google Scholar]
- 28.Xie J, et al. Endothelial-specific expression of WNK1 kinase is essential for angiogenesis and heart development in mice. Am J Pathol. 2009;175(3):1315–1327. doi: 10.2353/ajpath.2009.090094. [DOI] [PMC free article] [PubMed] [Google Scholar]
- 29.Xu BE, et al. WNK1 activates ERK5 by an MEKK2/3-dependent mechanism. J Biol Chem. 2004;279(9):7826–7831. doi: 10.1074/jbc.M313465200. [DOI] [PubMed] [Google Scholar]
- 30.Rubinsztein DC, Codogno P, Levine B. Autophagy modulation as a potential therapeutic target for diverse diseases. Nat Rev Drug Discov. 2012;11(9):709–730. doi: 10.1038/nrd3802. [DOI] [PMC free article] [PubMed] [Google Scholar]
- 31.Mizushima N, Komatsu M. Autophagy: Renovation of cells and tissues. Cell. 2011;147(4):728–741. doi: 10.1016/j.cell.2011.10.026. [DOI] [PubMed] [Google Scholar]
- 32.Mizushima N, Yamamoto A, Matsui M, Yoshimori T, Ohsumi Y. In vivo analysis of autophagy in response to nutrient starvation using transgenic mice expressing a fluorescent autophagosome marker. Mol Biol Cell. 2004;15(3):1101–1111. doi: 10.1091/mbc.E03-09-0704. [DOI] [PMC free article] [PubMed] [Google Scholar]
- 33.Onodera J, Ohsumi Y. Autophagy is required for maintenance of amino acid levels and protein synthesis under nitrogen starvation. J Biol Chem. 2005;280(36):31582–31586. doi: 10.1074/jbc.M506736200. [DOI] [PubMed] [Google Scholar]
- 34.Liang XH, et al. Protection against fatal Sindbis virus encephalitis by beclin, a novel Bcl-2-interacting protein. J Virol. 1998;72(11):8586–8596. doi: 10.1128/jvi.72.11.8586-8596.1998. [DOI] [PMC free article] [PubMed] [Google Scholar]
- 35.Orvedahl A, et al. Autophagy protects against Sindbis virus infection of the central nervous system. Cell Host Microbe. 2010;7(2):115–127. doi: 10.1016/j.chom.2010.01.007. [DOI] [PMC free article] [PubMed] [Google Scholar]
- 36.Tsukada M, Ohsumi Y. Isolation and characterization of autophagy-defective mutants of Saccharomyces cerevisiae. FEBS Lett. 1993;333(1-2):169–174. doi: 10.1016/0014-5793(93)80398-e. [DOI] [PubMed] [Google Scholar]
- 37.Komatsu M, et al. Impairment of starvation-induced and constitutive autophagy in Atg7-deficient mice. J Cell Biol. 2005;169(3):425–434. doi: 10.1083/jcb.200412022. [DOI] [PMC free article] [PubMed] [Google Scholar]
- 38.Komatsu M, et al. Essential role for autophagy protein Atg7 in the maintenance of axonal homeostasis and the prevention of axonal degeneration. Proc Natl Acad Sci USA. 2007;104(36):14489–14494. doi: 10.1073/pnas.0701311104. [DOI] [PMC free article] [PubMed] [Google Scholar]
- 39.Kuma A, et al. The role of autophagy during the early neonatal starvation period. Nature. 2004;432(7020):1032–1036. doi: 10.1038/nature03029. [DOI] [PubMed] [Google Scholar]
- 40.Ezaki J, et al. Liver autophagy contributes to the maintenance of blood glucose and amino acid levels. Autophagy. 2011;7(7):727–736. doi: 10.4161/auto.7.7.15371. [DOI] [PMC free article] [PubMed] [Google Scholar]
- 41.Berger Z, et al. Rapamycin alleviates toxicity of different aggregate-prone proteins. Hum Mol Genet. 2006;15(3):433–442. doi: 10.1093/hmg/ddi458. [DOI] [PubMed] [Google Scholar]
- 42.Ravikumar B, Duden R, Rubinsztein DC. Aggregate-prone proteins with polyglutamine and polyalanine expansions are degraded by autophagy. Hum Mol Genet. 2002;11(9):1107–1117. doi: 10.1093/hmg/11.9.1107. [DOI] [PubMed] [Google Scholar]
- 43.Liang XH, et al. Induction of autophagy and inhibition of tumorigenesis by beclin 1. Nature. 1999;402(6762):672–676. doi: 10.1038/45257. [DOI] [PubMed] [Google Scholar]
- 44.Yang Z, Klionsky DJ. Eaten alive: A history of macroautophagy. Nat Cell Biol. 2010;12(9):814–822. doi: 10.1038/ncb0910-814. [DOI] [PMC free article] [PubMed] [Google Scholar]
- 45.Maxfield K, Macion J, Vankayalapati H, Whitehurst AW. SIK2 restricts autophagic flux to support triple negative breast cancer survival. Mol Cell Biol. 2016;pii:MCB.00380-16. doi: 10.1128/MCB.00380-16. [DOI] [PMC free article] [PubMed] [Google Scholar]
- 46.Mizushima N, Yoshimori T, Levine B. Methods in mammalian autophagy research. Cell. 2010;140(3):313–326. doi: 10.1016/j.cell.2010.01.028. [DOI] [PMC free article] [PubMed] [Google Scholar]
- 47.Komatsu M, et al. Homeostatic levels of p62 control cytoplasmic inclusion body formation in autophagy-deficient mice. Cell. 2007;131(6):1149–1163. doi: 10.1016/j.cell.2007.10.035. [DOI] [PubMed] [Google Scholar]
- 48.Petiot A, Ogier-Denis E, Blommaart EF, Meijer AJ, Codogno P. Distinct classes of phosphatidylinositol 3′-kinases are involved in signaling pathways that control macroautophagy in HT-29 cells. J Biol Chem. 2000;275(2):992–998. doi: 10.1074/jbc.275.2.992. [DOI] [PubMed] [Google Scholar]
- 49.Backer JM. The intricate regulation and complex functions of the class III phosphoinositide 3-kinase Vps34. Biochem J. 2016;473(15):2251–2271. doi: 10.1042/BCJ20160170. [DOI] [PubMed] [Google Scholar]
- 50.Gaullier JM, et al. FYVE fingers bind PtdIns(3)P. Nature. 1998;394(6692):432–433. doi: 10.1038/28767. [DOI] [PubMed] [Google Scholar]
- 51.Blommaart EF, Krause U, Schellens JP, Vreeling-Sindelárová H, Meijer AJ. The phosphatidylinositol 3-kinase inhibitors wortmannin and LY294002 inhibit autophagy in isolated rat hepatocytes. Eur J Biochem. 1997;243(1-2):240–246. doi: 10.1111/j.1432-1033.1997.0240a.x. [DOI] [PubMed] [Google Scholar]
- 52.Young AR, et al. Starvation and ULK1-dependent cycling of mammalian Atg9 between the TGN and endosomes. J Cell Sci. 2006;119(Pt 18):3888–3900. doi: 10.1242/jcs.03172. [DOI] [PubMed] [Google Scholar]
- 53.Russell RC, et al. ULK1 induces autophagy by phosphorylating Beclin-1 and activating VPS34 lipid kinase. Nat Cell Biol. 2013;15(7):741–750. doi: 10.1038/ncb2757. [DOI] [PMC free article] [PubMed] [Google Scholar]
- 54.Egan DF, et al. Phosphorylation of ULK1 (hATG1) by AMP-activated protein kinase connects energy sensing to mitophagy. Science. 2011;331(6016):456–461. doi: 10.1126/science.1196371. [DOI] [PMC free article] [PubMed] [Google Scholar]
- 55.Kim J, Kundu M, Viollet B, Guan KL. AMPK and mTOR regulate autophagy through direct phosphorylation of Ulk1. Nat Cell Biol. 2011;13(2):132–141. doi: 10.1038/ncb2152. [DOI] [PMC free article] [PubMed] [Google Scholar]
- 56.Hara K, et al. Amino acid sufficiency and mTOR regulate p70 S6 kinase and eIF-4E BP1 through a common effector mechanism. J Biol Chem. 1998;273(23):14484–14494. doi: 10.1074/jbc.273.23.14484. [DOI] [PubMed] [Google Scholar]
- 57.Sengupta S, et al. Interactions with WNK (with no lysine) family members regulate oxidative stress response 1 and ion co-transporter activity. J Biol Chem. 2012;287(45):37868–37879. doi: 10.1074/jbc.M112.398750. [DOI] [PMC free article] [PubMed] [Google Scholar]
- 58.Zagórska A, et al. Regulation of activity and localization of the WNK1 protein kinase by hyperosmotic stress. J Cell Biol. 2007;176(1):89–100. doi: 10.1083/jcb.200605093. [DOI] [PMC free article] [PubMed] [Google Scholar]
- 59.Szyniarowski P, et al. A comprehensive siRNA screen for kinases that suppress macroautophagy in optimal growth conditions. Autophagy. 2011;7(8):892–903. doi: 10.4161/auto.7.8.15770. [DOI] [PubMed] [Google Scholar]
- 60.Guo S, et al. A rapid and high content assay that measures cyto-ID-stained autophagic compartments and estimates autophagy flux with potential clinical applications. Autophagy. 2015;11(3):560–572. doi: 10.1080/15548627.2015.1017181. [DOI] [PMC free article] [PubMed] [Google Scholar]
- 61.Liang C, et al. Beclin1-binding UVRAG targets the class C Vps complex to coordinate autophagosome maturation and endocytic trafficking. Nat Cell Biol. 2008;10(7):776–787. doi: 10.1038/ncb1740. [DOI] [PMC free article] [PubMed] [Google Scholar]
- 62.Zhong Y, et al. Distinct regulation of autophagic activity by Atg14L and Rubicon associated with Beclin 1-phosphatidylinositol-3-kinase complex. Nat Cell Biol. 2009;11(4):468–476. doi: 10.1038/ncb1854. [DOI] [PMC free article] [PubMed] [Google Scholar]
- 63.Itakura E, Mizushima N. Atg14 and UVRAG: Mutually exclusive subunits of mammalian Beclin 1-PI3K complexes. Autophagy. 2009;5(4):534–536. doi: 10.4161/auto.5.4.8062. [DOI] [PubMed] [Google Scholar]
- 64.Tooze SA, Abada A, Elazar Z. Endocytosis and autophagy: Exploitation or cooperation? Cold Spring Harb Perspect Biol. 2014;6(5):a018358. doi: 10.1101/cshperspect.a018358. [DOI] [PMC free article] [PubMed] [Google Scholar]
- 65.Xie J, Yoon J, Yang SS, Lin SH, Huang CL. WNK1 protein kinase regulates embryonic cardiovascular development through the OSR1 signaling cascade. J Biol Chem. 2013;288(12):8566–8574. doi: 10.1074/jbc.M113.451575. [DOI] [PMC free article] [PubMed] [Google Scholar]
- 66.Nunes P, et al. Hypertonic stress promotes autophagy and microtubule-dependent autophagosomal clusters. Autophagy. 2013;9(4):550–567. doi: 10.4161/auto.23662. [DOI] [PMC free article] [PubMed] [Google Scholar]
- 67.Jiang LB, et al. Activation of autophagy via Ca(2+)-dependent AMPK/mTOR pathway in rat notochordal cells is a cellular adaptation under hyperosmotic stress. Cell Cycle. 2015;14(6):867–879. doi: 10.1080/15384101.2015.1004946. [DOI] [PMC free article] [PubMed] [Google Scholar]
- 68.Liu CC, et al. Cul3-KLHL20 ubiquitin ligase governs the turnover of ULK1 and VPS34 complexes to control autophagy termination. Mol Cell. 2016;61(1):84–97. doi: 10.1016/j.molcel.2015.11.001. [DOI] [PubMed] [Google Scholar]
- 69.Dorsey FC, et al. Mapping the phosphorylation sites of Ulk1. J Proteome Res. 2009;8(11):5253–5263. doi: 10.1021/pr900583m. [DOI] [PubMed] [Google Scholar]
- 70.Zeniya M, et al. Kelch-like protein 2 mediates angiotensin II-With No Lysine 3 signaling in the regulation of vascular tonus. J Am Soc Nephrol. 2015;26(9):2129–2138. doi: 10.1681/ASN.2014070639. [DOI] [PMC free article] [PubMed] [Google Scholar]
- 71.Xu BE, et al. WNK1 activates SGK1 to regulate the epithelial sodium channel. Proc Natl Acad Sci USA. 2005;102(29):10315–10320. doi: 10.1073/pnas.0504422102. [DOI] [PMC free article] [PubMed] [Google Scholar]
- 72.Schindelin J, et al. Fiji: An open-source platform for biological-image analysis. Nat Methods. 2012;9(7):676–682. doi: 10.1038/nmeth.2019. [DOI] [PMC free article] [PubMed] [Google Scholar]
- 73.Vucicevic L, et al. Compound C induces protective autophagy in cancer cells through AMPK inhibition-independent blockade of Akt/mTOR pathway. Autophagy. 2011;7(1):40–50. doi: 10.4161/auto.7.1.13883. [DOI] [PubMed] [Google Scholar]
- 74.Gustafsdottir SM, et al. Multiplex cytological profiling assay to measure diverse cellular states. PLoS One. 2013;8(12):e80999. doi: 10.1371/journal.pone.0080999. [DOI] [PMC free article] [PubMed] [Google Scholar]


