Significance
There are two main groups of land plants, flowering plants (also referred to as angiosperms) and gymnosperms. Compared with angiosperms, gymnosperms have larger genomes, often approximately 20 Gb, and have a higher abundance of transposons and other repetitive elements that are silenced by DNA methylation. Here, we present a whole genome single-base resolution DNA methylation analysis of the important conifer Norway spruce (Picea abies), providing an important resource for the epigenetic study of this species. We show that the Norway spruce genome is heavily methylated because of high transposon content. In addition, we also show that somatic embryogenesis cultures used in the industry show altered DNA methylation patterning.
Keywords: gymnosperms, Norway spruce, DNA methylation, small RNA, genome size
Abstract
DNA methylation plays important roles in many biological processes, such as silencing of transposable elements, imprinting, and regulating gene expression. Many studies of DNA methylation have shown its essential roles in angiosperms (flowering plants). However, few studies have examined the roles and patterns of DNA methylation in gymnosperms. Here, we present genome-wide high coverage single-base resolution methylation maps of Norway spruce (Picea abies) from both needles and somatic embryogenesis culture cells via whole genome bisulfite sequencing. On average, DNA methylation levels of CG and CHG of Norway spruce were higher than most other plants studied. CHH methylation was found at a relatively low level; however, at least one copy of most of the RNA-directed DNA methylation pathway genes was found in Norway spruce, and CHH methylation was correlated with levels of siRNAs. In comparison with needles, somatic embryogenesis culture cells that are used for clonally propagating spruce trees showed lower levels of CG and CHG methylation but higher level of CHH methylation, suggesting that like in other species, these culture cells show abnormal methylation patterns.
DNA methylation is the most studied stable and heritable epigenetic modification of eukaryotes, and plays important roles in transcriptional regulation and silencing of repetitive elements and transposons (1). In plants, DNA methylation occurs in three contexts, CG, CHG (H is A, T, or C), and CHH (2–4). In Arabidopsis, forward genetic screens have uncovered many components that are required for DNA methylation. For example, the maintenance of CG, CHG, and a subset of CHH DNA methylation is mediated by METHYLTRANSFERASE 1 (MET1), CHROMOMETHYLASE (CMT) 3, and CMT2, respectively, whereas the de novo establishment of DNA methylation in all three contexts and the maintenance of the rest of the CHH methylation is mediated by the RNA-directed DNA methylation (RdDM) pathway that employs DOMAINS REARRANGED METHYLTRANSFERASE 2 (DRM2) (5).
Genome-wide methylome studies have been performed in many plant species, such as Arabidopsis, tomato, poplar, soybean, rice, and cassava (2, 3, 6–11). These studies uncovered conserved DNA methylation patterns in genic regions and transposable element regions across plant genomes. However, the DNA methylation landscapes of gymnosperm species that have large genome sizes and high repeat content are relatively understudied. Takuno et al. have demonstrated that genic CHG methylation was correlated with genome size by studying gene body methylation in selected gymnosperm species (12). However, genome-wide high coverage single-base resolution DNA methylation maps of any gymnosperm are still lacking. It is known that transposable elements (TEs) are the main targets of DNA methylation. However, the roles of DNA methylation in TE-abundant gymnosperm species, for example Norway spruce (Picea abies), whose TEs comprise more than 70% of the genome, have not been studied in detail. Using next generation sequencing technology, the genome of Norway spruce was sequenced, and 12 billion bases of the 19.6-Gbp genome were successfully assembled into approximately 10 million scaffolds.
To better understand the roles of DNA methylation in TE-abundant gymnosperms, we present genome-wide high coverage single-base resolution DNA maps of the Norway spruce. Using high throughput bisulfite sequencing, we characterized global DNA methylation patterns of both genic and intergenic regions in needles and somatic embryogenic cultures, the material used for clonal propagation, and found reduced methylation levels during somatic embryogenesis. In addition, we also found that global DNA methylation levels are correlated with genome size even when taking into account of the enormous size of Norway spruce.
Results
Methylation Pathway Genes Are Conserved in Gymnosperms.
A plethora of genes involved in DNA methylation have largely been studied in the model plant Arabidopsis thaliana, such as the DNA methyltransferases MET1, CMT2, CMT3, and DRM2, as well as other genes involved in different DNA methylation pathways. Although most genes involved in DNA methylation are conserved across angiosperm species, these genes have not been extensively studied in gymnosperms, and the existence of Pol V in gymnosperms has been controversial (13). Previous studies showed that many subunits of RNA POLYMERASE IV (Pol IV) were conserved across land plants. For example, DNA-DIRECTED RNA POLYMERASE IV SUBUNIT 1 (NRPD1), NRPD2, and NRPD7 were discovered in mosses. However, the largest subunit of Pol V, DNA-DIRECTED RNA POLYMERASE V SUBUNIT 1 (NRPE1), was not found in gymnosperms or other land plants (5). Recently, Huang et al. analyzed the transcriptome of four gymnosperms (Ginkgo biloba, Cycas revoluta, Pinus canariensis, and Ephedra trifurca) and showed that two subunits of Pol V were conserved from angiosperm to gymnosperms (NRPE5) and from angiosperm to liverworts (NRPE1) (14).
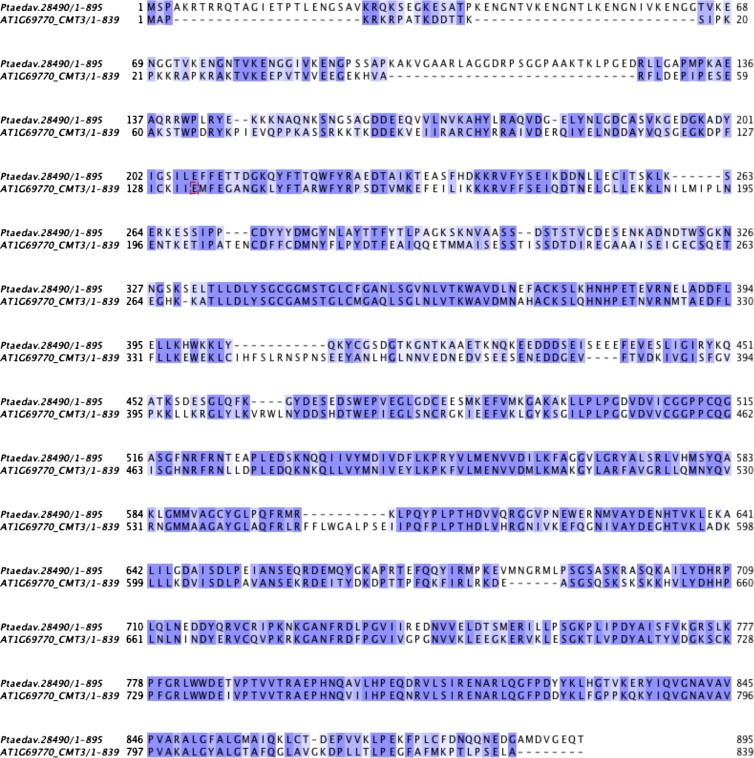
To comprehensively investigate whether the various methylation pathway genes exist in gymnosperm, we examined the whole genomic sequence and the annotation of protein-coding genes of Norway spruce and other sequenced gymnosperm plants, including Pinus sylvestris, Abies sibirica, Juniperus communis, Taxus baccata, and Gnetum gnemon. We also studied transcriptome data from three other gymnosperm species, Picea glauca, Pinus taeda, and Picea sitchensis, to accurately identify DNA methylation pathway genes in gymnosperms. In Table 1, we present evidence for the existence of NRPD1, NRPE1, NRPE5, RNA-DEPENDENT RNA POLYMERASE 2 (RDR2), DICER-LIKE ENDONUCLEASE 3 (DCL3), and ARGONAUTE 4 (AGO4) in Norway spruce, which are representative genes in the RdDM pathway. This finding is consistent with the previous identification of RdDM machinery in nonflowering plants (14). In addition, we found at least one copy of most other known factors involved in DNA methylation control (Table 1) (15–17). As shown in Table 1, neither CMT2 nor CMT3 was identified in Norway spruce by similarity searches. However, this result is likely due to the incompleteness of the genome assembly, because we could detect CMT homology in another gymnosperm, P. taeda (Table 1 and Fig. S1). Taken together, our data suggest that DNA methylation pathways are likely to be functional and largely conserved in gymnosperms.
Table 1.
Putative DNA methylation pathway genes in Norway spruce
| Norway spruce (P. abies) | |||||
| Gene function | Name | Length, aa* | Copy 1 | Copy 2 | |
| MET1 | VIM1,2,3,4,5,6 | 645 | MA_10432100g0020 | — | |
| MET1,2a,2b,3 | 1,534 | MA_10436985g0010† | MA_10433746g0010 | ||
| CMT3 | SUVH4 | 624 | MA_106068g0010 | — | |
| CMT2 | 1,295 | NULL‡ | — | ||
| CMT3 | 839 | NULL‡ | — | ||
| Pol IV recruit | CLSY1/CLSY2 | 1,256 | MA_36244g0010† | MA_15897g0010 | |
| SHH1/SHH2 | 258 | MA_10426813g0010 | MA_290667g0010 | ||
| Pol IV | NRPD1 | 1,453 | MA_10429268g0010†§ | — | |
| Pol IV+V | NRPD2/NRPE2 | 1,172 | MA_10434923g0010† | — | |
| Pol IV+V | NRPD4/NRPE4 | 205 | NULL | — | |
| Pol V | NRPE1 | 1,976 | MA_8720349g0010§ | — | |
| Pol V | NRPE5 | 222 | MA_10435418g0010† | — | |
| Pol V | NRPE9B | 114 | MA_10427302g0010† | — | |
| Pol V recruit | DRD1 | 888 | MA_165746g0010†§ | — | |
| DMS3 | 420 | MA_10437097g0010¶ | — | ||
| RDM1 | 163 | NULL†§ | — | ||
| SUVH2/9 | 650 | MA_54295g0010† | MA_7658g0020 | ||
| RdDM | RDR2 | 1,133 | MA_10436273g0010† | — | |
| DCL1 | 1,910 | MA_10437243g0020 | — | ||
| DCL2 | 1,388 | MA_10429678g0010 | — | ||
| DCL3 | 1,580 | MA_8664686g0010† | — | ||
| DCL4 | 1,702 | MA_10436812g0020 | — | ||
| HEN1 | 942 | MA_131583g0010† | — | ||
| AGO4 | 924 | MA_118377g0010† | — | ||
| KTF1 | 1,493 | NULL†§ | — | ||
| IDN2 | 647 | MA_9285293g0010† | — | ||
| IDL1/2 | 634 | MA_14874g0010 | MA_1921g0010 | ||
| SUVR2 | 740 | NULL† | — | ||
| DMS4 | 346 | MA_227360g0010† | — | ||
| UBP26 | 1,067 | MA_2328g0010† | — | ||
| DRM2 | 626 | MA_637235g0010†§ | — | ||
| LDL1 | 844 | MA_25928g0010† | — | ||
| LDL2 | 746 | MA_1921g0010† | — | ||
| JMJ14 | 954 | MA_10436538g0010† | — | ||
| HDA6 | 471 | MA_10427274g0010† | — | ||
| Others | RDR6 | 1,196 | MA_20320g0020 | — | |
| MOM1 | 2,001 | MA_10427682g0010 | — | ||
| MORC6 | 663 | MA_91753g0010†§ | — | ||
| DDM1 | 764 | MA_104034g0010† | — | ||
For gene family, the length of protein indicates the length of one of the proteins in this gene family.
Indicates consistent result with the Ma et al. study (16).
Indicates CMT2/3 could be found in P. taedav.
Indicates consistent result with the Matzke et al. study (15).
Indicates this gene could be found in the Yakovlev et al. study (17).
Fig. S1.
Sequence alignment of Arabidopsis CMT3 and a putative CMT3 ortholog of P. taedav. Both protein sequences were extracted by reciprocal best hit of BLASTP, and then were aligned by Muscle.
Single-Base Resolution Landscapes of DNA Methylation in Norway Spruce.
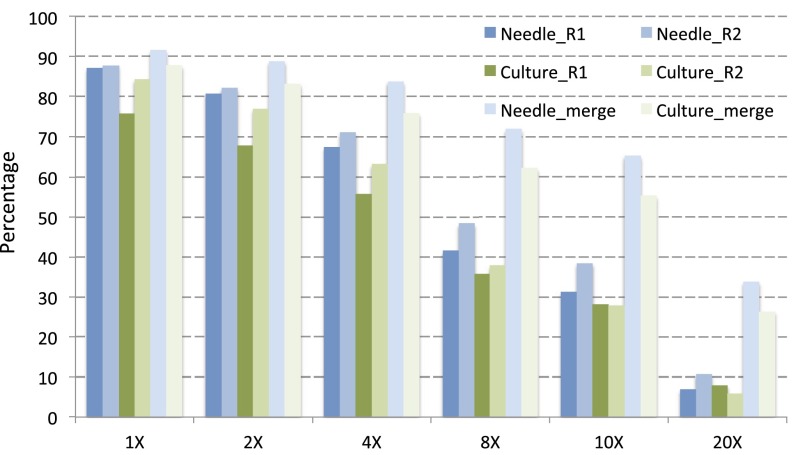
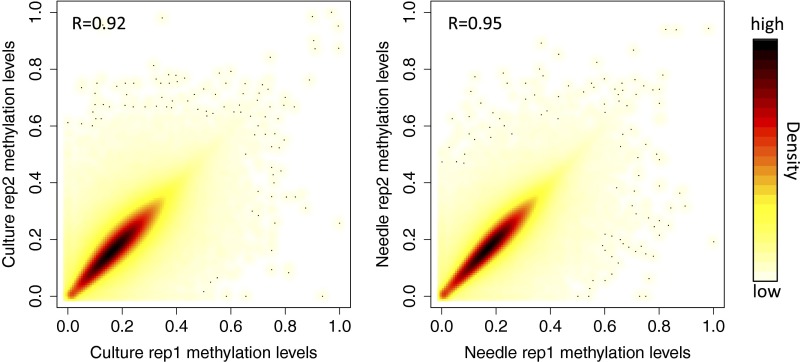
To explore DNA methylation in Norway spruce, we performed whole genome bisulfite sequencing (BS-seq) of needles and somatic embryogenesis (SE) culture cells (both originating from the genotype used to generate the genome assembly), each with two replicates, generating a combined 8.6 billion (needles) and 7.5 billion (SE) single-end 100-bp reads (Table S1). Reads were mapped to the P. abies genome to identify methylcytosines by Bismark (18). More than 83% and 76% of total cytosines were covered by more than four reads in needles and SE culture cells, respectively (Table S1 and Fig. S2), indicating good library quality and high sequencing depth. To assess sequencing variability, we calculated a Pearson correlation coefficient of the two replicates of both tissues and found it to be 0.92 and 0.95 for SE culture and needle replicates, respectively (Fig. S3), indicating the high reproducibility of our BS-seq results.
Table S1.
Summary of BS-seq results and estimation of methylation levels
| Samples | Read no. | Uniquely mapped | Mapped ratio, % | %mCG | %mCHG | %mCHH | Conversion rate, % | Sequencing depth, Gb |
| Needle rep1 | 4,071,099,559 | 2,374,889,504 | 58.3 | 74.7 | 69.1 | 1.5 | 94.91 | 118 |
| Needle rep2 | 4,538,423,678 | 2,636,656,075 | 58.1 | 74.4 | 68.9 | 1.5 | 95.43 | 131 |
| Culture rep1 | 3,776,335,406 | 2,102,719,947 | 55.7 | 68.6 | 62.8 | 2.6 | 94.49 | 105 |
| Culture rep2 | 3,801,275,690 | 2,123,873,990 | 55.9 | 66.3 | 60.9 | 1.9 | 95.00 | 106 |
Fig. S2.
BS-seq coverage shown as the percentage of cytosines that are covered by at least “X” reads. Both replicates of needle and SE culture cell were calculated separately first and then merged together as Needle/Culture_merge. Approximately 83% and 76% of total cytosines were covered by at least four reads in needle and SE culture cell, respectively.
Fig. S3.
Correlation between replicates of needles (Right) and SE culture (Left). Methylation levels were calculated for each 2-kbp window, and Pearson correlation coefficient was calculated and shown as R value.
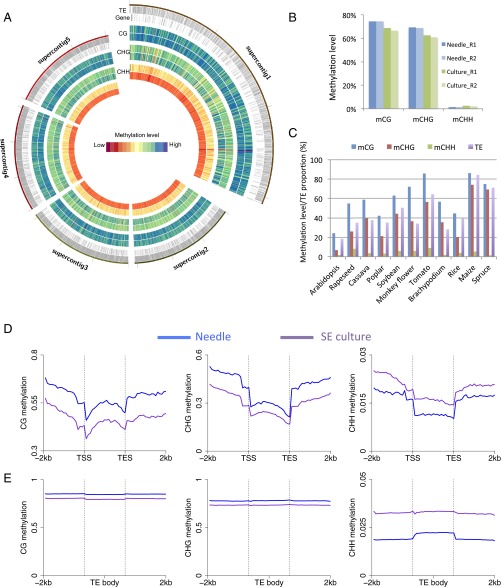
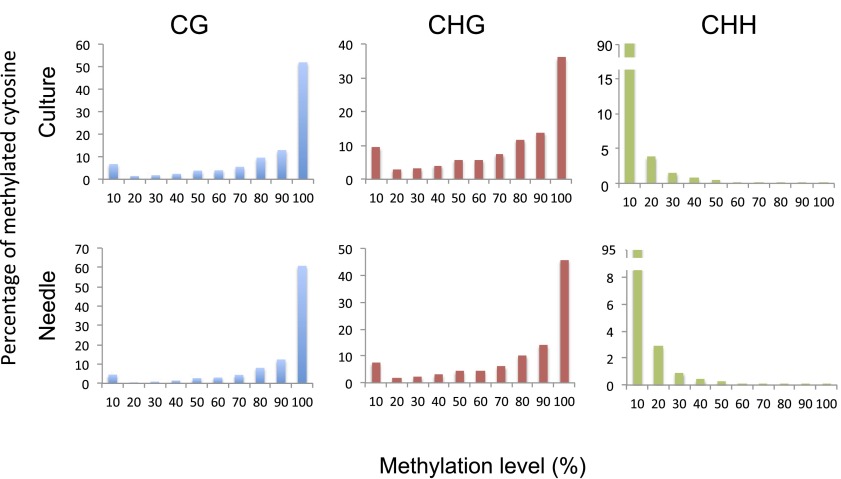
To facilitate the analysis, we reconstructed the Norway spruce genome sequences into 234 supercontigs by connecting the approximately 10 million smaller contigs from the Norway spruce genome assembly, with 200 “Ns” inserted between the connected smaller contigs (Experimental Procedures). Global DNA methylation landscapes of supercontig1 to supercontig5 are shown in Fig. 1A for both needle and SE culture. The remaining supercontigs are shown in Dataset S1. The global average methylation level of CG, CHG, and CHH in needles was 74.7%, 69.1%, and 1.5%, respectively. In contrast to Arabidopsis, the majority of not only CG sites, but also CHG sites, were either not methylated or highly methylated (bimodal distribution of methylation status of each cytosine), suggesting a robust methylation maintenance system for CHG sites. Conversely, CHH sites were either not methylated or methylated at less than 20% (Fig. S4). Compared with needles, SE culture cells showed similar patterns but with reduced methylation levels of CG and CHG sites and increased CHH methylation across the supercontigs (Fig. 1 A and B and Dataset S1) (see details below).
Fig. 1.
The DNA methylation landscape of Norway spruce and comparison with other species previously studied. (A) The landscape of DNA methylation in the first five supercontigs in SE culture and needles of Norway spruce. TEs and genes are indicated by gray bars in the first two circles; methylation levels of SE culture (outer) and needles (inner) are shown by circles of CG, CHG, and CHH. Maximum methylation levels are 0.97 (CG), 0.90 (CHG), and 0.16 (CHH). (B) Global average DNA methylation levels of CG, CHG, and CHH in different replicates of needles and SE culture. (C) Correlation of methylation levels and TE abundance. CG and CHG methylation is positively correlated with TE abundance, but not CHH methylation. (D and E) DNA methylation patterns and levels in protein-coding genes (D) and transposons (E) of needles and SE culture.
Fig. S4.
Distribution of methylation levels of CG (Left), CHG (Center), and CHH (Right) in SE culture and needles. The methylation level is divided into 10 bins from 0 to 100%.
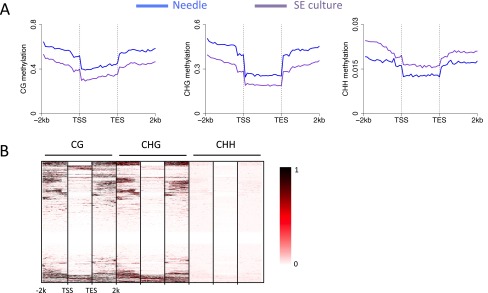
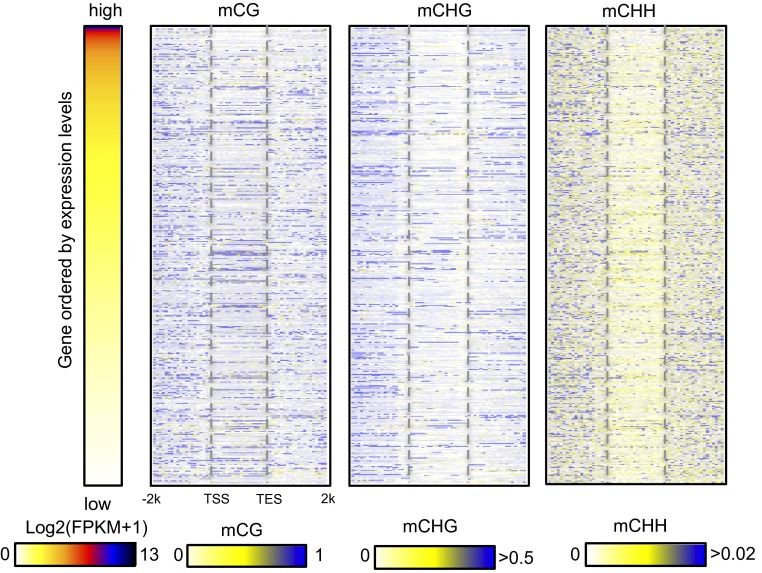
The genome-wide average DNA methylation levels at CHG sites of Norway spruce was much higher than most previously studied plant species, being only moderately lower than that of maize (Fig. 1C). A comparison of the proportion of TEs in different plant genomes with methylation levels in all three cytosine contexts showed that they are positively correlated (Fig. 1C), consistent with transposons being a major target of DNA methylation. We separately investigated the patterns and levels of methylation in genic regions and transposable element regions. The methylation patterns of genic regions were similar to those of other plant species, showing increased CG methylation in gene body and flanking regions but reduced methylation in transcriptional start/end sites (Fig. 1D). Meanwhile, CHH methylation was relatively depleted in gene bodies but elevated in upstream or downstream regions of gene bodies. Nevertheless, for all three cytosine contexts, gene body methylation levels in Norway spruce were much higher than most of other plant species, such as Arabidopsis, rice, and cassava (2, 9, 19). In most plant species, gene bodies are exclusively methylated in the CG context; however, we found moderate but significant levels of gene-body CHG methylation in Norway spruce (Fig. 1D). This result is consistent, however, with a recent study of genic DNA methylation across land plants by Takuno et al. using low coverage sequencing, which showed that non-CG methylation was much higher in gymnosperms, such as P. taeda and P. glauca, than in other plant species (12). Our previous work showed that gene body methylation level estimates were lowered by excluding intronic TEs (9). We also performed this analysis in Norway spruce but found that excluding intronic TEs had little impact on the estimates of methylation in any sequence context (Fig. S5A). From a cluster analysis, it was also clear that some genes have much more CHG methylation in the gene body than other genes (Fig. S5B). To further examine whether non-CG body methylation is correlated with repressed gene expression, we rank ordered genes from high to low by expression levels and examined the methylation levels of all three cytosine contexts across gene bodies and flanking regions. As shown in Fig. S6, both highly and moderately expressed genes could be methylated in CHG and CHH contexts in gene bodies. This analysis indicated that non-CG methylation in gene body regions may not negatively regulate gene expression as was previously suggested for P. taeda (12). Similar to studies in angiosperms, the moderately highly expressed genes (the genes in second, third, and fourth expression groups) showed the highest CG gene body methylation levels (Fig. S7). Taken together, Norway spruce shows both CG and non-CG genic methylation, but this methylation is unlikely to repress gene expression.
Fig. S5.
Methylation patterns of genes excluding intronic TE insertions. (A) Metaplot of methylation in genes excluding intronic TE insertions. (B) Heatmap of methylation in genes excluding intronic TE insertions.
Fig. S6.
Heatmap of DNA methylation in genes ordered by expression. Gene abundance was estimated by FPKM. In the case of zero value, we used log2(FPKM+1) to order gene expression. DNA methylation in each sequence context is shown correspondingly.
Fig. S7.
Correlation between DNA methylation and transcription. Expressed genes were divided into five groups by expression level, from first (lowest expression) to fifth (highest expression). Each group contains a similar number of genes.
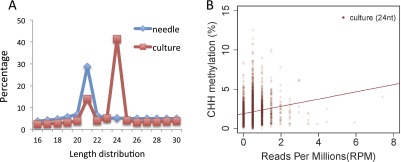
As expected from the presence of most known components of the RNA-directed DNA methylation pathway, we found a correlation between the presence of siRNAs and the presence of CHH methylation. First, the higher level of CHH methylation in SE culture cells correlated with a much higher levels of 24-nt siRNAs in this tissue compared with needle, which showed almost exclusively 21-nt siRNAs (Fig. S8A). In addition, within 500-bp bins throughout the genome in SE culture cells, we observed a correlation between the presence of 24-nt siRNA and CHH DNA methylation (Fig. S8B).
Fig. S8.
Correlation between 24-nt siRNA abundance and CHH methylation levels. (A) Comparison of the length distributions of siRNA between needle and SE culture. (B) The correlation between CHH methylation and 24-nt siRNA abundance of supercontig1 in SE culture. Each bin represents a 500-bp window. Red line represents a fitted line from a linear model (Im function in R software) for SE culture.
Transposons were highly methylated in both CG and CHG contexts and showed a higher level of CHH methylation than in genes (Fig. 1E). There was also high methylation upstream and downstream of annotated TEs, which is likely because of the high TE content and the frequency of nested or adjacent TEs (Fig. 1E).
DNA Methylation Differences Between Needle and SE Culture.
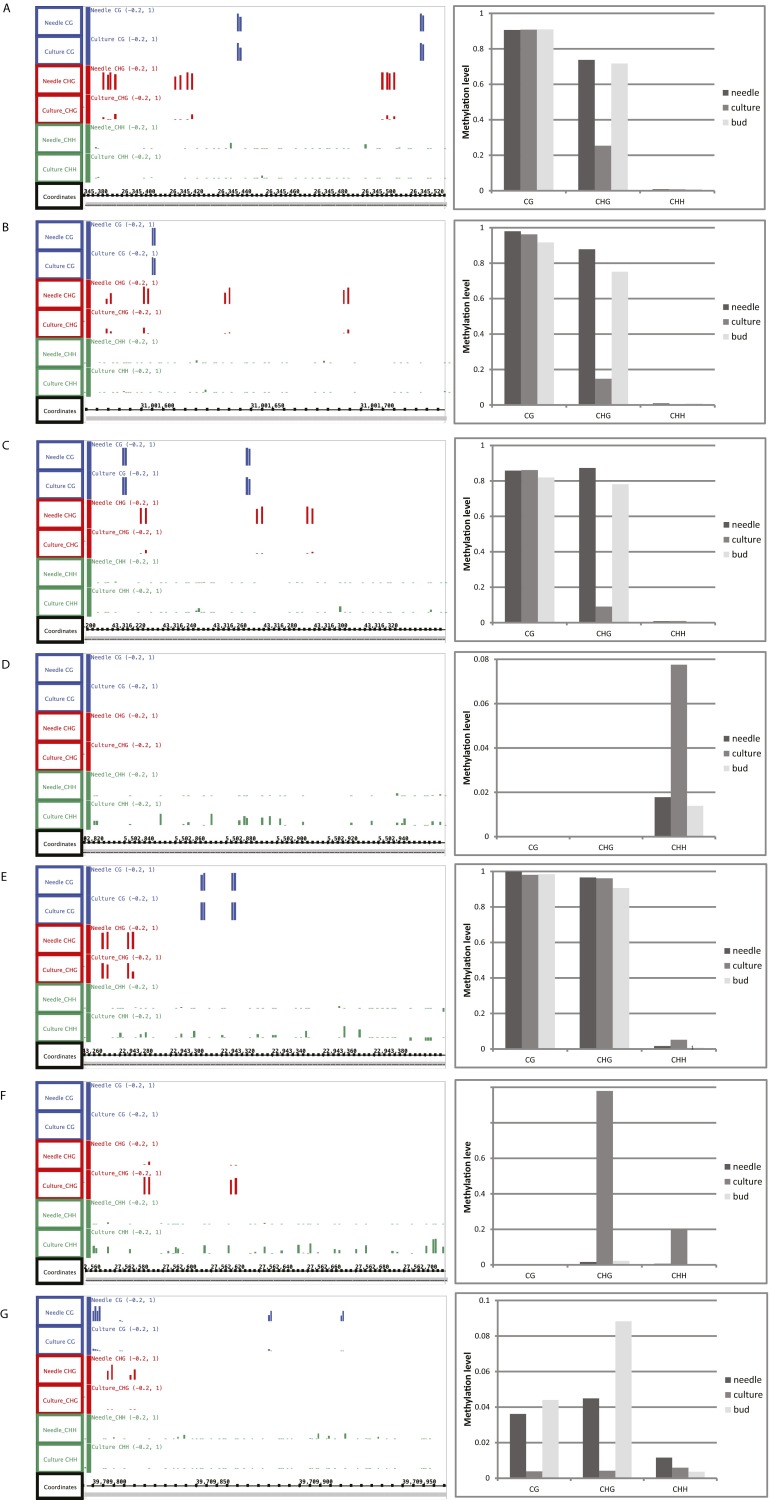
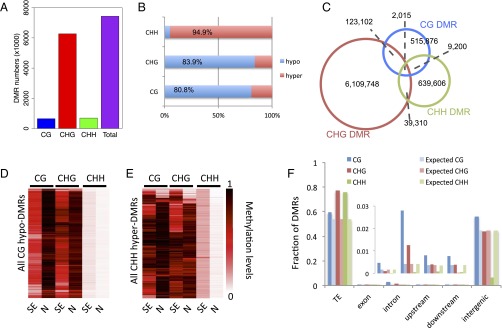
A comparison of needles and SE culture cells showed lower CG and CHG methylation levels and higher CHH methylation levels in SE culture cells (Fig. 1 A and B and Fig. S9). These changes were genomewide, found in both genes and transposons, and were much more dramatic than differences found in previous studies of tissue culture cells or in plants regenerated from tissue culture cells in rice or maize (Fig. 1 D and E) (20, 21). In addition, the TEs were more enriched in CHH methylation relative to flanking regions in needles than they were in SE culture cells (Fig. 1E). To examine local DNA methylation differences between needles and SE culture, we compared these two types of tissues and identified differential methylation regions (DMRs) by stringent criteria (Experimental Procedures). We observed loss of DNA methylation in CG and CHG contexts and increased CHH methylation at many sites in SE culture compared with needles (Fig. 2), and a validation of seven specific sites by traditional bisulfite sequencing confirmed these differences and suggested that the whole genome bisulfite data are highly accurate (Fig. S9 and Table S2). We also used DNA from a third tissue, flower buds, to confirm methylation at these seven sites, and found that the patterns were quite similar in flower buds and needles (Fig. S9). This result suggests that the differences in methylation observed could be specific to SE culture cells, although we cannot exclude the possibility that there are other cell types, which we have not examined, with similar methylation patterns as SE culture cells. We found that 84.3% of the total DMRs were in the CHG context, and the number of CG DMRs was similar to that of CHH DMRs (Fig. 2A). Consistent with a previous study of plants regenerated from rice tissue culture (20), the majority of DMRs were hypo-DMRs in the CG and CHG contexts, but not in CHH context (Fig. 2B). Interestingly, most of the three types of DMRs were not overlapping with each other, suggesting that the majority of the differentially methylated regions do not have more than one type of DMR (Fig. 2C) (but see exceptions below). By examination of hypo-DMRs in the CG context, we found that loss of CG methylation in those regions was almost always accompanied with loss of CHG methylation and gain of CHH methylation (Fig. 2D). We also found that hyper-CHH DMRs were not usually accompanied by changes in methylation in other sequence contexts (Fig. 2E), consistent with the trends seen in Fig. 2C. We assigned DMRs in all three cytosine contexts to different genomic elements, and found that DMRs in all three contexts were most abundantly located in TE regions, whereas CG was the main form of DMRs that was enriched in non-TE and intergenic regions (Fig. 2F). Taken together, DMRs of the three cytosine contexts were not evenly distributed within genic and intergenic genomic features, and CHG was the major form of differentially methylated regions between needles and SE culture of Norway spruce.
Fig. S9.
Detection of methylation differences between needles and SE culture by BS-seq and validation of BS-seq data by traditional bisulfite sequencing. BS-seq data [screenshot from Integrated Genome Browser (IGB) browser] from selected regions in supercontig 1 (see Experimental Procedures for supercontigs) are shown on the left and traditional bisulfite data (see Table S2 for PCR primers used) are shown on the right. In BS-seq data, CG, CHG, and CHH are shown in blue, red, and green, respectively. Regions in A–C lose CHG methylation in SE culture; regions in D and E gain CHH methylation in SE culture; region in F gains CHG and CHH methylation in SE culture; and region in G loses all three types of methylation in SE culture. Traditional bisulfite sequencing data obtained from buds is also included for comparison purpose.
Fig. 2.
DNA methylation differences between needles and SE culture. (A) DMR numbers of each cytosine context. (B) Proportions of hypo- and hyper-DMRs in CG, CHG, and CHH contexts. (C) Overlap of three types of DMRs. (D and E) Heatmaps of all CG hypo-DMRs and CHH-hyper-DMRs between SE culture and needles. DMRs were binned by 2-kbp window for this analysis. N, needle; SE, somatic embryogenesis. (F) Observed overlap of DMRs with different types of genomic elements compared with their expected overlaps. Inset shows a scaled view of exon, intron, upstream, and downstream elements.
Table S2.
PCR primers used in traditional bisulfite sequencing
| Regions | Primer sequences |
| Supercontig1: 26,345,393–26,345,542 | 5′-TTGAGTGAAAAAATTYGAATATTATAAATTGTTTGGA-3 |
| 5′-TTTTAAACTTTTAACACRTTTCCATACCCT-3′ | |
| Supercontig1: 31,001,585–31,001,748 | 5′-YTTTTTTGAGTGTTTTTGGGTTAAATTTGAG-3′ |
| 5′-CTAAAATAATCATTTAAAATACTTTTTCATATTCATAAATTTTATTTTTA-3′ | |
| Supercontig1: 43,316,225–43,316,367 | 5′-TATATTATAATTTTTTTTGTTTTATATTATGTTTTTTATTTTGYTTGAA-3′ |
| 5′-CATCAAACAAAAATTCTCTTTRCAAAATATATAAAAAAATAC-3′ | |
| Supercontig1: 5,502,827–5,502,968 | 5′-ATTTGAGTGATTGTTTTTTTTTTTTTYAGTATAYTGA-3′ |
| 5′-CACACTARACCTATCATACCACATAATATTTC-3′ | |
| Supercontig1: 22,943,274–22,943,415 | 5′-TGTGYAATAATATAAYGAAATTGTGTGYGAATA-3′ |
| 5′-TCTTATTTCTTAAAAATTTTAATTAAAACTCTCACTCCATA-3′ | |
| Supercontig1: 27,562,572–27,562,721 | 5′-TTATTATTGTTAATTTTTTAATTGAYGAGATTTTAATTTTTTTAATATAA-3′ |
| 5′-AAATTCTTCCTTCAAATACAAATARARTTAAAAATTTCTTA-3′ | |
| Supercontig1: 39,709,799–39,709,973 | 5′-AGAGAGGATGAAGGGAATGATTGA-3′ |
| 5′-CAATAAAAATAAAAATATAAATATTAACTAAAAATCAATACCAAAAATAAT-3′ |
Global Methylation Levels Are Correlated with Genome Size.
Norway spruce is the largest completely sequenced genome. The reason why this genome is so large is still unknown. From DNA methylation studies of other plants, DNA methylation is often concentrated in pericentromeric heterochromatin regions, which consist of heavily methylated transposable elements and other repetitive elements (2, 9, 22). In the Norway spruce genome, there are abundant TEs and other repetitive elements throughout the genome with approximately 70% of the Norway spruce genome being composed of these elements (23).
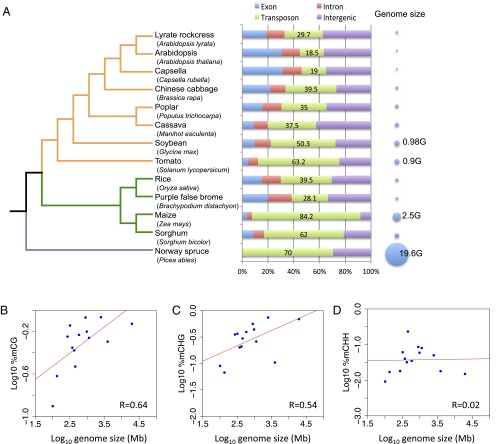
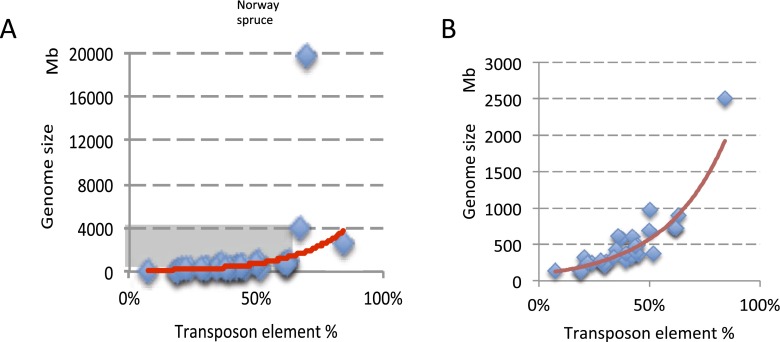
Compared with other plants, Norway spruce was one of the most heavily methylated species. We noticed that some of the other densely methylated species, like maize and tomato, had similar TE contents (84.2% and 64.2%, respectively) to Norway spruce (70%) (Fig. 3A) (24). Recently, Takuno et al. showed that gene body CG and CHG methylation levels were correlated with genome sizes by sampling more than 14 species. However, when they excluded nonvascular species, they found that only CHG methylation level was correlated with genome sizes (12). To further investigate the correlation between DNA methylation levels and genome sizes, we compared the DNA methylation levels of several angiosperms and three nonvascular species together with Norway spruce. We found that methylation levels of CG and CHG were correlated with genome sizes but CHH was not (Fig. 3 B–D). Intriguingly, this correlation was also related to TE abundance (Fig. 1C), indicating that the number of heavily methylated TEs was correlated with genome sizes. We sampled 33 species and found that the abundance of TEs in these species had a strong positive correlation with genome sizes (Fig. S10A). This correlation was much more apparent after excluding Norway spruce as an outlier (Fig. S10B). Similarly, a recent study by Niederhuth et al. has also shown a correlation between genome-wide DNA methylation levels and genome size, and they noted that this positive correlation was significantly affected by one large genome (Zea mays) (11). In the future, additional studies of large genomes like Norway spruce should help to clarify the relationship between DNA methylation and genome size.
Fig. 3.
Genomic sizes of different plant species and their correlation with DNA methylation. (A) Phylogenetic tree showing the evolutionary relationship of 13 plant species and their genomic components and genome sizes. Orange lines indicate eudicots, green lines indicate monocots, and the purple line indicates gymnosperm (Norway spruce), which is an out-group. (B–D) Correlation between genome sizes and the levels of CG (B), CHG (C), and CHH (D) methylation.
Fig. S10.
Correlation between transposon element content and genome size. (A) Genome size is correlated with TE content. Thirty-three angiosperm species were used to show this correlation. (B) This is a zoomed-in view of the gray area in A. Red line is exponential regression line.
Taken together, both TE abundance and DNA methylation are positively correlated with genome sizes in plants, and these findings are consistent with studies in metazoans (25).
Discussion
Gymnosperms have more than 1,000 extant species and are important ecological and economic resources, providing humans with lumber, soap, varnish, and perfumes. Norway spruce belongs to conifers that are the predominant gymnosperm (comprising approximately two-thirds of all of the gymnosperms) and mainly occupy the forests of the Northern Hemisphere. In recent years, sequence analyses in conifers have led to identification of conifer genes and sequencing of conifer genomes (23, 26–31). Because their genomes are so large (often more than 20 Gbp) compared with other eukaryotes, and because of their high content of transposons together with the role of DNA methylation in transposon silencing, it is of interest to study DNA methylation in gymnosperm genomes.
Our comprehensive analysis of DNA methylation pathway genes identified genes such as NRPD1, NRPE1, NRPE5, RDR2, DCL3, and AGO4, all of which are important for the RdDM pathway in Arabidopsis, suggesting an intact RdDM pathway in Norway spruce. Consistent with this hypothesis, siRNAs were correlated with CHH methylation throughout the genome. Our analysis of the methylome of Norway spruce showed that whereas the general DNA methylation patterns of genic and intergenic regions are similar to other plants (2, 3, 9, 32), global average CHG methylation levels are much higher in Norway spruce than in most other plant species. In contrast to other plants that have exclusive CG gene body methylation, Norway spruce gene body regions are also moderately methylated in CHG context, although this methylation does not correlate with gene silencing. This result is consistent with a recent study that focused only on genic methylation (12). From the collection of available data on DNA methylation levels and genome sizes from land plants, we found that genome sizes are generally positively correlated with methylation levels in CG and CHG contexts but not in the CHH context. The likely reason for this correlation is that species with larger genomes generally contain higher numbers of TEs.
Tissue culturing is one of the most common methods used in the production of transgenic crops, and in the clonal propagation of many species. In Norway spruce, several studies have shown that somatic embryos developed from callus can be used to generate plantlets for tree propagation (33, 34). Environmental factors such as temperature can affect this embryogenesis process, and it has been suggested that epigenetic gene regulation plays a role (17, 35). Consistent with studies of rice tissue culture or tissue culture-derived plants (20), we found that CG and CHG methylation were reduced at specific regions of the genome in SE culture cells compared with needles. Although it is not clear whether these methylation changes are occurring on one or both alleles of genes, and whether these methylation changes are heritable and would be transmitted to clones derived from culture cells, these points remain interesting questions for future studies. Regardless, our results suggest that methylation reprogramming during tissue culture growth may be a common phenomenon in both gymnosperms and angiosperms. Studies of rice and maize methylation patterns have suggested that losses of methylation may be a significant source of somaclonal variation, a phenomenon in which phenotypically abnormal plants, or “off types,” arise in the process of deriving plants from tissue culture (20, 21, 36). An example of an important somaclonal variant that is important in agriculture is the recently described mantled allele of oil palm that drastically reduces yield and is due to a methylation change at a single gene (36). Thus, our finding of significant changes of methylation patterns of Norway spruce somatic embryogenesis cultures suggests that epialleles might arise during the derivation of plants from these cultures that might affect the expression of important genes and, thus, influence specific forestry traits.
Experimental Procedures
Plant Material and DNA Extraction.
DNA was extracted from needles of the sequenced Z4006 P. abies genotype, as described in Nystedt et al. (23). For the SE culture sample, material was collected at the proliferation stage, as described in Businge et al. (37), and DNA extracted as for the needle samples. The culture was generated from seeds obtained from the sequenced “Z4006” genotype.
Library Construction and Sequencing.
BS-seq libraries were prepared by using TruSeq Nano DNA LT kit (Illumina), as described (38), except that EZ DNA Methylation-Lighting Kit (Zymo) was used for bisulfite conversion of genomic DNA. BS-seq libraries were sequenced on a HiSeq 2500 system (Illumina) to obtain single-end 100-bp reads. Traditional bisulfite sequencing of selected regions was performed as described (39), except that EZ DNA Methylation-Lightning Kit (Zymo) was used for bisulfite conversion of genomic DNA. Furthermore, instead of Sanger sequencing, the PCR products amplified from bisulfite converted DNA were used for library preparation by Ovation Ultralow V2 kit (Nugen) and TruSeq Nano DNA LT kit (Illumina), and the libraries were sequenced on a HiSeq 2000 system (Illumina) to obtain single-end 100-bp reads. The PCR primers are listed in Table S2.
Supercontig Reconstruction.
Because there are more than 10 million small contigs in the draft genome of Norway spruce, it makes it difficult to detect methylated cytosines and calculate methylation levels using available software. Therefore, we merged these small contigs into 234 supercontigs with an average length of 60 Mbp by insertion of 200 “N” letters between adjacent contigs.
BS-seq Data Alignment.
All BS-seq reads were aligned against the Norway spruce reference genome, as well as the chloroplast genome, using Bismark v0.13.0 (18). BS-seq reads of each replicate were aligned independently with the following parameters: -q–score_min L,0,-0.3 -most_valid_alignments 1–bowtie2. Only uniquely mapped reads were kept to estimate methylation ratio. Methylation ratios of each cytosine were calculated as the number of Cs divided by Cs plus Ts. Conversion rates were estimated from chloroplast genome methylation levels, and each sample was calculated independently as shown in Table S1.
Correlation Analysis of Methylation Data.
Reproducibility between replicates of BS-seq was calculated as methylation levels of total Cs in 2-kbp regions. First, the Norway spruce genome was split into 2-kbp bins, and methylation levels were calculated as the average #C/(#C+#T) for all cytosines in each bin. Then, Pearson correlation coefficients were calculated between the two replicates (Fig. S2).
Differential Methylation Analysis.
DMRs were defined as described (40) by dividing the genome into 100-bp bins and comparing between needle and SE culture by the number of called Cs and Ts (from the positions covered by at least four sequencing reads) using Fisher’s exact test and correction by Benjamini-Hochberg FDR <0.01. In addition, the absolute methylation difference of each bin had to be bigger than 0.4, 0.2, and 0.1 for CG, CHG, and CHH context, respectively.
Metaplot Analysis.
For metagene plot, gene body regions were divided proportionally into 20 bins. Upstream 2-kbp or downstream 2-kbp regions were divided into 20 bins (100-bp in each bin). The average methylation level of each bin was calculated for each gene and plotted by R software.
RNA-seq Data Analysis.
Needle RNA-seq data were downloaded from ERP002475. The needle samples were described in the Norway spruce genome paper (23), and samples of needles from 2008 and 2009 were combined and used to estimate the expression level of each gene. Tophat and Cufflinks were used to map sequencing reads and expression values were estimated as FPKM (fragments per kilobase per million mapped reads) (41, 42).
sRNA-seq Data Analysis.
We used publicly available sRNA-seq data from needles of Norway spruce (ERR260432). For SE culture, sRNA-seq library was generated as described (23), and a total number of ∼2.2 million nonredundant single-end 50-bp reads were obtained. After removing the adapter by Cutadapt v1.3 (43), all sRNA-seq reads were mapped to the genome of Norway spruce by using Bowtie (44) allowing no mismatches (Table S3). Only uniquely mapped reads were kept to calculate the distribution of length of sRNA and abundance across gene regions.
Table S3.
Summary of sRNA-seq read alignment
| Samples | Total reads* | Uniquely mapped | Mapped ratio, % |
| Needle | 2,061,322 | 1,494,660 | 72.51 |
| SE culture | 2,261,492 | 2,027,354 | 89.65 |
Nonredundant reads.
Supplementary Material
Acknowledgments
We thank members of the S.E.J. laboratory for useful discussions. We are grateful for support from the Umeå Plant Science Centre (UPSC) bioinformatics platform. This work was supported by funds from National Natural Science Foundation of China Grant 31501031, Program for Excellent Youth Talents in Fujian Province University, and Fujian-Taiwan Joint Innovative Centre for Germplasm Resources and Cultivation of Crop (Fujian 2011 Program) (to H.W.), the University of California, Los Angeles–Fujian Agriculture and Forestry University Joint Research Center on Plant Proteomics, the Alice Wallenberg Foundation, the Swedish Research Council (VR), the Swedish Governmental Agency for Innovation Systems (Vinnova), the Swedish Research Council for Environment, Agricultural Sciences and Spatial Planning (Formas), and the Swedish Foundation for Strategic Research, in part through the UPSC Berzelii Centre for Forest Biotechnology. W.L. is supported by a Philip J. Whitcome fellowship from the Molecular Biology Institute of University of California, Los Angeles and a scholarship from the Chinese Scholarship Council. J.Z. is a Life Science Research Foundation Postdoctoral Fellow, sponsored by the Gordon and Betty Moore Foundation. N.R.S. is supported by the Trees and Crops for the Future project. S.E.J. is an Investigator of the Howard Hughes Medical Institute.
Footnotes
The authors declare no conflict of interest.
Data deposition: The data reported in this paper have been deposited in the Gene Expression Omnibus (GEO) database, www.ncbi.nlm.nih.gov/geo (accession no. GSE86983).
This article contains supporting information online at www.pnas.org/lookup/suppl/doi:10.1073/pnas.1618019113/-/DCSupplemental.
References
- 1.Finnegan EJ, Peacock WJ, Dennis ES. DNA methylation, a key regulator of plant development and other processes. Curr Opin Genet Dev. 2000;10(2):217–223. doi: 10.1016/s0959-437x(00)00061-7. [DOI] [PubMed] [Google Scholar]
- 2.Cokus SJ, et al. Shotgun bisulphite sequencing of the Arabidopsis genome reveals DNA methylation patterning. Nature. 2008;452(7184):215–219. doi: 10.1038/nature06745. [DOI] [PMC free article] [PubMed] [Google Scholar]
- 3.Feng S, et al. Conservation and divergence of methylation patterning in plants and animals. Proc Natl Acad Sci USA. 2010;107(19):8689–8694. doi: 10.1073/pnas.1002720107. [DOI] [PMC free article] [PubMed] [Google Scholar]
- 4.Lister R, et al. Highly integrated single-base resolution maps of the epigenome in Arabidopsis. Cell. 2008;133(3):523–536. doi: 10.1016/j.cell.2008.03.029. [DOI] [PMC free article] [PubMed] [Google Scholar]
- 5.Matzke MA, Mosher RA. RNA-directed DNA methylation: An epigenetic pathway of increasing complexity. Nat Rev Genet. 2014;15(6):394–408. doi: 10.1038/nrg3683. [DOI] [PubMed] [Google Scholar]
- 6.Song QX, et al. Genome-wide analysis of DNA methylation in soybean. Mol Plant. 2013;6(6):1961–1974. doi: 10.1093/mp/sst123. [DOI] [PubMed] [Google Scholar]
- 7.Zhong S, et al. Single-base resolution methylomes of tomato fruit development reveal epigenome modifications associated with ripening. Nat Biotechnol. 2013;31(2):154–159. doi: 10.1038/nbt.2462. [DOI] [PubMed] [Google Scholar]
- 8.Zemach A, et al. Local DNA hypomethylation activates genes in rice endosperm. Proc Natl Acad Sci USA. 2010;107(43):18729–18734. doi: 10.1073/pnas.1009695107. [DOI] [PMC free article] [PubMed] [Google Scholar]
- 9.Wang H, et al. CG gene body DNA methylation changes and evolution of duplicated genes in cassava. Proc Natl Acad Sci USA. 2015;112(44):13729–13734. doi: 10.1073/pnas.1519067112. [DOI] [PMC free article] [PubMed] [Google Scholar]
- 10.Regulski M, et al. The maize methylome influences mRNA splice sites and reveals widespread paramutation-like switches guided by small RNA. Genome Res. 2013;23(10):1651–1662. doi: 10.1101/gr.153510.112. [DOI] [PMC free article] [PubMed] [Google Scholar]
- 11.Niederhuth CE, et al. Widespread natural variation of DNA methylation within angiosperms. Genome Biol. 2016;17(1):194. doi: 10.1186/s13059-016-1059-0. [DOI] [PMC free article] [PubMed] [Google Scholar]
- 12.Takuno S, Ran J-H, Gaut BS. Evolutionary patterns of genic DNA methylation vary across land plants. Nat Plants. 2016;2:15222. doi: 10.1038/nplants.2015.222. [DOI] [PubMed] [Google Scholar]
- 13.Lee EK, et al. A functional phylogenomic view of the seed plants. PLoS Genet. 2011;7(12):e1002411. doi: 10.1371/journal.pgen.1002411. [DOI] [PMC free article] [PubMed] [Google Scholar]
- 14.Huang Y, et al. Ancient origin and recent innovations of RNA Polymerase IV and V. Mol Biol Evol. 2015;32(7):1788–1799. doi: 10.1093/molbev/msv060. [DOI] [PMC free article] [PubMed] [Google Scholar]
- 15.Matzke MA, Kanno T, Matzke AJ. RNA-directed DNA methylation: The evolution of a complex epigenetic pathway in flowering plants. Annu Rev Plant Biol. 2015;66:243–267. doi: 10.1146/annurev-arplant-043014-114633. [DOI] [PubMed] [Google Scholar]
- 16.Ma L, et al. Angiosperms are unique among land plant lineages in the occurrence of key genes in the RNA-directed DNA Methylation (RdDM) pathway. Genome Biol Evol. 2015;7(9):2648–2662. doi: 10.1093/gbe/evv171. [DOI] [PMC free article] [PubMed] [Google Scholar]
- 17.Yakovlev IA, Carneros E, Lee Y, Olsen JE, Fossdal CG. Transcriptional profiling of epigenetic regulators in somatic embryos during temperature induced formation of an epigenetic memory in Norway spruce. Planta. 2016;243(5):1237–1249. doi: 10.1007/s00425-016-2484-8. [DOI] [PubMed] [Google Scholar]
- 18.Krueger F, Andrews SR. Bismark: A flexible aligner and methylation caller for Bisulfite-Seq applications. Bioinformatics. 2011;27(11):1571–1572. doi: 10.1093/bioinformatics/btr167. [DOI] [PMC free article] [PubMed] [Google Scholar]
- 19.Li X, et al. Single-base resolution maps of cultivated and wild rice methylomes and regulatory roles of DNA methylation in plant gene expression. BMC Genomics. 2012;13:300. doi: 10.1186/1471-2164-13-300. [DOI] [PMC free article] [PubMed] [Google Scholar]
- 20.Stroud H, et al. Plants regenerated from tissue culture contain stable epigenome changes in rice. eLife. 2013;2:e00354. doi: 10.7554/eLife.00354. [DOI] [PMC free article] [PubMed] [Google Scholar]
- 21.Stelpflug SC, Eichten SR, Hermanson PJ, Springer NM, Kaeppler SM. Consistent and heritable alterations of DNA methylation are induced by tissue culture in maize. Genetics. 2014;198(1):209–218. doi: 10.1534/genetics.114.165480. [DOI] [PMC free article] [PubMed] [Google Scholar]
- 22.Seymour DK, Koenig D, Hagmann J, Becker C, Weigel D. Evolution of DNA methylation patterns in the Brassicaceae is driven by differences in genome organization. PLoS Genet. 2014;10(11):e1004785. doi: 10.1371/journal.pgen.1004785. [DOI] [PMC free article] [PubMed] [Google Scholar]
- 23.Nystedt B, et al. The Norway spruce genome sequence and conifer genome evolution. Nature. 2013;497(7451):579–584. doi: 10.1038/nature12211. [DOI] [PubMed] [Google Scholar]
- 24.Vitte C, Fustier MA, Alix K, Tenaillon MI. The bright side of transposons in crop evolution. Brief Funct Genomics. 2014;13(4):276–295. doi: 10.1093/bfgp/elu002. [DOI] [PubMed] [Google Scholar]
- 25.Lechner M, et al. The correlation of genome size and DNA methylation rate in metazoans. Theory Biosci. 2013;132(1):47–60. doi: 10.1007/s12064-012-0167-y. [DOI] [PubMed] [Google Scholar]
- 26.Jansson S, Meyer-Gauen G, Cerff R, Martin W. Nucleotide distribution in gymnosperm nuclear sequences suggests a model for GC-content change in land-plant nuclear genomes. J Mol Evol. 1994;39(1):34–46. doi: 10.1007/BF00178247. [DOI] [PubMed] [Google Scholar]
- 27.Birol I, et al. Assembling the 20 Gb white spruce (Picea glauca) genome from whole-genome shotgun sequencing data. Bioinformatics. 2013;29(12):1492–1497. doi: 10.1093/bioinformatics/btt178. [DOI] [PMC free article] [PubMed] [Google Scholar]
- 28.Neale DB, et al. Decoding the massive genome of loblolly pine using haploid DNA and novel assembly strategies. Genome Biol. 2014;15(3):R59. doi: 10.1186/gb-2014-15-3-r59. [DOI] [PMC free article] [PubMed] [Google Scholar]
- 29.Uddenberg D, Akhter S, Ramachandran P, Sundström JF, Carlsbecker A. Sequenced genomes and rapidly emerging technologies pave the way for conifer evolutionary developmental biology. Front Plant Sci. 2015;6:970. doi: 10.3389/fpls.2015.00970. [DOI] [PMC free article] [PubMed] [Google Scholar]
- 30.Ujino-Ihara T, et al. Comparative analysis of expressed sequence tags of conifers and angiosperms reveals sequences specifically conserved in conifers. Plant Mol Biol. 2005;59(6):895–907. doi: 10.1007/s11103-005-2080-y. [DOI] [PubMed] [Google Scholar]
- 31.Wang XQ, Ran JH. Evolution and biogeography of gymnosperms. Mol Phylogenet Evol. 2014;75:24–40. doi: 10.1016/j.ympev.2014.02.005. [DOI] [PubMed] [Google Scholar]
- 32.Zemach A, McDaniel IE, Silva P, Zilberman D. Genome-wide evolutionary analysis of eukaryotic DNA methylation. Science. 2010;328(5980):916–919. doi: 10.1126/science.1186366. [DOI] [PubMed] [Google Scholar]
- 33.Hakman I, Fowke LC, Von Arnold S, Eriksson T. The development of somatic embryos in tissue cultures initiated from immature embryos of Picea abies (Norway Spruce) Plant Sci. 1985;38(1):53–59. [Google Scholar]
- 34.Inger Hakman SVA. Plantlet regeneration through somatic embryogenesis in Picea abies (Norway Spruce) J Plant Physiol. 1985;121(2):149–158. [Google Scholar]
- 35.Johnsen Ø, Fossdal CG, Nagy N, Mølmann J, Dæhlen OG, Skrøppa T. Climatic adaptation in Picea abies progenies is affected by the temperature during zygotic embryogenesis and seed maturation. Plant Cell Environ. 2005;28(9):1090–1102. [Google Scholar]
- 36.Ong-Abdullah M, et al. Loss of Karma transposon methylation underlies the mantled somaclonal variant of oil palm. Nature. 2015;525(7570):533–537. doi: 10.1038/nature15365. [DOI] [PMC free article] [PubMed] [Google Scholar]
- 37.Businge E, Brackmann K, Moritz T, Egertsdotter U. Metabolite profiling reveals clear metabolic changes during somatic embryo development of Norway spruce (Picea abies) Tree Physiol. 2012;32(2):232–244. doi: 10.1093/treephys/tpr142. [DOI] [PubMed] [Google Scholar]
- 38.Du J, et al. Mechanism of DNA methylation-directed histone methylation by KRYPTONITE. Mol Cell. 2014;55(3):495–504. doi: 10.1016/j.molcel.2014.06.009. [DOI] [PMC free article] [PubMed] [Google Scholar]
- 39.Cao X, Jacobsen SE. Locus-specific control of asymmetric and CpNpG methylation by the DRM and CMT3 methyltransferase genes. Proc Natl Acad Sci USA. 2002;99(Suppl 4):16491–16498. doi: 10.1073/pnas.162371599. [DOI] [PMC free article] [PubMed] [Google Scholar]
- 40.Stroud H, Greenberg MV, Feng S, Bernatavichute YV, Jacobsen SE. Comprehensive analysis of silencing mutants reveals complex regulation of the Arabidopsis methylome. Cell. 2013;152(1-2):352–364. doi: 10.1016/j.cell.2012.10.054. [DOI] [PMC free article] [PubMed] [Google Scholar]
- 41.Trapnell C, Pachter L, Salzberg SL. TopHat: Discovering splice junctions with RNA-Seq. Bioinformatics. 2009;25(9):1105–1111. doi: 10.1093/bioinformatics/btp120. [DOI] [PMC free article] [PubMed] [Google Scholar]
- 42.Trapnell C, et al. Differential gene and transcript expression analysis of RNA-seq experiments with TopHat and Cufflinks. Nat Protoc. 2012;7(3):562–578. doi: 10.1038/nprot.2012.016. [DOI] [PMC free article] [PubMed] [Google Scholar]
- 43.Martin M. Cutadapt removes adapter sequences from high-throughput sequencing reads. Bioinformatics in Action. 2012;17:10–12. [Google Scholar]
- 44.Langmead B, Trapnell C, Pop M, Salzberg SL. Ultrafast and memory-efficient alignment of short DNA sequences to the human genome. Genome Biol. 2009;10(3):R25. doi: 10.1186/gb-2009-10-3-r25. [DOI] [PMC free article] [PubMed] [Google Scholar]
Associated Data
This section collects any data citations, data availability statements, or supplementary materials included in this article.


