Significance
Type I IFN signaling is the most important innate immune response induced by viral infection. However, it is not completely known how the components of type I IFN signaling are spatiotemporally coordinated to elicit effective immune responses upon stimulation. We identified microtubule-associated protein 4 (MAP4) and butyrophilin 3A1 (BTN3A1) as novel regulators of the type I IFN signaling pathway triggered by cytosolic nucleic acids. In response to nucleic acid stimulation, BTN3A1-mediated transport of TANK-binding kinase 1 (TBK1) along microtubules facilitated the localization of TBK1 to IFN-regulatory factor 3 (IRF3) on punctate perinuclear structures, promoting IRF3 phosphorylation and IFN-β secretion. BTN3A1 activity was controlled by an upstream regulator, MAP4. Our findings could be translated into a novel therapeutic approach to a broad spectrum of nucleic acid-mediated inflammatory and viral diseases.
Keywords: BTN3A1, type I IFN signaling, TBK1–IRF3 axis, MAP4, dynein
Abstract
The innate immune system detects viral nucleic acids and induces type I interferon (IFN) responses. The RNA- and DNA-sensing pathways converge on the protein kinase TANK-binding kinase 1 (TBK1) and the transcription factor IFN-regulatory factor 3 (IRF3). Activation of the IFN signaling pathway is known to trigger the redistribution of key signaling molecules to punctate perinuclear structures, but the mediators of this spatiotemporal regulation have yet to be defined. Here we identify butyrophilin 3A1 (BTN3A1) as a positive regulator of nucleic acid-mediated type I IFN signaling. Depletion of BTN3A1 inhibits the cytoplasmic nucleic acid- or virus-triggered activation of IFN-β production. In the resting state, BTN3A1 is constitutively associated with TBK1. Stimulation with nucleic acids induces the redistribution of the BTN3A1–TBK1 complex to the perinuclear region, where BTN3A1 mediates the interaction between TBK1 and IRF3, leading to the phosphorylation of IRF3. Furthermore, we show that microtubule-associated protein 4 (MAP4) controls the dynein-dependent transport of BTN3A1 in response to nucleic acid stimulation, thereby identifying MAP4 as an upstream regulator of BTN3A1. Thus, the depletion of either MAP4 or BTN3A1 impairs cytosolic DNA- or RNA-mediated type I IFN responses. Our findings demonstrate a critical role for MAP4 and BTN3A1 in the spatiotemporal regulation of TBK1, a central player in the intracellular nucleic acid-sensing pathways involved in antiviral signaling.
Type I IFN signaling is the most critical and powerful innate immune response to viral infection. The innate immune system comprises a limited number of germline-encoded receptors called pattern-recognition receptors (PRRs), which recognize viral pathogen-associated molecular patterns (PAMPs) as “nonself.” Toll-like receptors (TLRs) were the first identified class of PRRs that recognize extracellular and endosomal PAMPs (1). Cytosolic PRRs include the retinoic acid-inducible gene I (RIG-I)–like receptors (RLRs), nucleotide-binding domain and leucine-rich repeat–containing molecules (NLRs), and intracellular sensors for DNA (2–4). The RLR family consists of three receptors: RIG-I, melanoma differentiation-associated gene 5 (MDA5), and laboratory of genetics and physiology 2 (LGP2) (5). RIG-I recognizes 5′-triphosphate RNA and short forms of dsRNA, whereas MDA5 mainly senses longer dsRNA species (6, 7). Cytosolic sensors recognizing DNA include cGMP-AMP synthase (cGAS), Mre11, IFI16, and DDX41 (3, 8, 9). Type I IFN signaling pathways initiated by these DNA or RNA sensors apparently converge on stimulator of interferon genes (STING) and mitochondrial antiviral signaling protein (MAVS), respectively. Although PRRs recruit different adaptor proteins such as STING and MAVS, both STING and MAVS activate the protein kinase TANK-binding kinase 1 (TBK1), which is essential for type I IFN expression (10, 11). Activated TBK1 phosphorylates the transcription factor IFN-regulatory factor 3 (IRF3), leading to translocation of IRF3 from the cytoplasm to the nucleus (12).
Previous reports have indicated that STING activation causes trafficking of STING from the endoplasmic reticulum (ER) to the Golgi apparatus and finally to punctate cytoplasmic structures, where TBK1 is assembled (13). STING-mediated TBK1/IRF3 is fully activated at the ER–Golgi intermediate compartment (ERGIC) (14). STING, TBK1, and IRF3, all essential components for inducing type I IFN signaling, have been shown to translocate to these punctate structures, although the mechanism responsible for the dynamic trafficking of such molecules is unknown. Microtubules form a dynamic and polarized cytoskeleton that mediates the transport of vesicles and organelles via the microtubule motor proteins kinesins and dyneins. Kinesins are a large superfamily with 45 members and are involved in trafficking events directed toward the cell periphery. By contrast, cytoplasmic dynein is used to shuttle proteins to the minus end of the microtubule, as in the case of trafficking from the ER to the Golgi (15). The detection of nucleic acids in antiviral host defense seems to depend on microtubules bound to GEF-H1 (16). Given the relation between trafficking and type I IFN signaling, it is likely that the microtubule-dependent transport of key components of the type I IFN signaling pathway is crucial for inducing antiviral immune responses. However, the dependence of microtubules on downstream components of nucleic acid sensing is currently unknown.
Here we identified regulators of the type I IFN pathway via screening for genes with functional domains previously reported in sensors or regulators associated with type I IFN signaling. We found that upon nucleic acid stimulation, butyrophilin 3A1 (BTN3A1) moves along microtubules toward the perinuclear region, where it directs the interaction of TBK1 with IRF3, thereby facilitating the phosphorylation of IRF3. We also demonstrated that the nucleic acid-dependent redistribution of BTN3A1 to the perinuclear structures is controlled by microtubule-associated protein 4 (MAP4). These findings indicate that MAP4-regulated targeting of BTN3A1 to the perinuclear region is essential for eliciting type I IFN responses against cytoplasmic nucleic acids.
Results
Identification and Characterization of BTN3A1 as a Novel Regulator of Type I IFN Responses.
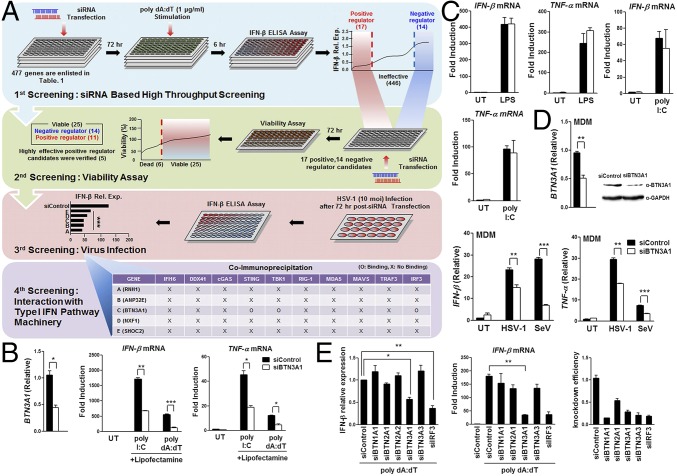
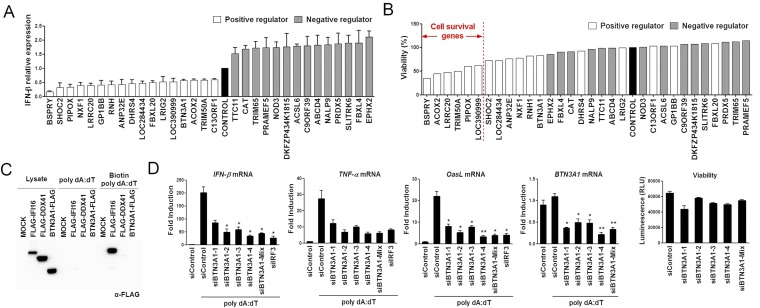
We first attempted to identify regulatory genes required for the activation of type I IFN responses. Screening an siRNA library targeting IFN-inducible genes or genes with functional domains implicated in innate immune responses (Table S1) identified BTN3A1 as a positive regulator of type I IFN responses. The depletion of BTN3A1 significantly attenuated IFN-β secretion in virus-infected or dsDNA-stimulated cells without affecting cell viability (Fig. 1A and Fig. S1). BTN3A1 specifically interacted with STING, TBK1, and IRF3 (Fig. 1A). Unlike the previously identified cytosolic DNA sensors IFI16 and DDX41, BTN3A1 did not exhibit DNA binding activity (Fig. S1C).
Table S1.
siRNA library used in this study
| Characteristic | Gene number |
| NACHT domain | 24 |
| LRR domain | 200 |
| PADD_DAPIN domain | 22 |
| CARD domain | 33 |
| SPRY domain | 80 |
| BIR domain | 8 |
| IFN-inducible genes | 60 |
| Location: peroxisome | 50 |
| Total | 477 |
The siRNA library was designed to target IFN-inducible genes and genes with functional domains implicated in regulating innate immune responses such as the NACHT domain, leucine-rich repeat domain, DAPIN domain, CARD domain, B30.2/SPRY domain, BIR domain, and genes localized to the peroxisome. The siRNA library includes 477 genes. Each gene is targeted by four independent siRNAs to reduce off-target effects.
Fig. 1.
Identification of BTN3A1. (A) A schematic representation of the four screening steps. (i) ELISA analysis of IFN-β in THP-1 cells transfected with siRNA (Table S1) and then stimulated with dsDNA. (ii) Viability analysis of THP-1 cells silenced with siRNA targeting putative candidate genes by measuring cellular ATP levels. (iii) ELISA and real-time PCR analysis of IFN-β in THP-1 cells treated with siRNA targeting selected positive regulator candidate genes, followed by infection with 10 MOI HSV-1. (iv) Immunoprecipitation and immunoblot analysis of HEK293T cells cotransfected with the indicated combinations of expression plasmids. (B) Quantitative (q)RT-PCR analysis of BTN3A1, IFN-β, and TNF-α mRNA in THP-1 cells transfected with nontargeting siRNA (siControl) or BTN3A1-targeting siRNA (siBTN3A1) that were subsequently left untreated (UT) or treated with intracellular poly I:C or poly dA:dT for 4 h. (C) qRT-PCR analysis of IFN-β and TNF-α mRNA in THP-1 cells treated with siControl or siBTN3A1, followed by incubation with LPS or extracellular poly I:C for 2 h. (D) qRT-PCR analysis of IFN-β and TNF-α mRNA in MDMs silenced by siControl or siBTN3A1 using electroporation, followed by infection with HSV-1 (10 MOI) or SeV (1 MOI) for 4 h. Immunoblot and qRT-PCR analyses of the knockdown of endogenous BTN3A1 in MDMs treated with siControl or siBTN3A1 were also performed. (E) ELISA of IFN-β protein and qRT-PCR analysis of IFN-β, BTN isoforms, and IRF3 mRNA in THP-1 cells treated with the indicated siRNA and then stimulated with dsDNA for 6 h. *P < 0.05, **P < 0.01, and ***P < 0.001 versus cells transfected with siControl (Student’s t test). Data are representative of three independent experiments (mean ± SD).
Fig. S1.
Screening, identification, and validation of potential regulators of the type I IFN signaling pathway. (A) The putative positive and negative regulators identified through primary siRNA screening detected by ELISA analysis of IFN-β production in THP-1 cells treated with the siRNA listed in Table S1 for 72 h and then stimulated with poly dA:dT for 6 h. (B) The viability of positive and negative regulators was assessed using the indicated siRNA-transfected THP-1 cells by measuring the level of cellular ATP. (C) SDS/PAGE of extracts of HEK293T cells expressing mock, FLAG-IFI16, FLAG-DDX41, or BTN3A1-FLAG and treated with poly dA:dT or biotinylated poly dA:dT for 2 h, followed by immunoprecipitation using streptavidin beads. (D) qRT-PCR analysis of IFN-β, TNF-α, OasL, and BTN3A1 mRNA in THP-1 cells treated with control siRNA, siRNAs targeting BTN3A1, or siRNA targeting IRF3, followed by stimulation with poly dA:dT for 4 h. siIRF3 serves as an internal positive control. Viability analysis of the indicated siRNA-transfected THP-1 cells via measuring intracellular ATP levels. RLU, relative light units. *P < 0.05 and **P < 0.01 versus cells transfected with control siRNA (Student’s t test). Data are representative of three independent experiments (mean ± SD).
To characterize the physiological function of BTN3A1 in nucleic acid-induced responses, we used a knockdown strategy involving four distinct siRNAs targeting the human BTN3A1 gene. Differentiated THP-1 cells treated with these siRNAs exhibited a considerable reduction in BTN3A1 expression. Moreover, the mRNA expression level of IFN-β, TNF-α, and OasL induced by dsDNA was significantly decreased in BTN3A1-silenced cells. All four siRNAs targeting BTN3A1 had remarkable silencing effects without affecting cell viability (Fig. S1D). Thus, a pool of four siRNAs was used for further study. The knockdown of BTN3A1 led to a substantial reduction in the production of IFN-β and TNF-α upon induction by cytosolic nucleic acids (Fig. 1B). The knockdown of BTN3A1 did not inhibit the production of IFN-β and TNF-α when coupled with stimulation by the TLR ligands LPS and poly I:C (Fig. 1C). These results indicate that BTN3A1 is specifically involved in the cytosolic nucleic acid-mediated type I IFN response. To determine whether the BTN3A1-mediated induction of type I IFNs occurs under more physiological conditions, a similar analysis was conducted in primary cells derived from human peripheral blood mononuclear cells (PBMCs). We infected monocyte-derived macrophages (MDMs) with the DNA virus HSV-1 or the RNA virus Sendai. Reduced expression levels of IFN-β and TNF-α were observed in BTN3A1 knockdown MDMs, supporting the hypothesis that BTN3A1 acts as a positive regulator of type I IFN responses induced by cytosolic DNA and RNA (Fig. 1D). The human butyrophilin family consists of BTN1A1, BTN2A1, BTN2A2, BTN2A3, BTN3A1, BTN3A2, and BTN3A3. Among these family members, only siBTN3A1 effectively reduced IFN-β mRNA and protein, revealing the specificity of BTN3A1 in type I IFN responses (Fig. 1E).
BTN3A1 Regulates the Phosphorylation of IRF3.
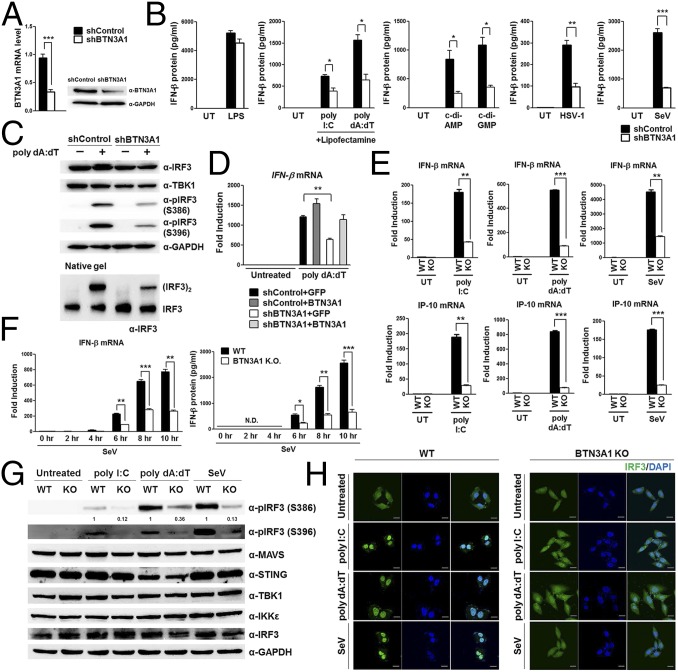
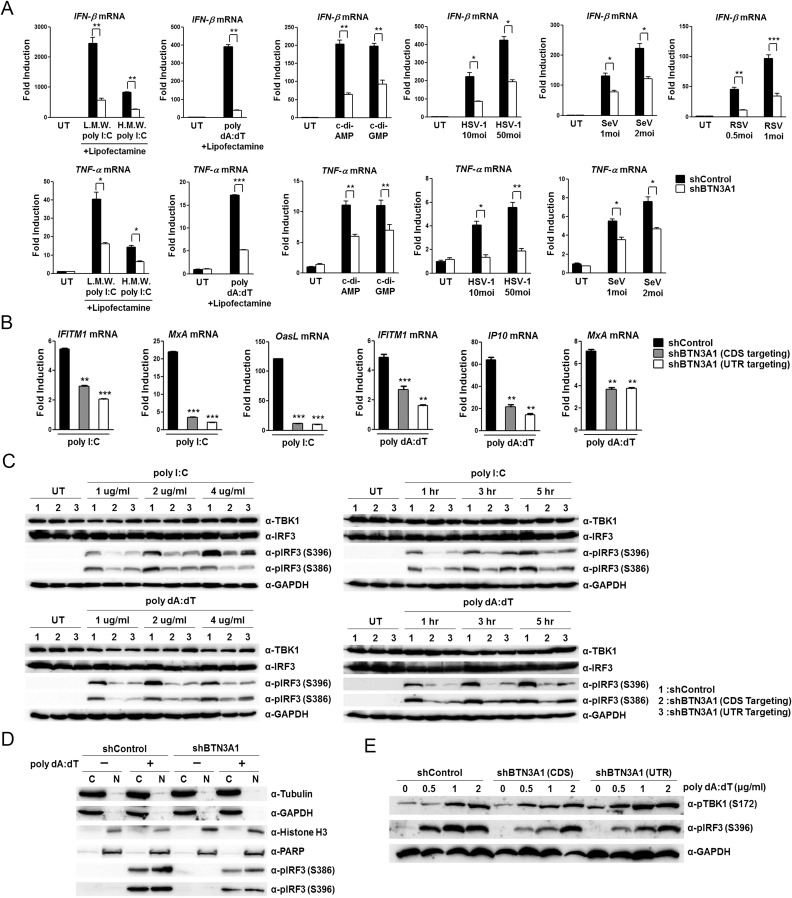
To investigate the functional mechanism of BTN3A1 in nucleic acid-mediated type I IFN signaling, we generated stable THP-1 cell lines in which BTN3A1 was knocked down using lentiviral shRNA constructs. The reduced expression of BTN3A1 was confirmed at the protein and mRNA levels (Fig. 2A). THP-1 cells treated with shBTN3A1 exhibited impaired production of IFN-β compared with THP-1 cells treated with shControl following treatment with poly I:C, poly dA:dT, STING ligands, c-di-AMP, and c-di-GMP or infection with HSV-1 or Sendai virus (Fig. 2B). MDA5 preferentially detects the long form of poly I:C (>1,000 bp), whereas RIG-I preferentially senses its short form (>300 and <1,000 bp) (6, 7). BTN3A1 was essential for triggering type I IFN responses to both the long and short forms of poly I:C (Fig. S2A), suggesting that BTN3A1 acts downstream of RNA detection. Similarly, the knockdown of BTN3A1 suppressed cytoplasmic poly dA:dT-, c-di-AMP–, or c-di-GMP–induced activation of IFN-β, suggesting that the regulatory function of BTN3A1 is downstream of STING. BTN3A1 was crucial for the production of IFN-β during challenges with the DNA virus HSV-1 or the RNA viruses SeV and RSV (Fig. S2A). The effect of BTN3A1 was extended to the induction of TNF-α, an indicator of NF-κB activation, and IFN-stimulatory genes (Fig. S2 A and B). Collectively, these observations suggest that BTN3A1 controls type I IFN signaling downstream of RNA sensors and STING.
Fig. 2.
BTN3A1 controls the phosphorylation of IRF3. (A) qRT-PCR and immunoblot analyses of THP-1 cells treated with shRNA with a scrambled sequence (shControl) or with shRNA targeting BTN3A1 (shBTN3A1). (B) ELISA of IFN-β in THP-1 cells transfected with shControl or shBTN3A1 and then left untreated or stimulated with LPS, poly I:C, poly dA:dT, c-di-AMP, or c-di-GMP or infected with HSV-1 or SeV for 6 h. (C) SDS/PAGE and native PAGE in THP-1 cells transfected with shControl or shBTN3A1, followed by stimulation for 3 h with poly dA:dT. (D) qRT-PCR analysis of IFN-β in THP-1 cells treated with shControl or shBTN3A1 and then stimulated for 4 h with poly dA:dT after reconstitution with GFP or BTN3A1. (E) qRT-PCR analysis of IFN-β and IP-10 mRNA in wild-type (WT) and BTN3A1 knockout (KO) HeLa cells transfected with poly I:C or poly dA:dT or infected with SeV for 4 h. (F) qRT-PCR analysis of IFN-β in both WT and BTN3A1 KO cells inoculated with SeV at the indicated time periods. N.D., not detected. (G) WT and BTN3A1 KO HeLa cells were stimulated for 3 h with poly I:C, poly dA:dT, or SeV. Cell lysates were analyzed by immunoblotting. (H) Confocal immunofluorescence microscopy of IRF3 (green) after stimulation with poly I:C or poly dA:dT or infection with SeV for 3 h in WT and BTN3A1 KO HeLa cells. The nuclei of the cells were stained with DAPI (blue). Original magnification, 40×. (Scale bars, 20 μm.) Data are presented as the mean ± SD of three independent experiments. *P < 0.05, **P < 0.01, and ***P < 0.001 (Student’s t test). The band intensities of phosphorylated IRF3 (S386) were quantified by densitometry and are shown relative to the intensities of the corresponding total IRF3 bands.
Fig. S2.
BTN3A1 is a positive regulator of type I IFN signaling. (A) qRT-PCR analysis of IFN-β and TNF-α mRNA in THP-1 cells treated with either shControl or shBTN3A1, followed by transfection with low-molecular-weight (L.M.W.) poly I:C, high-molecular-weight (H.M.W.) poly I:C, poly dA:dT, c-di-AMP, or c-di-GMP or by infection with HSV-1, SeV, or RSV for 6 h. (B) qRT-PCR analysis of IFITM1, MxA, OasL, and IP-10 mRNA in THP-1 cells treated with control shRNA or shRNA targeting the coding sequence (CDS) or 3′ UTR of BTN3A1, followed by stimulation with poly I:C or poly dA:dT for 4 h. (C) Immunoblot analysis of total and phosphorylated IRF3 in THP-1 cells treated as described in B, followed by stimulation with poly I:C or poly dA:dT at the indicated doses and time periods. (D) Immunoblot assay for α-tubulin, GAPDH, histone H3, PARP, and phospho-IRF3 in the cytosol (C) or nucleus (N) of THP-1 cells treated with shControl or shBTN3A1 and then stimulated with poly dA:dT for 3 h. (E) Immunoblot analysis of phosphorylated TBK1 and IRF3 in THP-1 cells treated with shControl or shRNAs targeting the CDS or 3′ UTR of BTN3A1, followed by stimulation for 3 h with poly dA:dT at the indicated doses. Data are presented as the mean ± SD of three independent experiments. *P < 0.05, **P < 0.01, and ***P < 0.001 (Student’s t test).
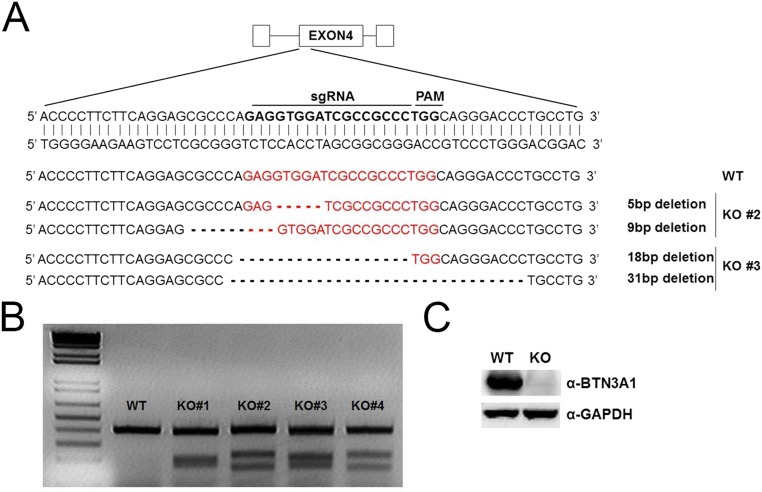
During the nucleic acid-mediated immune response, the production of IFN-β depends on the TBK1-induced phosphorylation of IRF3, followed by IRF3 dimerization and finally nuclear translocation of IRF3. The phosphorylation of S386 and S396 is critical for IRF3 dimerization and its nuclear translocation, respectively (17). The decreased phosphorylation of IRF3 at both sites was observed in shBTN3A1-transduced THP-1 cells with poly dA:dT (Fig. 2C). Similar results were obtained when shBTN3A1-transduced cells were incubated with various doses of poly I:C or poly dA:dT for different durations (Fig. S2C). Cell-fractionation analysis revealed that BTN3A1 knockdown significantly inhibited the nuclear accumulation of phosphorylated IRF3 (Fig. S2D). Notably, BTN3A1 knockdown did not affect TBK1 phosphorylation, suggesting that BTN3A1 might be a downstream effector of phospho-TBK1 (Fig. S2E). The reduced activation of IFN-β due to BTN3A1 knockdown was rescued by exogenous BTN3A1 expression (Fig. 2D). To verify the data obtained from the RNAi-mediated knockdown approach, we generated BTN3A1 knockout HeLa cell lines by using the CRISPR-Cas9 genome-editing system (Fig. S3). Knockout of BTN3A1 resulted in decreased IFN-β and IP-10 induction in nucleic acid-stimulated and virus-infected cells (Fig. 2E). In addition, we detected less IFN-β expression in BTN3A1 knockout cells during the time course of infection (Fig. 2F). Phosphorylation of IRF3 was impaired in the BTN3A1 knockout cells (Fig. 2G). Knockout of BTN3A1 inhibited the cytoplasmic-to-nuclear translocation of IRF3 that is induced by nucleic acid treatment or virus infection (Fig. 2H). We obtained essentially the same results as observed with the RNAi-mediated knockdown system, with more pronounced phenotypes in the knockout approach.
Fig. S3.
BTN3A1 knockout using a CRISPR-Cas9 approach. (A) Schematic depiction of the BTN3A1 locus. The sequence targeted by sgRNA is indicated by bold letters. Sequences of the targeted BTN3A1 alleles of the two obtained BTN3A1 knockout cell lines. Red letterings represent sgRNA and protospacer adjacent motif (PAM) site. (B) T7E1 cleavage assay for mutation detection in individual clones. (C) Immunoblot assay of the extracts from WT and BTN3A1 KO HeLa cells.
BTN3A1 Directs the Interaction of TBK1 with IRF3.
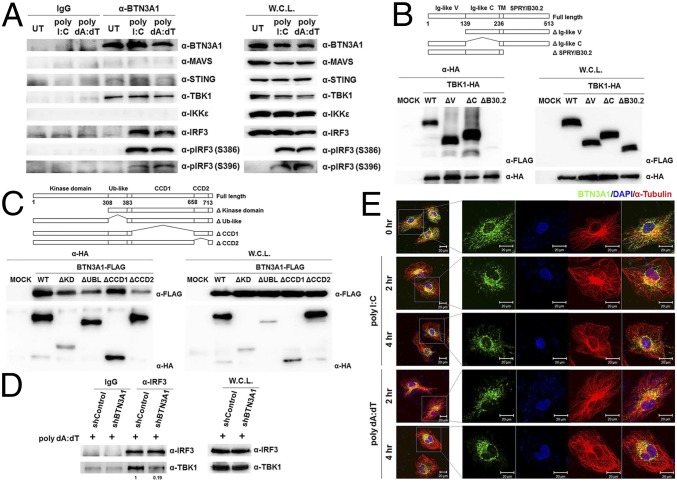
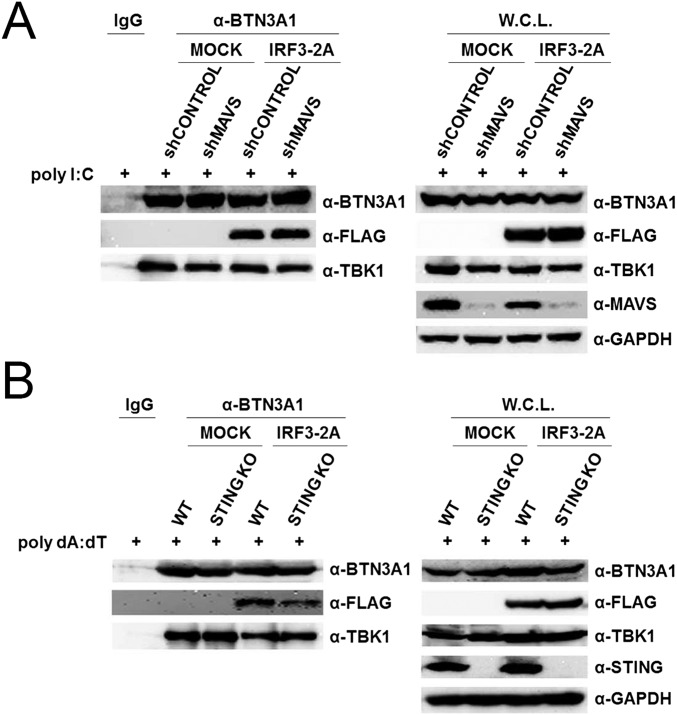
To determine whether endogenous BTN3A1 associates with components of the type I IFN signaling pathway, polyclonal antibodies against the B30.2 domain of BTN3A1 were raised in rabbits. THP-1 cells were left unstimulated or stimulated with poly I:C or poly dA:dT. Cell lysates were immunoprecipitated with anti-BTN3A1 antibody and then subjected to immunoblot analysis. We found that BTN3A1 interacts with TBK1 in both the resting and activated states. The association of BTN3A1 with IRF3 was undetectable in resting THP-1 cells, but their interaction was detected following nucleic acid stimulation. Neither MAVS nor IKKε was coprecipitated with BTN3A1 in a detectable manner. A weak interaction between BTN3A1 and STING was observed (Fig. 3A). We mapped the interacting domains of BTN3A1 and TBK1 using coimmunoprecipitation experiments with a series of deletion mutants lacking each functional domain. We found that the SPRY/B30.2 domain of BTN3A1 is important for the interaction with TBK1 (Fig. 3B). On the other hand, the binding interface of BTN3A1 was mapped to the CCD2 domain of TBK1 (Fig. 3C). Because BTN3A1 interacts with both TBK1 and IRF3 in nucleic acid-stimulated cells, we explored the possibility that BTN3A1 influences TBK1–IRF3 association. Knockdown of BTN3A1 markedly decreased the endogenous association between TBK1 and IRF3 in response to dsDNA stimulation, suggesting that BTN3A1 may act as an adaptor molecule in the formation of the TBK1–IRF3 complex, facilitating both the phosphorylation of IRF3 and signal transduction (Fig. 3D). Phosphorylation of MAVS and STING recruits IRF3 for its phosphorylation and activation by TBK1 (18). To determine whether TBK1–IRF3–BTN3A1 complexes still form in MAVS- or STING-deficient cells, we expressed IRF3-2A mutant in which Ser385 and Ser386 are substituted with alanine in MAVS knockdown or STING knockout cells. Because IRF3-2A mutant is unable to form a homodimer, it associates with its interacting partners more strongly (18). Stimulation of these cells with poly I:C or poly dA:dT led to the association of IRF3-2A-FLAG with endogenous BTN3A1 and TBK1 (Fig. S4 A and B, respectively). These results suggest that both MAVS and STING are dispensable for the formation of BTN3A1–TBK1–IRF3 complexes.
Fig. 3.
BTN3A1 mediates TBK–IRF3 association. (A) Immunoassay of extracts from THP-1 cells untreated or treated with poly I:C or poly dA:dT for 3 h, followed by immunoprecipitation with anti-IgG or anti-BTN3A1 antibodies and immunoblot analysis (antibodies, labeled Right). W.C.L., immunoblot analysis of whole-cell lysates without immunoprecipitation. (B and C) Schematic representations of BTN3A1 and its deletion mutants (B) and TBK1 and its deletion mutants (C). TM, transmembrane domain. The extracts from HEK293T cells cotransfected with the indicated combinations of expression plasmids were immunoprecipitated followed by immunoblot analysis. (D) Immunoblot analysis (anti-IRF3 and anti-TBK1) of lysates from THP-1 cells treated with shControl or shBTN3A1 and stimulated for 3 h with dsDNA, before (Left) or after (Right) immunoprecipitation with anti-IRF3. (E) Confocal microscopic analysis of BTN3A1 (green) and α-tubulin (red) in HeLa cells stimulated with poly I:C or poly dA:dT for the indicated durations. Densitometry was performed with ImageJ software (NIH), and relative coimmunoprecipitated TBK1 band intensity was normalized to immunoprecipitated IRF3 and TBK1 lysate and quantified with respect to shControl set to 1.0.
Fig. S4.
MAVS and STING are dispensable for the formation of the BTN3A1–TBK1–IRF3 complex. (A) Immunoassay of extracts from transfected HEK293T cells treated with shControl or shMAVS and stimulated with poly I:C for 3 h. (B) WT and STING KO cells were transfected with either mock or IRF3A-2A and stimulated with poly dA:dT for 3 h. Cellular lysates were immunoprecipitated with anti-IgG or anti-BTN3A1 antibodies, followed by immunoblotting with the indicated antibodies.
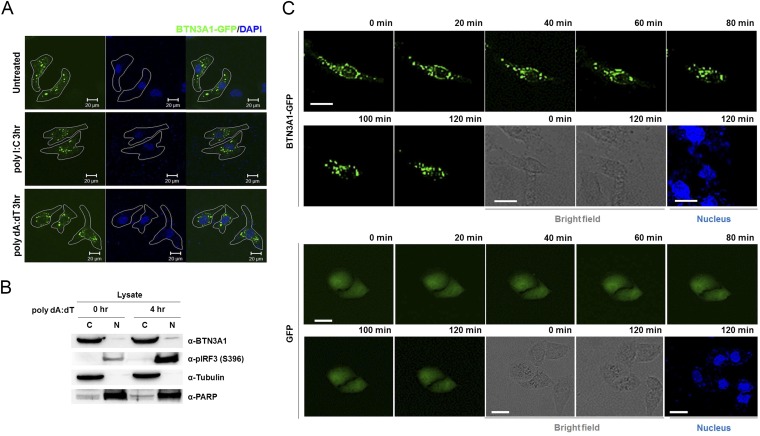
BTN3A1 localizes in the plasma membrane to present nonpeptide prenyl pyrophosphate antigens to γδ T cells (19). We analyzed the subcellular distribution of BTN3A1 by confocal microscopy in HeLa cells that were unstimulated or stimulated with poly I:C or poly dA:dT. In unstimulated HeLa cells, BTN3A1 exhibited a vesicle-like intracellular structure and colocalized with the tubulin diffused throughout the cytoplasm. Interestingly, BTN3A1 redistributed from a diffused expression pattern to a predominantly perinuclear localization after stimulation with poly I:C or poly dA:dT (Fig. 3E). Ectopically expressed BTN3A1-GFP also displayed a similar subcellular distribution to endogenous BTN3A1 (Fig. S5A). Nuclear and cytoplasmic fractionation revealed that BTN3A1 is predominantly localized to the cytoplasm regardless of nucleic acid stimulation (Fig. S5B). To gain insight into the cellular function and dynamics of BTN3A1, we used live-cell imaging in HeLa cells expressing BTN3A1-GFP. Live-cell imaging revealed that BTN3A1 moves toward the perinuclear region under poly dA:dT stimulation, whereas the distribution of GFP remains largely unaffected (Fig. S5C).
Fig. S5.
BTN3A1 translocates to the perinuclear region in response to nucleic acid stimulation. (A) Confocal microscopy analysis of BTN3A1-GFP in HeLa cells stimulated with poly I:C or poly dA:dT for 3 h. Nuclei were counterstained with DAPI (blue). Original magnification, 40×. (B) Immunoblotting for α-tubulin, PARP, phospho-IRF3, and BTN3A1 in the cytosol or nucleus of THP-1 cells stimulated with poly dA:dT for 4 h. Immunoblotting for phospho-IRF3 revealed dsDNA-induced activation. (C) Live-cell imaging in HeLa cells transfected with BTN3A1-GFP followed by stimulation with poly dA:dT for 2 h. Frames were captured every 20 min for a total period of 120 min. (Scale bars, 30 μm.)
Microtubule-Dependent Transport of BTN3A1 to the Perinuclear Region.
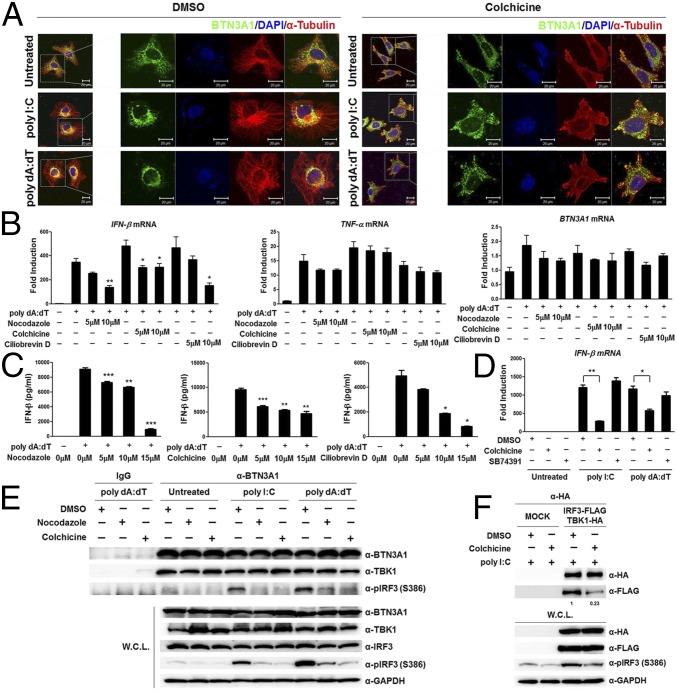
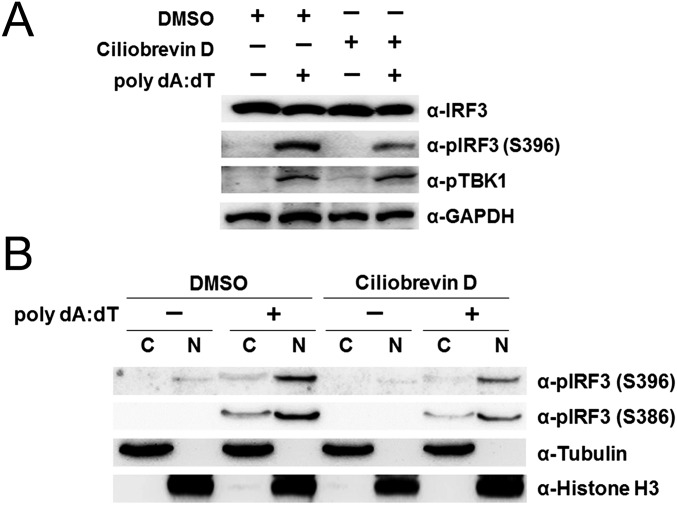
Based on the observation that the activation of type I IFN signaling by nucleic acids promotes the spatial rearrangement of BTN3A1 and BTN3A1 colocalizes with tubulin, we asked whether microtubules control the subcellular localization of BTN3A1 upon nucleic acid stimulation. We examined the effect of microtubule depolymerization on the localization of BTN3A1 in nucleic acid-stimulated cells. Colchicine induced microtubule depolymerization, as visualized by immunostaining with anti-tubulin antibody. Accordingly, the localization of BTN3A1 to the perinuclear region was impaired in nucleic acid-stimulated cells (Fig. 4A, Right). Colchicine-induced depolymerization of microtubules inhibited IFN-β production in response to dsDNA in a dose-dependent manner. Furthermore, to confirm that the effects on IFN-β production were due to microtubule disruption rather than a nonspecific effect of colchicine, we used nocodazole, another microtubule-depolymerizing reagent, and obtained essentially the same results (Fig. 4 B and C). Microtubule motors traffic vesicular cargo along microtubule tracks, with the dynein motor mediating retrograde movement and the kinesin motor mediating anterograde movement. We investigated the possible involvement of microtubule motors in the movement of BTN3A1 toward the perinuclear region. Treatment of cells with the dynein inhibitor ciliobrevin D caused a significant decrease in the level of IFN-β in response to dsDNA (Fig. 4 B and C), whereas treatment of cells with the kinesin inhibitor SB743921 did not influence IFN-β production after stimulation with poly I:C or poly dA:dT (Fig. 4D). Neither colchicine, nocodazole, nor ciliobrevin D significantly affected the production of TNF-α in response to poly dA:dT, suggesting that these drugs did not affect the NF-κB–dependent induction of proinflammatory cytokines (Fig. 4B). The treatment of cells with ciliobrevin D suppressed the phosphorylation of IRF3 but not TBK1 (Fig. S6A). The inhibition of dynein by ciliobrevin D did not interfere with the nuclear translocation of phospho-IRF3 (Fig. S6B). These data suggest that the dynein-mediated retrograde movement of BTN3A1 to the perinuclear region is required for triggering type I IFN signaling and that BTN3A1 functions downstream of TBK1 phosphorylation and upstream of IRF3 phosphorylation.
Fig. 4.
Microtubule-dependent trafficking of BTN3A1 is critical to triggering type I IFN signaling. (A) Immunocytochemistry to reveal the subcellular location of BTN3A1 (green) and α-tubulin (red) in HeLa cells pretreated with DMSO or colchicine (10 μM) and then left unstimulated or stimulated for 3 h with poly I:C or poly dA:dT. (B) qRT-PCR analysis of IFN-β and TNF-α mRNA in THP-1 cells pretreated with increasing doses of nocodazole, colchicine, or ciliobrevin D and then left unstimulated (−) or stimulated for 4 h with poly dA:dT (+). (C) ELISA of IFN-β in the culture supernatants of THP-1 cells pretreated with increasing doses of nocodazole, colchicine, or ciliobrevin D for 1 h before stimulation with poly dA:dT (+), followed by analysis 6 h later. (D) qRT-PCR analysis of IFN-β mRNA expression in DMSO-treated, 10 μM colchicine-treated, or 10 μM SB74391 (a kinesin-specific inhibitor)-treated THP-1 cells in the presence of poly I:C or poly dA:dT for 4 h. (E) Immunoprecipitation with anti-IgG or anti-BTN3A1 antibodies and immunoblotting with the indicated antibodies in THP-1 cells pretreated with DMSO, nocodazole, or colchicine for 1 h and then unstimulated or stimulated with poly I:C or poly dA:dT for 3 h. (F) Immunoprecipitation and immunoblot analyses of extracts from HEK293T cells transfected with plasmids containing IRF3-FLAG and TBK-HA and then treated with DMSO or colchicine for 1 h, followed by stimulation for 3 h with poly I:C. *P < 0.05, **P < 0.01, and ***P < 0.001 (Student’s t test). Data are representative of three independent experiments (mean ± SD). Densitometry was performed with ImageJ software, and relative coimmunoprecipitated IRF3-FLAG band intensity was normalized to immunoprecipitated TBK-HA and quantified with respect to shControl set to 1.0.
Fig. S6.
Dynein is involved in the induction of type I IFN signaling. (A) Immunoblot analysis of extracts from THP-1 cells pretreated with DMSO or 10 μM ciliobrevin D, followed by stimulation with poly dA:dT for 4 h. (B) Immunoblot of α-tubulin, histone H3, and phospho-IRF3 in the cytosolic and nuclear fractions of DMSO- or 10 μM ciliobrevin D-treated THP-1 cells after stimulation with poly dA:dT for 4 h.
Intriguingly, BTN3A1 appears to be constitutively complexed with TBK1, regardless of nucleic acid challenge or microtubule integrity. The BTN3A1–IRF3 interactions, however, were reduced upon disrupting microtubule integrity by drug treatment (Fig. 4E). Moreover, the treatment of cells with colchicine interfered with the interaction of TBK1 and IRF3 and subsequently suppressed the phosphorylation of IRF3 (Fig. 4F). These findings indicate that BTN3A1 plays a role in trafficking TBK1 to the perinuclear region, where BTN3A1 mediates the interaction between TBK1 and IRF3.
MAP4 Is Essential for Type I IFN Signaling by Controlling the Trafficking of BTN3A1.
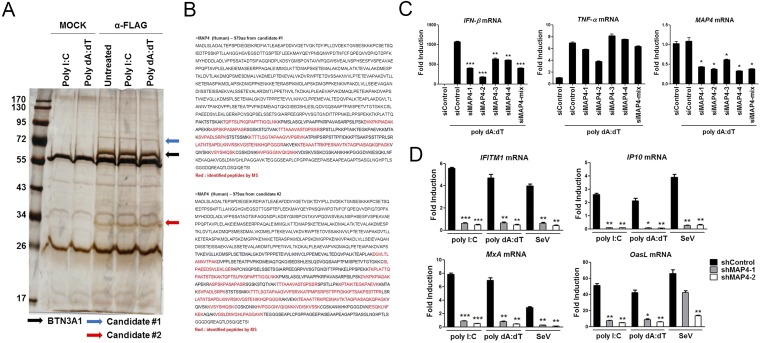
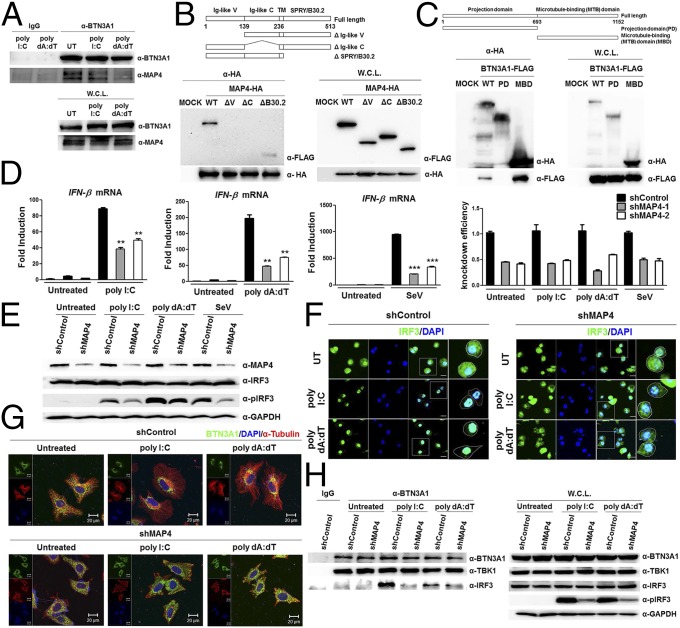
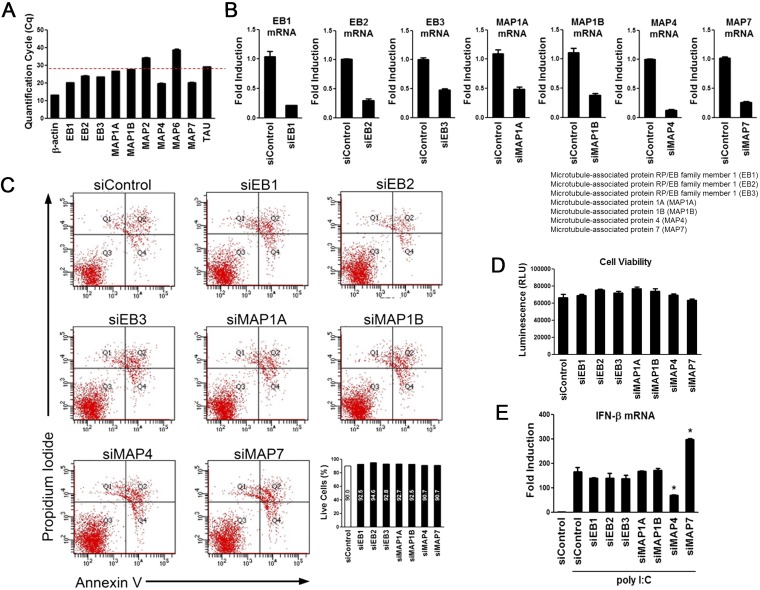
We addressed the question of what governs the trafficking of BTN3A1 in response to nucleic acids. To identify the novel interacting partners of BTN3A1, we performed coimmunoprecipitation followed by LC/MS analysis, which allowed the identification of MAP4 (Fig. S7 A and B). Coimmunoprecipitation followed by immunoblot analysis revealed that BTN3A1 binds endogenous MAP4 (Fig. 5A), confirming our LC/MS analysis results. We mapped the interacting domains of BTN3A1 and MAP4 using coimmunoprecipitation experiments. B30.2 domain of BTN3A1 alone could bind to MAP4, although the full-length BTN3A1 showed a stronger interaction with MAP4 (Fig. 5B). We found that the microtubule-binding domain of MAP4 is involved in the association with BTN3A1 (Fig. 5C). To investigate whether MAP4 directly associates with type I IFN response in the nucleic acid-triggered immune response, we measured the effect of MAP4 on the induction of IFN-β. The shRNA-mediated knockdown of MAP4 led to the reduction of IFN-β production upon nucleic acid stimulation, including poly I:C and poly dA:dT, and SeV infection (Fig. 5D). Essentially the same results were obtained via an siRNA-mediated knockdown approach (Fig. S7C). Consistent with this result, the reduction of the mRNA of several IFN-stimulated genes, such as IFITM1, IP-10, MxA, and OasL, was observed in MAP4-depleted cells (Fig. S7D). IRF3 activation, was also defective in nucleic acid-stimulated or SeV-infected shMAP4 cells (Fig. 5E). Moreover, confocal microscopy analyses indicated that IRF3 is localized in the cytoplasm in unstimulated shControl cells but redistributed predominantly to the nucleus after nucleic acid stimulation. In shMAP4 cells, IRF3 was largely retained in the cytoplasm, even after nucleic acid stimulation (Fig. 5F). Because MAP4 has been shown to regulate microtubule-based transport (20), we assessed whether MAP4 could affect the trafficking of BTN3A1 in response to nucleic acid stimulation. Knockdown of MAP4 inhibited the nucleic acid-induced retrograde movement of BTN3A1 to the perinuclear region (Fig. 5G). The strong association between endogenous BTN3A1 and IRF3 that was observed in shControl cells with nucleic acid stimulation was considerably diminished in shMAP4 cells (Fig. 5H). Next, we examined the specificity of MAP4 in type I IFN signaling. Because MAP2, MAP6, and TAU showed very low expression levels, we excluded them for further analysis (Fig. S8A). siRNA-mediated depletion of MAP4 or other MAPs did not affect cell viability (Fig. S8 B–D). Among the other MAPs, only MAP4 appeared to be required for optimal expression level of IFN-β in response to RNA stimulation (Fig. S8E).
Fig. S7.
Identification of MAP4 as a BTN3A1-interacting partner. (A) Silver staining of FLAG-associated proteins purified with a FLAG antibody from HEK293T cells transfected with a mock vector or BTN3A1-FLAG and then stimulated with poly I:C or poly dA:dT for 3 h. (B) Peptides identified by LC/MS spectrometry. (C) qRT-PCR analysis of IFN-β, TNF-α, and MAP4 mRNA in THP-1 cells treated with control siRNA or siRNAs targeting MAP4 and then stimulated with poly dA:dT for 4 h. (D) qRT-PCR analysis of IFITM1, IP-10, MxA, and OasL mRNA in THP-1 cells transfected with shControl or shMAP4 and then stimulated with poly I:C or poly dA:dT or infected with SeV for 6 h. *P < 0.05, **P < 0.01, and ***P < 0.001 versus cells transfected with control siRNA (Student’s t test). Data are representative of three independent experiments (mean ± SD).
Fig. 5.
MAP4 governs the subcellular trafficking of BTN3A1. (A) Immunoassay of extracts from THP-1 cells untreated or treated with poly I:C or poly dA:dT for 3 h, followed by immunoprecipitation with anti-IgG or anti-BTN3A1 antibodies and immunoblot analysis with anti-BTN3A1 and anti-MAP4. (B and C) Schematic representations of BTN3A1 (B) and MAP4 derivatives (C). Immunoprecipitation analysis of HEK293T cells cotransfected with the indicated combinations of expression plasmids, followed by immunoblotting with anti-HA. (D) qRT-PCR analysis of IFN-β and MAP4 mRNA in THP-1 cells transfected with shControl or shMAP4 and left untreated or stimulated with poly I:C or poly dA:dT or infected with SeV for 4 h. (E) Immunoblot analysis of extracts from THP-1 cells treated as described in D. (F) Confocal microscopy examining the nuclear localization of IRF3 in unstimulated or poly I:C- or poly dA:dT-stimulated THP-1 cells pretreated with shControl or shMAP4. (Scale bars, 20 μm.) (G) Confocal microscopic images of BTN3A1 (green) and α-tubulin (red) in HeLa cells transfected with shControl or shRNA targeting MAP4 (shMAP4) and then left untreated or stimulated with poly I:C or poly dA:dT for 3 h. (H) Immunoassay of extracts from THP-1 cells treated with shControl or shMAP4 and stimulated with poly I:C or poly dA:dT for 3 h, followed by immunoprecipitation with anti-IgG or anti-BTN3A1 antibodies and immunoblot analysis with the indicated antibodies. Data are presented as the mean ± SD of three independent experiments. **P < 0.01 and ***P < 0.001 (Student’s t test).
Fig. S8.
Specificity of MAP4 in type I IFN signaling. (A) qRT-PCR analysis of expression of various microtubule-associated genes in HeLa cells. (B) siRNA-mediated knockdown of EB1, EB2, EB3, MAP1A, MAP1B, MAP4, and MAP7 in HeLa cells. Knockdown efficiency was measured by qRT-PCR. (C) Evaluation of apoptosis by Annexin V-FITC and propidium iodide (PI) dual-staining assay and flow cytometry analysis after siRNA treatment for 3 d. (D) Viability analysis of the indicated siRNA-transfected HeLa cells through measuring intracellular ATP levels. (E) qRT-PCR analysis of IFN-β expression in HeLa cells treated with the indicated siRNAs and then stimulated with poly I:C for 4 h. *P < 0.05 versus cells transfected with control siRNA (Student’s t test). Data are representative of three independent experiments (mean ± SD).
BTN3A1 Interacts with Dynein for Trafficking to the Perinuclear Region.
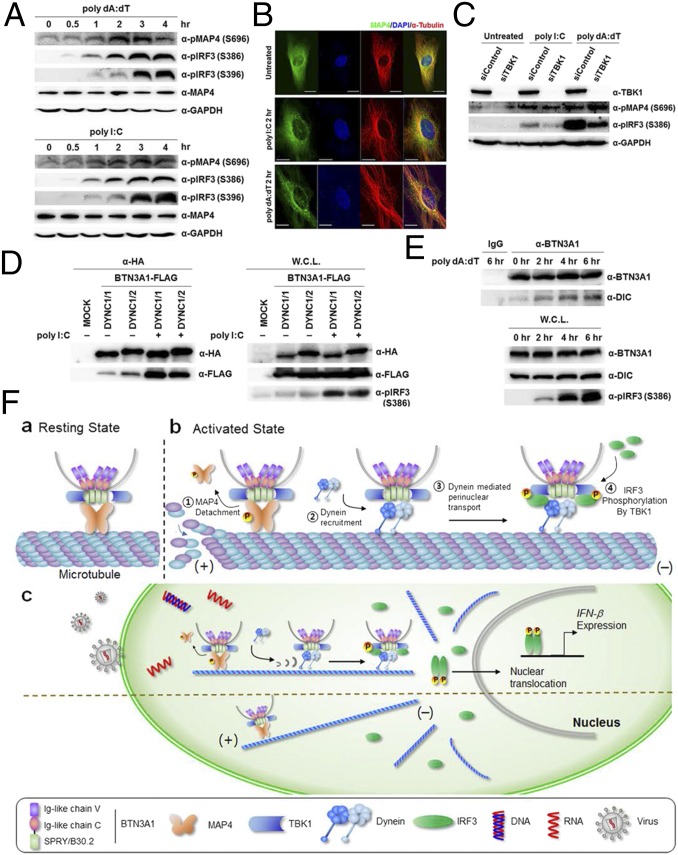
Next, we explored the functional role of MAP4 in mediating BTN3A1 trafficking in response to nucleic acids. MAP proteins compete with motor proteins for microtubule binding (21), and the phosphorylation of MAPs induces the detachment of MAPs from microtubules (22). We observed that the phosphorylation of MAP4 occurs following nucleic acid stimulation and peaked at 3 h of incubation (Fig. 6A). Immunofluorescence staining showed that in the resting state, MAP4 is evenly dispersed throughout the cytoplasm, but MAP4 was found in small punctate aggregates after nucleic acid challenge, which could imply that it undergoes a spatial redistribution upon nucleic acid stimulation (Fig. 6B). To test whether TBK1 phosphorylates MAP4 to drive disassociation of MAP4 from microtubules, we silenced TBK1 using siRNA. Knockdown of TBK1 did not affect the phosphorylation level of MAP4 but substantially decreased the pIRF3 level, suggesting that MAP4 is not a substrate for TBK1-mediated phosphorylation (Fig. 6C). Interestingly, we found that both dynein intermediate chain (DYNC) 1/1 and 1/2 interact with BTN3A1 in both the exogenously and endogenously expressed proteins, and their interaction increased upon treatment with nucleic acids (Fig. 6 D and E, respectively). These results support the notion that BTN3A1 moves to the perinuclear region through dynein upon nucleic acid stimulation.
Fig. 6.
Phosphorylation of MAP4 is essential for the interaction of BTN3A1 with dynein. (A) Immunoblot analysis of total and phosphorylated MAP4 as well as phosphorylated IRF3 as an indicator of nucleic acid-mediated activation in THP-1 cells stimulated with poly I:C or poly dA:dT for the indicated duration. (B) Confocal microscopy analysis of MAP4 (green) and α-tubulin (red) in HeLa cells transfected with poly I:C or poly dA:dT for 2 h. (Scale bars, 20 μm.) (C) Immunoblot analysis of phosphorylation of MAP4 and IRF3 in siControl and siTBK1 cells after poly I:C or poly dA:dT stimulation. (D) Immunoprecipitation analysis of HEK293T cells cotransfected with the indicated combinations of expression plasmids, followed by immunoblotting with anti-HA. DYNC, dynein intermediate chain. (E) Immunoprecipitation with anti-IgG or anti-BTN3A1 antibodies followed by immunoblot analysis for BTN3A1 and dynein in THP-1 cells treated with poly dA:dT for the indicated times. (F) Roles for BTN3A1 and MAP4 in regulating type I IFN signaling.
Discussion
Our study suggests a critical role for MAP4-regulated spatial arrangement of BTN3A1 in the activation of the TBK1–IRF3 signaling axis triggered by cytoplasmic RNA and DNA. In the resting state, BTN3A1 associates with TBK1, and the BTN3A1–TBK1 complex binds to MAP4 on microtubules. Upon nucleic acid stimulation, MAP4 is phosphorylated and released from the microtubules, thereby ensuring its availability for binding to the motor protein dynein. The BTN3A1–TBK1 complex then moves along microtubules to the perinuclear region, where TBK1 phosphorylates IRF3, leading to the nuclear translocation of IRF3 and the induction of type I interferons (Fig. 6F).
To date, identified regulators of the type I IFN pathway have been shown to control sensors or adaptors upstream of the TBK1–IRF3 signaling axis in the nucleic acid-mediated innate immune response. These regulators are specific to a particular signaling pathway for certain types of nucleic acids. Nucleic acids from pathogens are detected by PRRs, including TLRs, RLRs, and cytosolic DNA sensors (23, 24). Although nucleic acids in the endosome are recognized by TLRs and those in the cytosol are detected by RLRs or DNA sensors, all receptors require the TBK1–IRF3 axis to induce type I IFN signaling (24). We found that BTN3A1 is required for the TBK1-mediated phosphorylation of IRF3, a downstream event in nucleic acid sensing for antiviral defense. Because TBK1 is a central node of the regulatory network required to trigger innate immune responses against various types of nucleic acids, BTN3A1 could serve as a master regulator of type I IFN signaling elicited by both DNA and RNA virus infection. This is consistent with the finding that the depletion of either BTN3A1 or its regulator MAP4 abrogated the activation of the type I IFN response. Notably, we found that BTN3A1 controls the TBK1–IRF3 axis activated by viral nucleic acids in the cytosol but not in the endosome, suggesting that sensing cytosolic nucleic acids drives BTN3A1 toward a functional form to initiate regulation.
A few reports have described a link between microtubules and innate immunity (16, 25). Our study shows that MAP4 regulates the dynein-based transport of BTN3A1 to the perinuclear region. Motor proteins and MAPs compete for the same binding sites on tubulin (21), and the phosphorylation of MAPs decreases their binding to tubulin (26). In light of the results of previous reports and our observations, it is likely that cells initiate type I IFN signaling in response to nucleic acid stimuli by replacing MAP4 with dynein for binding to microtubules, which allows BTN3A1 to recruit TBK1 to the perinuclear region. However, at present, it is unclear how MAP4 is phosphorylated upon nucleic acid stimulation.
The transport of signaling components to the perinuclear region appears to be an important process in triggering type I IFN signaling (13). The importance of the regulated trafficking of signaling molecules is underscored by the findings that Shigella inhibits STING signaling by blocking its translocation from the ER to ERGIC and that the ERGIC/Golgi trafficking mechanism of STING is deregulated in genetic autoinflammatory diseases (14). Our work demonstrates that the transport of BTN3A1-mediated TBK1 to the perinuclear region is critical for the induction of IFN-β gene expression in response to nucleic acid stimulation. The complex containing BTN3A1, TBK1, and IRF3 in the perinuclear region might involve a yet-to-be-identified compartmentalization wherein BTN3A1 acts as an adaptor molecule for the rapid and effective activation of type I IFN signaling. Our findings provide a spatiotemporal model for IRF3 activation and could lead to novel therapeutic strategies for nucleic acid-mediated inflammatory diseases.
Materials and Methods
Reagents and Antibodies.
Poly I:C, poly dA:dT, LPS, nocodazole, colchicine, and human anti-FLAG antibody were purchased from Sigma; c-di-GMP and c-di-AMP were obtained from InvivoGen; and the cytoplasmic dynein inhibitor ciliobrevin D was obtained from Merck. Human anti-IRF3, -PARP, and kinesin inhibitor -SB743921 were from Santa Cruz; anti-TBK1, –phospho-IRF3 (S396), –phospho-TBK1, and -STING were from Cell Signaling; anti-BTN3A1, –phospho-IRF3 (S386), -MAVS, -IKKε, -histone H3, and -MAP4 were from Abcam; anti-GAPDH and α-tubulin were from AbFrontier; and anti-HA was from Covance.
All experiments involving human blood were approved by the Institutional Review Board of Seoul National University (SNUIRB no. E1304-001-023). Written informed consent was obtained from the blood donors with the approval of the Ethics Committee of the Korean Red Cross.
Other Materials and Methods.
Other materials and methods used in this study are described in SI Materials and Methods.
SI Materials and Methods
Cells and Viruses.
HEK293T and HeLa cells were cultured in DMEM supplemented with 10% (vol/vol) FBS (Thermo) in a 5% (vol/vol) CO2 incubator. THP-1 cells were maintained in RPMI medium containing 10% (vol/vol) FBS and treated with 100 nM phorbol 12-myristate 13-acetate (PMA) to induce differentiation. Peripheral blood mononuclear cells (PBMCs) were obtained from human blood by centrifuged for 20 min at 800 × g using Ficoll-Paque Plus (Amersham Healthcare). Monocytes were isolated from PBMCs using a magnetic bead-based positive-selection kit (IMag) and an anti-human CD14 antibody (BD Biosciences). To generate monocyte-derived macrophages (MDMs), CD14-positive cells were treated with human recombinant interleukin 4 (hrIL-4; R&D Systems) and human recombinant granulocyte–macrophage colony-stimulating factor (hrGM-CSF; R&D Systems) for 5 d. All experiments involving human blood were approved by the Institutional Review Board of Seoul National University (SNUIRB no. E1304-001-023).
HSV-1 was propagated on Vero cells. Viral stocks were prepared by infecting Vero cells at a multiplicity of infection (MOI) of 0.01. The infected cells were incubated at 37 °C for 48 h. After three freeze–thaw cycles, cell debris was removed by centrifugation and the supernatant was collected. Titers were determined via plaque assays on Vero cells. Aliquots of viral stock were stored at −80 °C. Sendai virus was propagated in 10- to 11-d-old chicken eggs that were inoculated intraallantoically with 106 Sendai virus. The eggs were then incubated at 37 °C for 72 h, and allantoic fluid was harvested and pelleted by centrifugation. The remaining allantoic fluid was aliquoted and stored at −80 °C until use.
RNA Interference Screening.
RNAi screening used an siRNA library from Dharmacon that targeted 477 annotated human genes. The screen was performed on 96-well plates. THP-1 cells were seeded on 96-well plates at a density of 50,000 per well and incubated for 24 h in 100 µL complete RPMI media containing 100 nM PMA. Differentiated THP-1 cells were treated with 60 nM siRNA complexed with 0.15 µL DharmaFECT 4. At 72 h, poly dA:dT with Lipofectamine 2000 was added to each well. After 6 h of incubation, the medium was harvested and the concentration of IFN-β was measured using commercial ELISA kits (Antigenix America) according to the manufacturer’s instructions. The experiment was performed in triplicate.
RNAi Experiments.
The siRNAs were chemically synthesized by Dharmacon. The targeting sequences used were as follows: BTN3A1-1 sense, 5′-GAACAAAGCACAAGAGUGA-3′; BTN3A1-2 sense, 5′-GGAGAAGUAUCCAGUAUGC-3′; BTN3A1-3 sense, 5′-GAGAGACAUUCAGCCUAUA-3′; BTN3A1-4 sense, 5′-CUAUUUGUCCAGCGUGAAA-3′. MAP4-1 sense, 5′-GGAGUAGAAGGGAGCGAUA-3′; MAP4-2 sense, 5′-GGAGAGAUAAAGCGGGACU-3′; MAP4-3 sense, 5′-GAUGAUGUUGUGGGAGAAA-3′; and MAP4-4 sense, 5′-GAGUCAAAGAAGAAACCGU-3′. A negative control oligonucleotide was purchased from Dharmacon. HeLa cells were transfected with 40 nM siRNA using DharmaFECT 1 according to the manufacturer’s protocol. Differentiated THP-1 cells were treated with 60 nM siRNA via DharmaFECT 4. At 72 h transfection, the cells were used for further experiments. For shRNA treatment, double-stranded oligonucleotides corresponding to the target sequences were cloned into the pLKO.1 plasmid. Lentiviral particles were generated by cotransfecting HEK293T cells with the packaging plasmids. Supernatants were collected 48 h later and added to THP-1 or HeLa cells.
Cell Fractionation.
THP-1 cells were stimulated with poly dA:dT and harvested after 4 h. Nuclear–cytoplasmic fractionation was conducted using a Nuclear/Cytosol Fractionation Kit (BioVision) according to the manufacturer’s protocol.
Fluorescence Microscopy.
THP-1 cells, HeLa cells, or MDMs were plated on coverslips in 12-well dishes and grown overnight before stimulation with synthetic nucleic acids or inoculation with HSV-1 at the indicated times. Cells were fixed in 3.7% formaldehyde and made permeable in 0.1% Triton X-100. Coverslips were preincubated in 2% BSA in PBS and stained with primary antibodies (1:100 dilution) followed by Alexa Fluor 488 and Alexa Fluor 568 secondary antibodies (1:400 dilution) and DAPI. Cells were analyzed with a Zeiss LSM 700 laser scanning confocal microscope.
Protein Expression and Purification.
His-tagged mutant human BTN3A1 protein (B30.2) was expressed in Escherichia coli Rosetta (λDE3) (Novagen). The Rosetta cells were grown in broth containing ampicillin at 37 °C to an OD600 of 2.0 and rapidly cooled on ice to 16 °C. After induction with 0.2 mM isopropyl-beta-d-thiogalactopyranoside (Ducheba), the cells were allowed to grow for 24 h at 16 °C and then resuspended in lysis buffer and sonicated. For protein capture, recombinant B30.2-carboxypeptidase D (CPD)-6×His was partially purified using an immobilized Ni2+ column; 250 mM imidazole was used to elute the B30.2–CPD fusion proteins. The addition of phytate activated the protease activity of CPD, and thus only recombinant B30.2 was released from the fusion proteins.
In Vivo Pull-Down Assay.
HEK293T cells transfected with the indicated expression plasmids were treated with 1 μg/mL poly dA:dT or biotin-labeled poly dA:dT using polyethylenimine (PEI) and cultured for 2 h. The cells were lysed in Nonidet P-40 lysis buffer and subjected to ultracentrifugation. Cleared lysate was incubated with streptavidin beads overnight. The beads were washed five times with lysis buffer, eluted with 2× sample buffer, separated on a 10% polyacrylamide gel, and analyzed by immunoblotting with anti-FLAG antibodies.
Coimmunoprecipitation and Immunoblot Analysis.
HEK293T cells were transfected with the indicated plasmids using PEI for 48 h. The cells were lysed in Nonidet P-40 buffer containing protease inhibitors (1 mM PMSF and 10 μM leupeptin), and cell lysates were precipitated with a FLAG antibody overnight. On the following day, protein G was added and incubated for 1 h. Beads were washed five times with lysis buffer, and proteins were released by 2× sample buffer after boiling and then analyzed by SDS/PAGE. For endogenous coimmunoprecipitation experiments, differentiated THP-1 cells or HeLa cells stimulated with synthetic nucleic acids using Lipofectamine 2000 were lysed in lysis buffer (15 mM Tris, 120 mM NaCl, 25 mM KCl, 2 mM EGTA, 2 mM EDTA, 0.5% Triton X-100, and 0.1 mM DTT), and the lysates were incubated with an appropriate amount of the indicated antiserum or control IgG. The subsequent procedures were carried out as described above.
Cell Viability Assay.
Differentiated THP-1 cells were incubated with the indicated siRNA and assayed for viability 3 d later using a CellTiter-Glo Luminescent Cell Viability Assay (Promega) according to the manufacturer’s instructions.
Quantitative Real-Time PCR.
THP-1 and HeLa cells were stimulated with various reagents or viruses. Total RNA was extracted using TRIzol reagent (Life Technologies) and reverse-transcribed with ReverTra Ace (Toyobo) according to the manufacturer’s instructions. Real-time PCR was performed using the following primers: hIFN-β, sense 5′-ATGACCAACAAGTGTCTCCTCC-3′, reverse 5′-GCTCATGGAAAGAGCTGTAGTG-3′; hβ-actin, sense 5′-CATGTACGTTGCTATCCAGGC-3′, reverse 5′-CTCCTTAATGTCACGCACGAT-3′; hTNF-α, sense 5′-TCCTACCAGACCAAGGTCAA-3′, reverse 5′-AGACCCCTCCCAGATAGATG-3′; hBTN3A1, sense 5′-TTTCCATCGCAGACCCCTTC-3′, reverse 5′-TCCTCCAGGAGCTTCACTCT-3′; hBTN1A1, sense 5′-TAGTGGCTGTGGCTGTCATC-3′, reverse 5′-TCAACTGCATGCAAGGTAGC-3′; hBTN2A1, sense 5′-CCACGGTTGGAGAAAACACT-3′, reverse 5′-GTTTTCCTGGGCTGTGATGT-3′; hBTN2A2, sense 5′-TCCTCCTTCTCAGCCTGTGT-3′, reverse 5′-TCCTCCATCTGCTCCTCTGT-3′; hBTN3A3, sense 5′-CTCTCACTGAGCCCAGAACC-3′, reverse 5′-AGGATCGGGGGAACTCTCTA-3′; hOasL, sense 5′-GGACCGTGGAGGAGTTTCTG-3′, reverse 5′-GAGCCCACCTTGACTACCTTC-3′; hIP-10, sense 5′-TGACTCTAAGTGGCATTCAAGGAG-3′, reverse 5′-TTTTTCTAAAGACCTTGGATTAACAGG-3′; hIFITM1, sense 5′-CCCCCAGCACCATCCTTC-3′, reverse 5′-ACCCCGTTTTTCCTGTATTATCTGT-3′; hMxA, sense 5′-AGGTCAGTTACCAGGACTAC-3′, reverse 5′-ATGGCATTCTGGGCTTTATT-3′; and hMAP4, sense 5′-CACTCCTAGCCAATGGTGGT-3′, reverse 5′-GTATCAGCTGTCGCACTGGA-3′.
Time-Dependent Imaging in Live Cells.
The fluorescent signals in HeLa cells transfected with GFP or BTN3A1-GFP were observed after treatment with synthetic DNA using an IN Cell Analyzer 2000 (GE Healthcare Life Sciences) with 20× objective lenses (Olympus) at various time points (0 to 120 min). Green fluorescence (λex/λem 495/521 nm; excitation and emission, respectively) in the cells was monitored every 20 min, and blue fluorescence (λex/λem 358/461 nm) from the nuclei was observed after Hoechst 33342 treatment at 2 h. The cells were incubated and preserved at 37 °C in 5% CO2 for real-time imaging. The acquisition images were modified by pseudocoloring, fluorescence intensity, and background elimination processes using the software supplied with the IN Cell Analyzer 2000.
Generation of BTN3A1 Knockout Cell Lines.
We used the CRISPR-Cas9 genome-editing system to generate BTN3A1 knockout HeLa cells. We used a lentiviral CRISPR-Cas9 vector. Five pairs of single guide RNA (sgRNA) targeting BTN3A1 were designed and transfected into HEK293T cells. Two days after transfection, we collected the supernatants with lentiviral particles. The lentiviral supernatants were transferred into HeLa cells. HeLa cells were selected with 1 μg/mL puromycin for 1 wk. Cells were subsequently cloned by limiting dilution, and individual clones were subjected to immunoblotting to confirm the depletion of the target protein, BTN3A1. The genomic DNA was also extracted from each clone for PCR amplification. Targeted cleavage was evaluated at the endogenous loci by T7E1 assay. To further determine the mutational spectra, amplification bands were cloned using the TOPcloner Blunt Core Kit (Enzynomics) and then Sanger-sequenced to verify the individual mutations.
Statistical Analysis.
Prism version 5.0 software was used (GraphPad Software). All values are expressed as the mean ± SD. Differences were determined to be significant at P < 0.05 by the two-tailed Student’s t test.
Acknowledgments
We thank Jin-Hyun Ahn (Sungkyunkwan University) for providing HSV-1, and Moon Jung Song (Korea University) for SEV. RSV was a gift from Man Ki Song at the International Vaccine Institute. This work was supported by Grant IBS-R008-D1 from the Institute for Basic Science of the Ministry of Science, ICT, and Future Planning of Korea (to K.A.). The Global PhD Fellowship Program through the National Research Foundation of Korea was funded by the Ministry of Education Grant (2012-015863) (to Y.H.).
Footnotes
The authors declare no conflict of interest.
This article is a PNAS Direct Submission. G.N.B. is a Guest Editor invited by the Editorial Board.
This article contains supporting information online at www.pnas.org/lookup/suppl/doi:10.1073/pnas.1615287113/-/DCSupplemental.
References
- 1.Medzhitov R, Preston-Hurlburt P, Janeway CA., Jr A human homologue of the Drosophila Toll protein signals activation of adaptive immunity. Nature. 1997;388(6640):394–397. doi: 10.1038/41131. [DOI] [PubMed] [Google Scholar]
- 2.Kato H, Takahasi K, Fujita T. RIG-I-like receptors: Cytoplasmic sensors for non-self RNA. Immunol Rev. 2011;243(1):91–98. doi: 10.1111/j.1600-065X.2011.01052.x. [DOI] [PubMed] [Google Scholar]
- 3.Keating SE, Baran M, Bowie AG. Cytosolic DNA sensors regulating type I interferon induction. Trends Immunol. 2011;32(12):574–581. doi: 10.1016/j.it.2011.08.004. [DOI] [PubMed] [Google Scholar]
- 4.Martinon F, Tschopp J. NLRs join TLRs as innate sensors of pathogens. Trends Immunol. 2005;26(8):447–454. doi: 10.1016/j.it.2005.06.004. [DOI] [PubMed] [Google Scholar]
- 5.Yoneyama M, Fujita T. RNA recognition and signal transduction by RIG-I-like receptors. Immunol Rev. 2009;227(1):54–65. doi: 10.1111/j.1600-065X.2008.00727.x. [DOI] [PubMed] [Google Scholar]
- 6.Kato H, et al. Differential roles of MDA5 and RIG-I helicases in the recognition of RNA viruses. Nature. 2006;441(7089):101–105. doi: 10.1038/nature04734. [DOI] [PubMed] [Google Scholar]
- 7.Hornung V, et al. 5′-Triphosphate RNA is the ligand for RIG-I. Science. 2006;314(5801):994–997. doi: 10.1126/science.1132505. [DOI] [PubMed] [Google Scholar]
- 8.Sun L, Wu J, Du F, Chen X, Chen ZJ. Cyclic GMP-AMP synthase is a cytosolic DNA sensor that activates the type I interferon pathway. Science. 2013;339(6121):786–791. doi: 10.1126/science.1232458. [DOI] [PMC free article] [PubMed] [Google Scholar]
- 9.Kondo T, et al. DNA damage sensor MRE11 recognizes cytosolic double-stranded DNA and induces type I interferon by regulating STING trafficking. Proc Natl Acad Sci USA. 2013;110(8):2969–2974. doi: 10.1073/pnas.1222694110. [DOI] [PMC free article] [PubMed] [Google Scholar]
- 10.Ishikawa H, Ma Z, Barber GN. STING regulates intracellular DNA-mediated, type I interferon-dependent innate immunity. Nature. 2009;461(7265):788–792. doi: 10.1038/nature08476. [DOI] [PMC free article] [PubMed] [Google Scholar]
- 11.Seth RB, Sun L, Ea CK, Chen ZJ. Identification and characterization of MAVS, a mitochondrial antiviral signaling protein that activates NF-kappaB and IRF3. Cell. 2005;122(5):669–682. doi: 10.1016/j.cell.2005.08.012. [DOI] [PubMed] [Google Scholar]
- 12.Fitzgerald KA, et al. IKKepsilon and TBK1 are essential components of the IRF3 signaling pathway. Nat Immunol. 2003;4(5):491–496. doi: 10.1038/ni921. [DOI] [PubMed] [Google Scholar]
- 13.Saitoh T, et al. Atg9a controls dsDNA-driven dynamic translocation of STING and the innate immune response. Proc Natl Acad Sci USA. 2009;106(49):20842–20846. doi: 10.1073/pnas.0911267106. [DOI] [PMC free article] [PubMed] [Google Scholar]
- 14.Dobbs N, et al. STING activation by translocation from the ER is associated with infection and autoinflammatory disease. Cell Host Microbe. 2015;18(2):157–168. doi: 10.1016/j.chom.2015.07.001. [DOI] [PMC free article] [PubMed] [Google Scholar]
- 15.Caviston JP, Holzbaur EL. Microtubule motors at the intersection of trafficking and transport. Trends Cell Biol. 2006;16(10):530–537. doi: 10.1016/j.tcb.2006.08.002. [DOI] [PubMed] [Google Scholar]
- 16.Chiang HS, et al. GEF-H1 controls microtubule-dependent sensing of nucleic acids for antiviral host defenses. Nat Immunol. 2014;15(1):63–71. doi: 10.1038/ni.2766. [DOI] [PMC free article] [PubMed] [Google Scholar]
- 17.Mori M, et al. Identification of Ser-386 of interferon regulatory factor 3 as critical target for inducible phosphorylation that determines activation. J Biol Chem. 2004;279(11):9698–9702. doi: 10.1074/jbc.M310616200. [DOI] [PubMed] [Google Scholar]
- 18.Liu S, et al. Phosphorylation of innate immune adaptor proteins MAVS, STING, and TRIF induces IRF3 activation. Science. 2015;347(6227):aaa2630. doi: 10.1126/science.aaa2630. [DOI] [PubMed] [Google Scholar]
- 19.Vavassori S, et al. Butyrophilin 3A1 binds phosphorylated antigens and stimulates human γδ T cells. Nat Immunol. 2013;14(9):908–916. doi: 10.1038/ni.2665. [DOI] [PubMed] [Google Scholar]
- 20.Semenova I, et al. Regulation of microtubule-based transport by MAP4. Mol Biol Cell. 2014;25(20):3119–3132. doi: 10.1091/mbc.E14-01-0022. [DOI] [PMC free article] [PubMed] [Google Scholar]
- 21.Hagiwara H, Yorifuji H, Sato-Yoshitake R, Hirokawa N. Competition between motor molecules (kinesin and cytoplasmic dynein) and fibrous microtubule-associated proteins in binding to microtubules. J Biol Chem. 1994;269(5):3581–3589. [PubMed] [Google Scholar]
- 22.Drewes G, Ebneth A, Mandelkow EM. MAPs, MARKs and microtubule dynamics. Trends Biochem Sci. 1998;23(8):307–311. doi: 10.1016/s0968-0004(98)01245-6. [DOI] [PubMed] [Google Scholar]
- 23.Akira S, Uematsu S, Takeuchi O. Pathogen recognition and innate immunity. Cell. 2006;124(4):783–801. doi: 10.1016/j.cell.2006.02.015. [DOI] [PubMed] [Google Scholar]
- 24.Kawasaki T, Kawai T, Akira S. Recognition of nucleic acids by pattern-recognition receptors and its relevance in autoimmunity. Immunol Rev. 2011;243(1):61–73. doi: 10.1111/j.1600-065X.2011.01048.x. [DOI] [PMC free article] [PubMed] [Google Scholar]
- 25.Misawa T, et al. Microtubule-driven spatial arrangement of mitochondria promotes activation of the NLRP3 inflammasome. Nat Immunol. 2013;14(5):454–460. doi: 10.1038/ni.2550. [DOI] [PubMed] [Google Scholar]
- 26.Avila J, Domínguez J, Díaz-Nido J. Regulation of microtubule dynamics by microtubule-associated protein expression and phosphorylation during neuronal development. Int J Dev Biol. 1994;38(1):13–25. [PubMed] [Google Scholar]


