

Abstract
Seipin is an endoplasmic reticulum (ER) membrane protein implicated in lipid droplet (LD) biogenesis and mutated in severe congenital lipodystrophy (BSCL2). Here, we show that seipin is stably associated with nascent ER–LD contacts in human cells, typically via one mobile focal point per LD. Seipin appears critical for such contacts since ER–LD contacts were completely missing or morphologically aberrant in seipin knockout and BSCL2 patient cells. In parallel, LD mobility was increased and protein delivery from the ER to LDs to promote LD growth was decreased. Moreover, while growing LDs normally acquire lipid and protein constituents from the ER, this process was compromised in seipin‐deficient cells. In the absence of seipin, the initial synthesis of neutral lipids from exogenous fatty acid was normal, but fatty acid incorporation into neutral lipids in cells with pre‐existing LDs was impaired. Together, our data suggest that seipin helps to connect newly formed LDs to the ER and that by stabilizing ER–LD contacts seipin facilitates the incorporation of protein and lipid cargo into growing LDs in human cells.
Keywords: electron microscopy, lipid storage, lipodystrophy, membrane contact sites
Subject Categories: Membrane & Intracellular Transport
Introduction
Lipid droplets (LDs) are ubiquitous cellular organelles consisting of a core of neutral lipids surrounded by a phospholipid monolayer (Walther & Farese, 2012; Pol et al, 2014). They are key players in regulating lipid metabolism by storing lipids at times of excess and releasing them upon demand. The currently favored model of LD nucleation is that lipids accumulate within the ER bilayer in spatially restricted subdomains and bud off into the cytoplasm, with a proteomic fingerprint distinct from that of the ER (Ohsaki et al, 2014; Pol et al, 2014). LD growth is facilitated by localized activity of biosynthetic enzymes on LDs (Wilfling et al, 2013). For example, acyl‐CoA synthetase 3 (ACSL3), which generates long‐chain acyl‐CoAs, was shown to control the number and size of LDs (Kassan et al, 2013), likely by activating fatty acids for neutral lipid synthesis on LDs (Fujimoto et al, 2007; Poppelreuther et al, 2012; Wilfling et al, 2013). After initial formation, LDs retain a functional connectivity with the ER, as manifested by their dynamic cargo exchange (Jacquier et al, 2011). Furthermore, live cell imaging demonstrated that LDs move in concert with the ER (Targett‐Adams et al, 2003; Guimaraes et al, 2015), and electron microscopy (EM) revealed an intimate morphological relationship between the ER and LDs (Robenek et al, 2006; Ohsaki et al, 2008; Wolinski et al, 2011). However, proteins responsible for the maintenance of ER–LD contacts are so far unknown.
Seipin/BSCL2 was first identified as a causative gene of Berardinelli–Seip congenital lipodystrophy 2 (BSCL2), the most severe form of lipodystrophy in humans, characterized by near complete lack of adipose tissue and subsequent metabolic disturbances (Magré et al, 2001). While studies in mammalian systems indicate that the protein plays a key role in adipocyte development (Payne et al, 2008; Chen et al, 2009), its molecular function remains open. Seipin is a ubiquitously expressed, oligomeric ER transmembrane protein (Binns et al, 2010). It is evolutionarily conserved, with yeast Saccharomyces cerevisiae Fld1 being the most extensively studied seipin ortholog. In the absence of seipin/Fld1, LDs appear smaller and aggregated, and sometimes supersized (Szymanski et al, 2007; Fei et al, 2008; Boutet et al, 2009). Several studies have identified aberrant protein composition of LDs in yeast cells lacking Fld1 (Fei et al, 2011; Wang et al, 2014; Cartwright et al, 2015; Grippa et al, 2015). Fld1 interacts with and stabilizes another ER membrane protein Ldb16 (Wang et al, 2014), which collaborates with Fld1 to control LD biogenesis and is localized to ER–LD junctions by immuno‐EM (Grippa et al, 2015). Moreover, in Ldb16Δ yeast ER–LD contacts were enlarged, with conspicuous ER protrusions surrounding aggregated LDs (Grippa et al, 2015).
In this study, we characterize ER–LD contacts and their functionality in wild‐type and seipin‐deficient human cells, including primary BSCL2 patient cells and cell lines harboring WT‐ or BSCL2‐causing mutant seipin. We provide evidence that seipin is stably localized to ER–LD contact sites and regulates the contacts of newly formed LDs with the ER, facilitating the transfer of protein and lipid cargo between them.
Results
WT‐seipin but not BSCL2‐mutant rescues aberrant LD biogenesis of seipin knockout cells
To investigate the role of seipin in LD biogenesis, we knocked out seipin from human A431 cells using the CRISPR/Cas9 system (Appendix Fig S1). As reported in yeast (Szymanski et al, 2007) and human cells (Boutet et al, 2009), perturbation of seipin function resulted in aberrant LD morphology. After a 3‐day delipidation followed by 1‐h oleic acid (OA) incubation to induce LD biogenesis, LDs in seipin knockout (SKO) cells were more numerous and heterogeneous in size. While some SKO cells harbored 1–4 large LDs, the vast majority of LDs in SKO were markedly smaller than in control cells (Figs 1A and B, and EV1A). These represented newly formed LDs, as they were not detected after delipidation (Fig EV1B). Similar aberrant LD morphology was also observed in SKO cells grown in normal growth medium (Fig EV1C). The content of neutral lipids was decreased in SKO cells (Fig EV1D), analogously to BSCL2 patient cells (Boutet et al, 2009).
Figure 1. WT‐seipin‐GFP rescues aberrant LD biogenesis and is enriched at ER–LD contact sites.

- A431 WT and SKO cells −/+ GFP‐fused WT or A212P‐seipin were delipidated, treated with OA for 1 h, fixed, and stained with LD540. Maximum‐intensity projections of deconvolved confocal z‐stacks. Dashed lines indicate cell boundaries.
- Analysis of LD areas of cells treated as in (A) and imaged with widefield microscopy. Bars: % of LDs/cell in indicated size category, mean ± SEM, n = 57–61 cells/genotype, two experiments, **P < 0.005 (unpaired t‐test).
- SKO + WT‐ or A212P‐seipin‐GFP cells were stained for calreticulin. Maximum‐intensity projections of deconvolved confocal z‐stacks.
- SKO + WT‐ or A212P‐seipin‐GFP cells were grown in standard growth medium, fixed, and stained with anti‐GFP antibodies. Widefield and STORM images.
- SKO + WT‐seipin‐GFP cells were delipidated and treated with OA for 1 h, fixed, and stained with LipidTox Red. Single focal plane of a 3D‐SIM z‐stack.
- Analysis of (E), bars: % of LDs/cell with the indicated number of WT‐seipin‐GFP punctae associated, mean ± SEM, n = 12 cells (693 LDs), two experiments, **P < 0.005 (Tukey's multiple‐comparisons test).
- SKO + WT‐ or A212P‐seipin‐GFP cells were delipidated, incubated with OA for 30 min, and immunolabeled for TEM with anti‐GFP antibodies. Black arrowheads: immunogold; orange arrowheads: ER–LD junctions. See also Appendix Fig S3.
- Analysis of (G), bars: relative labeling index in different cellular compartments, n = 3,456–4,512 immunogold clusters from 14 cells/genotype. Distribution of both WT‐ and A212P‐GFP‐seipin immunolabel is non‐random (chi‐square test, P < 0.005), but there is significant enrichment of WT‐ but not A212P‐seipin‐GFP at ER–LD contacts relative to the ER (binomial test, **P < 0.005). See also Appendix Tables S1 and S2.
- A431 WT cells with seipin tagged with sfGFP at its chromosomal locus and stably expressing ER marker plasmid (BFP‐KDEL) were delipidated and treated with OA for 1 h, fixed, and stained with LipidTox Red. Single confocal plane of an Airyscan z‐stack.
Figure EV1. Supporting information for Figure 1 .

- In relation to Fig 1A and B. WT and SKO cells were delipidated, incubated with OA for 1 h, fixed, and stained with LD540 and DAPI. Analysis of largest LD diameters/cell from deconvolved widefield z‐stacks, n = 70–91 cells, two experiments.
- WT and SKO cells were delipidated, fixed, and stained with DAPI and LD540. Maximum‐intensity projection of a confocal z‐stack. Note the lack of detectable LD structures.
- WT and SKO cells were grown in standard growth medium, fixed, and stained with LD540. Maximum‐intensity projections of deconvolved confocal z‐stacks. Orange arrowheads indicate dye artifacts, not seen in live cells and sometimes apparent when this dye is used in cells without LD induction. Blue arrowhead denotes a larger LD in SKO cells. Note the presence of small LDs in SKO cells.
- WT and SKO cells −/+ GFP‐fused WT or A212P‐seipin were grown in standard growth medium and neutral lipids analyzed by high‐performance TLC. Bars: ng lipid/μg protein, normalized to WT average in each experiment, n = 8 samples, ± SEM, two experiments, **P < 0.005, *P < 0.05 (unpaired t‐test, indicated genotype vs. WT cells).
- mRNA levels of total and endogenous BSCL2 transcripts of WT, SKO, and SKO + WT‐seipin‐GFP cell lines, detected by qPCR, normalized to GAPDH, ± SD, n = 3.
- Western blotting of WT‐ and A212P‐seipin‐GFP cell lysates with anti‐GFP and anti‐tubulin antibodies. Numbers indicate relative band intensities. 20 μg of protein was loaded per lane.
- In relation to Fig 1E. Distribution of the diameter of anti‐GFP‐labeled structures in SKO + WT‐ or A212P‐seipin‐GFP cells as detected by STORM, n = 3,019–3,958 structures from six cells/genotype, two experiments.
- In relation to Fig 1E and F. Analysis of SKO + WT‐seipin‐GFP cells which were delipidated and treated with OA for 1 h, stained with LipidTox Red, and imaged with 3D‐SIM microscopy. Bars: mean average LD diameter/cell categorized according to the number of WT‐seipin‐GFP puncta associated, ± SEM, n = 12 cells (693 LDs), two experiments.
We then introduced GFP‐tagged human WT‐seipin to the SKO cells and selected a clone with a low expression level of WT‐seipin‐GFP (Fig EV1E). In the WT‐seipin‐GFP‐expressing cell line, the defects in LD morphology and neutral lipid content were rescued (Figs 1A and B, and EV1D). In contrast, in a SKO cell line with a similarly expressed GFP‐tagged BSCL2‐causing point mutant seipin variant (Magré et al, 2001) (A212P‐seipin‐GFP), the aberrant LD biogenesis and neutral lipid storage defects were not corrected (Figs 1A and B, and EV1D and F).
WT‐seipin but not BSCL2‐mutant is enriched at ER–LD contact sites
We next investigated the subcellular localization of WT‐ and A212P‐seipin‐GFP. Under normal growth conditions, both WT‐ and A212P‐seipin‐GFP showed a reticular ER pattern, but WT‐seipin‐GFP exhibited a more punctate distribution (Fig 1C). By stochastic optical reconstruction microscopy (STORM) using anti‐GFP immunolabeling (Appendix Fig S2), both WT‐ and A212P‐seipin were observed as discrete dotty or disk‐like structures (Fig 1D). The A212P‐seipin‐GFP structures appeared smaller (diameter peak at ~35–40 nm) than the WT‐seipin‐GFP structures (~40–50 nm) (Fig EV1G), likely reflecting their assembly into smaller oligomers, as suggested (Binns et al, 2010; Sim et al, 2013).
To study seipin localization in relation to LDs, we conducted 3D‐structured illumination microscopy (3D‐SIM) on cells with a low level of GFP fluorescence. This revealed that ~95% of newly formed LDs had at least one WT‐seipin‐GFP puncta directly adjacent (Fig 1E and F). The LD size did not clearly correlate with the number of seipin punctae associated with it (Fig EV1H). Also by immuno‐EM, WT‐seipin‐GFP was enriched at ER–LD contact sites, contrary to A212P‐seipin‐GFP (Fig 1G and H, and Appendix Fig S3). Yet, as the sample processing for immuno‐EM partially perturbed the contours of membrane bound organelles, these data should be interpreted with caution.
Finally, to investigate endogenous seipin localization, we tagged the protein at its chromosomal locus (end‐seipin‐sfGFP; Appendix Fig S4). This confirmed the specific association of seipin at ER–LD contact sites (Fig 1I), with virtually all LDs harboring at least one seipin punctum. Thus, both WT‐seipin and a BSCL2‐causing point mutant form discrete structures in the ER, but the WT protein is highly enriched at ER–LD contact sites while the mutant is not, arguing for the functional relevance of this location.
WT‐seipin‐GFP is stably associated with LDs in living cells
To characterize the dynamics of seipin localization, we performed high‐resolution imaging of live cells. Upon incubation with OA for 30–75 min to induce LD biogenesis, two populations of WT‐seipin‐GFP puncta were apparent: those associated with LDs and those without LD associations. Both populations were mobile but the latter displayed considerably faster movements (Figs 2A and B, and EV2A). The association of seipin‐GFP with LDs appeared stable during the observation period (up to 120 s) with seipin‐GFP dots hovering around the LD (Movie EV1) or moving together with it (Fig 2A, lower panel). Thus, LDs exhibit a close physical relationship with the ER, with seipin stably localizing at the ER–LD junctions.
Figure 2. Seipin is stably associated with LDs, and lack of seipin results in loss of LD contacts with the ER .

- SKO cells stably expressing WT‐seipin‐GFP cells were delipidated and then incubated with OA and LipidTox Deep Red for 30–75 min. Airyscan video snapshots, upper panel: an example of two seipin‐GFP punctae, one stably associated with a LD (blue arrowhead) and another not associated with LD (orange arrowhead). Lower panel: an example of a mobile LD, with a single seipin puncta moving together with it (blue arrowhead).
- Analysis of (A), bars: mean velocity of tracked seipin puncta ± SEM, n = 13 ROIs from 13 cells, 90 punctae, two experiments, **P < 0.005 (unpaired t‐test).
- Analysis of LD mobility in WT and SKO cells. Cells were incubated with OA for 45–75 min, LDs were visualized with LD540 and cells imaged by widefield microscopy. Bars: 1 – [Pearson's colocalization coefficient between subsequent frames/cell], ± SEM, n = 149–151 cells, two experiments, **P < 0.005 (Mann–Whitney test).
- Examples of LD trajectories from cells treated and imaged as in (C), arrowhead indicates the tracked LD.
- Analysis of the LD mobility from (C) and (D), individual LDs plotted for volume and mean velocity.
- WT and SKO cells were transfected with ER marker plasmid (sfGFP‐ER‐3, green), delipidated overnight and incubated with OA and LipidTox Deep Red (magenta) for 15–75 min. Airyscan video snapshots exemplifying different modes of LD‐ER‐associated movement, orange arrowheads indicate LDs; note the different timescales. Panels I and II: WT cell; panel III: SKO cell.
- Analysis of LD–ER‐associated movement from live Airyscan microscopy as in (F). Bars: % of LDs/ROI displaying indicated mode of movement ± SEM, n = 43–55 ROIs (201–467 LDs) from four experiments, **P < 0.005 (Mann–Whitney test).
- Analysis of LD velocity. Bars: mean velocity of tracked LDs ± SEM, n = 29–42 LDs/group (70–91 LDs/genotype), two experiments, *P < 0.05, **P < 0.005 (Kruskal–Wallis test, followed by Dunn test).
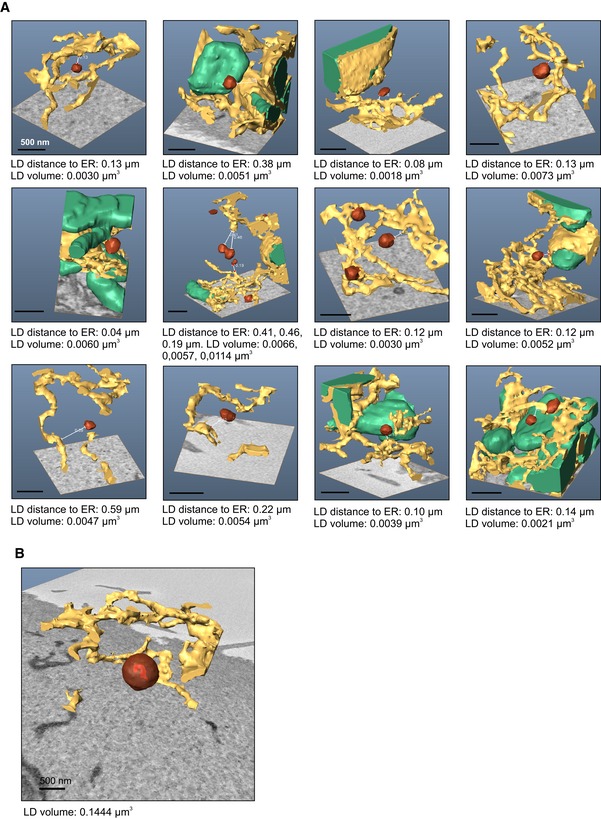
- WT and SKO cells stably expressing HSP47‐APEX were delipidated, treated with OA for 1 h, and processed for SB‐EM. 3D models of LDs and surrounding ER and mitochondria profiles shown on top of a block‐face image from SB‐EM dataset. Insets are representative cross sections from modeled area highlighting the ER–LD association. Red: LD; yellow: ER; green: mitochondria.
- Analysis of LDs from (I). Black lines indicate median and boxes third quartiles, n = 98–227 LDs from 11–16 ROIs/genotype.
- Analysis of LDs displaying no ER contacts from (I). Bars: mean % of LDs in ROIs not in proximity to the ER ± SEM, n = 11–16 ROIs/genotype, **P < 0.005 (unpaired t‐test).
Figure EV2. Supporting information for Figure 2 .

- A431 WT cells with seipin tagged at its chromosomal locus with sfGFP were treated with OA for 1 h and imaged live in the presence of LipidTox Deep Red. Airyscan video snapshots are shown. Orange arrowheads indicate seipin puncta stably associated with LDs.
- In relation to Fig 2C–E. WT and SKO cells were treated with OA for 45–75 min, LDs were stained with LD540, and cells were imaged live with widefield microscopy. Shown are two subsequent frames (400 ms apart) and their overlap.
- Maximum velocities (average between three subsequent frames) of the tracked LDs in Fig 2E.
- WT and SKO cells were grown in standard growth medium, LDs were stained with LD540, and cells were imaged live with widefield microscopy. Shown are two subsequent frames (400 ms apart) and their overlap.
- Analysis of (D), bars: 1 – [Pearson's colocalization coefficient between subsequent frames/cell], ± SEM, n = 114–127 cells, two experiments, **P < 0.005 (Mann–Whitney test).
- Exemplary LD trajectories of cells treated and imaged as in (D); total duration of tracks is 40 s.
- Maximum velocities of LDs (averaged between three subsequent frames) of LDs tracked in Fig 2H, mean ± SEM, n = 29–42 LDs/group (70–91 LDs/genotype), two experiments, *P < 0.05, **P < 0.005 (Kruskal–Wallis test, followed by Dunn test).
- SKO cells stably expressing WT‐ or A212P‐seipin‐GFP were transfected with ER marker plasmid (sfGFP‐ER‐3), delipidated overnight, incubated with OA and LipidTox Deep Red for 15–75 min and imaged live with Airyscan microscopy. Phenotyping of LD‐ER‐associated movement as in Fig 2F, bars: % of LDs/ROI displaying indicated mode of movement ± SEM, n = 12 ROIs/genotype (75–65 LDs), one experiment, *P < 0.05 (unpaired t‐test).
A subset of LDs in SKO cells display increased mobility and lack physical ER contact
We next examined the dynamics of LDs in WT and SKO cells. In control cells treated with OA for 45–60 min, LDs were often relatively immobile, with occasional short bouts of faster, unidirectional movement likely representing LD transport along microtubules (Targett‐Adams et al, 2003; Shubeita et al, 2008; Herms et al, 2015). In SKO cells, LD mobility was increased, with some of the small LDs displaying strikingly aberrant multidirectional trajectories, and high mean and maximum velocities (Figs 2C–E and EV2B and C, and Movie EV2). This phenomenon was also observed in LDs formed under normal growth conditions (Fig EV2D–F).
We then imaged the movement of newly formed LDs in relation to the ER, focusing on peripheral areas of the cells where the ER network was less dense allowing better visualization. In control cells, two modes of LD movement relative to the ER were observed: (i) LDs that appeared stably associated with the ER and moved together with it and (ii) LDs that traveled vectorially along the ER (Fig 2F–H and Movie EV3). Remarkably, in SKO cells, some LDs also moved independently of the ER and with higher velocities (Figs 2F–H and EV2G, and Movie EV3). This ER‐independent LD mobility was rescued upon stable expression of WT‐ but not A212P‐seipin‐GFP (Fig EV2H).
To confirm the apparent loss of ER–LD contacts in SKO cells, we examined the 3D ultrastructure of LDs in WT and SKO cells using serial block‐face scanning EM (SB‐EM). For cytochemical staining of the ER, we generated cell lines expressing Hsp47, an ER‐resident chaperone (Kano et al, 2005) fused with APEX, an EM reporter (Martell et al, 2012). Delipidated WT and SKO cells were treated with OA for 1 h and imaged using SB‐EM, and ER and LD profiles were modeled (Fig 2I). We found that the vast majority of LDs in SKO cells were smaller and more homogeneous in size (~200 nm diameter) than in WT cells (Fig 2J). Within the resolution of the system (~20 nm in XY, ~40 nm in Z), all LDs in WT cells were in close proximity to the ER, as judged by the continuity of the LD profile with the ER profile. Strikingly, in SKO cells a subset of the small LDs (about 10% of LDs per region of interest) showed no contact with the ER, with their distance to closest ER membranes ranging from 20 to up to 460 nm (Figs 2K and EV3A). In contrast, all the large LDs visualized from SKO cells were in the proximity of the ER (Fig EV3B).
Figure EV3. Additional SB‐EM models of LDs and ER in SKO cells.
Aberrant morphology of ER–LD contacts in SKO cells
We next examined the detailed morphology of ER–LD junctions in WT and SKO cells using electron tomography (ET; digital isotropic resolution ~2.8 nm). The ER–LD contacts of WT cells appeared well‐delineated and morphologically uniform: the ER typically formed a foot‐like process that touched the LD surface within a small area (Fig 3A), in accordance with earlier findings (Kassan et al, 2013; Wilfling et al, 2013). At such contacts, the membrane profile often appeared darker and thicker, but we did not observe direct membrane continuities between the ER and LD membranes. 3D modeling revealed several discrete patch‐like ER contacts per LD (Fig 3B and Movies EV4 and EV5). In contrast, in SKO cells, the contacts appeared heterogeneous and irregular. Some LDs exhibited very extensive ER contacts (Fig 3A), with modeling showing a web‐like ER attachment (Fig 3B and Movies EV6 and EV7), while others (~20%) displayed narrow, string‐like bridges to the ER that were not observed in control cells (Fig 3A). When the extent of ER–LD contacts was evaluated, we found a striking heterogeneity in the extent of ER–LD contacts in SKO cells (total ER–LD contact area per LD: 0.022–0.053 μm2 in WT cells vs. 0.012–0.105 μm2 in SKO cells, n = 4–5 LDs). As the SKO LDs were smaller, the fraction of the LD surface associated with the ER was, on average, larger in SKO cells (3.2 ± 1.7% of total LD area in WT vs. 9.5 ± 4.5% in SKO, ± SD). Also with this resolution, a complete LD profile with no ER contact was recorded in SKO cells (Movie EV8). Together, these data suggest that seipin controls the extent of ER–LD contacts, as seipin loss is accompanied by missing, rudimentary, or very large ER–LD contacts.
Figure 3. ER–LD contacts and ER morphology are aberrant in SKO cells.
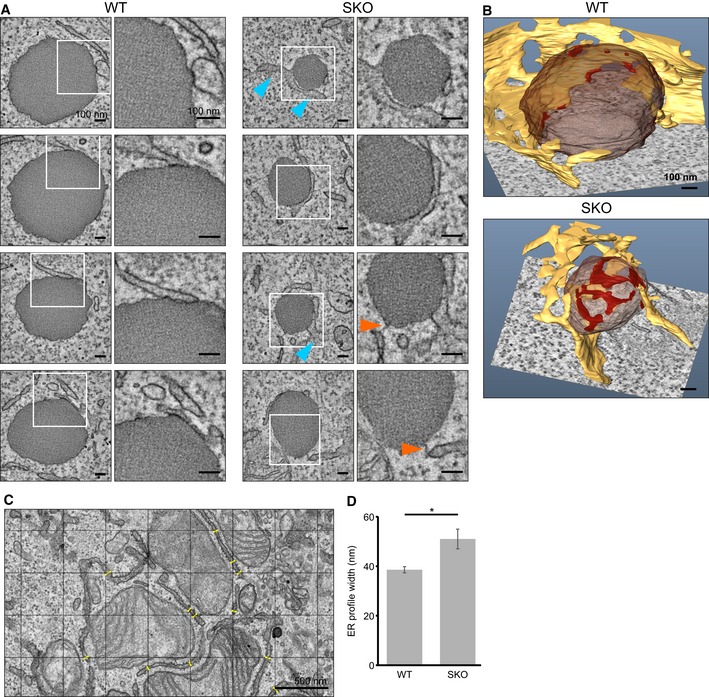
- WT and SKO cells were treated with OA for 1 h and processed for ET. Representative single tomographic slices of ER–LD contacts. Orange arrowheads indicate narrow ER–LD contacts, and blue arrowheads indicate widened ER profiles seen in SKO cells.
- 3D models of LDs and ER–LD contacts based on tomograms in (A). Yellow: ER; brown: LD; red: ER–LD contacts.
- Exemplary TEM image of a WT cell incubated with OA for 1 h. A grid is randomly placed on top of the image, and the width of perpendicularly oriented ER profiles passing through grid lines is measured. Yellow lines indicate measured sites.
- ER profile analysis of (C). Bars: average profile width/cell ± SEM, n = 11–9 cells (149–224 profiles), *P < 0.05 (unpaired t‐test).
When assessing the ER ultrastructure, we noted that in SKO cells, the ER appeared occasionally expanded in the vicinity of LDs (Fig 3A). To address whether this was restricted to ER–LD contact sites, we performed TEM of cells incubated with OA for 1 h. This revealed a significant widening of the overall ER diameter in SKO cells (width of ~40 nm in WT cells vs. ~50 nm in SKO cells; Fig 3C and D).
LDs generated in SKO cells show defective targeting of the ER membrane protein ACSL3‐Cherry
We next investigated how select LD proteins associate with LDs in WT and SKO cells. To this end, we generated WT and SKO cells expressing ACSL3‐Cherry, an ER membrane protein that marks lipogenic ER subdomains and nascent LDs (Kassan et al, 2013). In these cells, we also transiently expressed a GFP‐fused adipose‐differentiation‐related protein (ADRP), which is recruited to LDs from the cytoplasm (Brasaemle et al, 1997). Upon 1‐h incubation with OA, ADRP‐GFP was efficiently recruited to newly formed LDs in both WT and SKO cells (Fig 4A and B). In WT cells, ACSL3‐Cherry partially retained a reticular pattern, but additionally localized to the newly formed LDs. In contrast, in SKO cells ACSL3‐Cherry did not concentrate on LDs but remained almost exclusively in the ER (Fig 4A and B). Similar results were obtained in live cells when these proteins were expressed individually (Fig EV4A).
Figure 4. Endogenous ACSL3 accumulates at ER–LD junctions in SKO cells.

- WT and SKO cells stably expressing ACSL3‐Cherry were transfected with ADRP‐GFP for 24 h, incubated with OA for 1 h, fixed, and stained with LD540. Single confocal planes of deconvolved confocal z‐stacks.
- Colocalization analysis of (A), from single confocal sections. Bars: correlation coefficient m1 ± SEM, n = 34–35 cells/genotype, two experiments, **P < 0.005 (unpaired t‐test).
- WT and SKO cells were transfected with ADRP‐GFP for 24 h, incubated with OA for 2 h, and co‐plated with delipidated WT or SKO cells stably expressing ACSL3‐Cherry. After co‐plating, cells were incubated for 2.5 h in normal growth medium and then fused together using PEG. Cells were fixed and imaged 1 h post‐fusion. Single confocal planes.
- Colocalization analysis of (C). Bars: correlation coefficient m1 ± SEM, n = 31–39 cells/treatment, three experiments, **P < 0.005 (Tukey's test). Similar results were obtained when cells were kept in delipidation medium after co‐plating.
- WT and SKO cells were treated with OA for 1 h, fixed, and stained with anti‐ACSL3 antibodies and LD540. Representative sections of peripheral ER areas, single confocal planes of deconvolved z‐stacks.
- Analysis of (E), insets illustrate assigned categories of ACSL3 LD association. Bars: % of LDs/ROI in the indicated category, mean ± SEM, n = 9–10 peripheral ROIs from 9 to 10 cells/genotype (616–968 LDs), three experiments, *P < 0.05, **P < 0.005 (unpaired t‐test).
- TEM images of anti‐ACSL3‐labeled WT and SKO cells treated with OA for 1 h.
- Analysis of (G), n = 66–119 LDs from eight cells/genotype.
Figure EV4. Supporting information for Figure 5 .

- WT and SKO cells stably expressing ADRP‐GFP or ACSL3‐Cherry were incubated with OA and LD marker (LipidTox Red or LD540) for 1 h and imaged live. Single confocal planes, representatives of at least 20 captures, two experiments.
- WT cells were treated with control or ACSL3 siRNA for 3 days, incubated with OA for 1 h, fixed, stained with anti‐ACSL3 antibodies and DAPI, and imaged with widefield microscopy. Analysis of widefield images, bars: mean ACSL3 label intensity/cell ± SEM, n = 105–145 cells, one experiment, **P < 0.005 (unpaired t‐test).
- SKO cells stably expressing WT‐seipin‐GFP were delipidated or additionally incubated with OA for 15 min, fixed, and stained with anti‐ACSL3 antibodies. Single confocal planes of deconvolved z‐stacks.
- SKO cells stably expressing WT‐ or A212P‐seipin‐GFP were treated with OA for 1 h, fixed, and stained with anti‐ACSL3 antibodies and LD540. Representative sections of peripheral ER areas, single confocal planes of deconvolved z‐stacks.
- Analysis of (D). Bars: mean % of LDs/cell in the indicated category ± SEM, n = 10–12 cells (1,443–2,770 LDs), two experiments, **P < 0.005 (unpaired t‐test).
To further characterize defective ACSL3 trafficking in the absence of seipin, we conducted cell fusion experiments. We fused cells expressing ADRP‐GFP on newly formed LDs with delipidated cells lacking LDs and containing ACSL3‐Cherry in the ER. When both cell pools represented WT genotype, ACSL3 recruitment to ADRP‐labeled LDs was readily evident (Fig 4C and D). This suggests that cell fusion and subsequent fusion of ER membranes (Kaprielian et al, 1996) allowed ACSL3 to move via ER–LD contacts to the surface of LDs. In contrast, this recruitment was perturbed when SKO cells were fused together (Fig 4C and D). However, ACSL3 derived from SKO ER did gain access to WT LDs (Fig 4C and D), likely because of functional ER–LD contacts preserved in WT cells. Strikingly, LDs generated in SKO cells failed to recruit ACSL3 deriving from a WT ER (Fig 4C and D). This suggests that seipin needs to be present during LD formation, as reintroducing seipin to SKO cells with pre‐existing LDs failed to facilitate ACSL3 LD recruitment.
Endogenous ACSL3 accumulates in the ER and ER–LD junctions in SKO cells
We next examined the distribution of endogenous ACSL3 (Fig EV4B). In delipidated cells, ACSL3 showed a reticular staining pattern with fine punctae, suggesting localization in a lipogenic ER subdomain (Kassan et al, 2013). These domains were largely segregated from areas marked by WT‐seipin‐GFP (Fig EV4C). A 15‐min treatment with OA caused the appearance of more prominent ACSL3 punctae, likely representing newly forming LDs (Kassan et al, 2013). In these conditions, WT‐seipin‐GFP punctae were observed in close apposition and partly overlapping with the ACSL3 signal (Fig EV4C). Upon 1‐h OA loading of WT cells, endogenous ACSL3 was observed mostly in ring‐like structures surrounding small LDs or in dot‐like structures completely overlapping with them (Fig 4E and F). Virtually all LDs showed a clear accumulation of ACSL3. In contrast, in SKO cells ACSL3 did not accumulate on the surfaces of small LDs but often concentrated on one side of them (Fig 4E and F). The few LDs in SKO cells that harbored ring‐like ACSL3 staining were > 0.5 μm in diameter. This ACSL3 mistargeting was rescued in SKO cells expressing WT‐, but not A212P‐seipin‐GFP (Fig EV4D and E).
To address endogenous ACSL3 localization in more detail, we performed immuno‐EM. In WT cells treated with OA for 1 h, ACSL3 labeling typically decorated the cytoplasmic side of the LD surface (Fig 4G), indicating localization on the LD phospholipid monolayer. In SKO cells, ACSL3 labeling was often restricted to ER–LD junctions, with the cytoplasmic face of LDs devoid of signal (Fig 4G). Image analysis of WT cells revealed ACSL3 localization on the LD monolayer and LD‐ER contacts, whereas in SKO cells, 18% of LDs showed ACSL3 label exclusively at the ER–LD junctions and 30% of LDs were completely devoid of ACSL3, showing labeling only outside the LDs in the ER (Fig 4H).
Defective cargo exchange between the ER and LDs in SKO cells
Acyl‐CoA synthetase 3 localization to LDs depends on its N‐terminal hydrophobic region postulated to form an alpha‐helical secondary structure (Poppelreuther et al, 2012), and the protein presumably moves to LDs via ER–LD contacts. We next asked whether seipin deficiency induces a general defect in the translocation of ER proteins to LDs. To address this, we employed HPos, a model peptide harboring the hydrophobic domain of ALDI for ER insertion and the LD‐targeting sequence of caveolin‐1 (Kassan et al, 2013). This peptide was shown to translocate from the ER to nascent LDs within minutes after fatty acid administration. Accordingly, we observed that HPos‐Cherry was efficiently targeted to forming LDs in WT cells, very similar to ACSL3‐Cherry (Fig EV5A). Interestingly, the recruitment of HPos‐Cherry to nascent LDs was not prevented in SKO cells and the peptide could also reach LDs devoid of endogenous ACSL3 (Fig EV5A–C).
Figure EV5. Additional information on HPos‐Cherry ER–LD trafficking.

- WT and SKO cells stably expressing ACSL3‐ or HPos‐Cherry were incubated with OA for 1 h, fixed, and stained with LD540. Maximum‐intensity projections from deconvolved confocal z‐stacks. Note that HPos‐Cherry accumulates on small LDs in SKO cells.
- SKO cells stably expressing HPos‐Cherry were incubated with OA for 1 h, fixed, and stained with anti‐ACSL3 antibodies and LipidTox Green. Section of peripheral ER area, maximum projection of a deconvolved confocal z‐stack. Blue arrowhead denotes a LD with no ACSL3 accumulation but clear HPos overlap, and orange arrowhead denotes a LD with HPos overlap and ACSL3 signal adjacent to it.
- Analysis of (B). Bars: % of LDs/ROI in the category indicated, mean ± SEM, n = 723 LDs from eight ROIs from eight cells, two experiments.
- In relation to Fig 5B. WT and SKO cells stably expressing HPos‐Cherry were incubated with OA and LipidTox Green for 2–4 h, the Cherry signal was bleached, and recovery to LDs was monitored with confocal microscopy. The examples shown are from cells incubated with OA for 190 min (upper panel) and 220 min (lower panel). Circle denotes bleached ROI.
- In relation to Fig 5B. Analysis of HPos‐Cherry recovery to LDs or the ER, from cells incubated with OA for 2–4 h (LDs) or grown in normal growth medium (ER). Data are normalized to both pre‐bleach and post‐bleach intensities, ± SEM, n = 22–25 bleached LDs, 11–13 ER areas, two experiments. Also shown are curve fits of the recovery curves. Data for LD recovery are the same as in Fig 5B.
We next examined the kinetics of HPos‐Cherry ER–LD trafficking with fluorescent recovery after photobleaching (FRAP) experiments. We induced LD biogenesis by incubating cells with OA for 2 h which resulted in the recruitment of HPos‐Cherry to LDs in both WT and SKO cells. We then bleached the HPos‐Cherry signal at LDs and monitored recovery to LDs. For FRAP analysis, we focused on LDs that were relatively immobile, to avoid detection inaccuracies resulting from fast LD movements. In WT cells, there was a clear recovery and re‐accumulation of HPos‐Cherry to LDs via the ER (Figs 5A and B, and EV5D). However, in SKO cells the recovery of HPos was severely impaired (Figs 5A and B, and EV5D). Yet, the mobility of this peptide in the ER was similar in both WT and SKO cells under normal growth conditions (Fig EV5E). It is thus plausible that the initial rapid recovery, similar in WT and SKO cells, reflects the fast recovery of the peptide in the ER, and the slower component, severely attenuated in SKO cells, the return of HPos to the LD monolayer. Together, these data suggest that the initial accumulation of HPos to forming LDs was preserved in SKO cells, but subsequent movement to pre‐existing LDs was compromised.
Figure 5. Defective ER–LD cargo trafficking in SKO cells.

- WT and SKO cells stably expressing HPos‐Cherry were incubated with OA for 4 h, and LDs were labeled with LipidTox Green. The HPos‐Cherry signal was bleached and signal recovery to LDs monitored using Airyscan imaging. Representative images of 10 acquisitions/genotype, two experiments. Circle denotes bleached region, and arrowheads indicate HPos signal accumulating around the LD.
- Analysis of HPos‐Cherry recovery to LDs after photobleaching, performed by confocal microscopy after 2‐ to 4‐h OA loading. Data are normalized to both pre‐bleach and post‐bleach intensities, ± SEM, n = 22–25 bleached LDs/genotype, two experiments.
- WT and SKO cells were delipidated for 72 h, with the last 24 h in the presence of 1 μM BPY‐C12 to label cellular lipids. LD biogenesis was induced by incubating cells in the presence of 0.1 mM OA and LipidTox Green for 1–2 h. BPY‐C12 on LDs was bleached and recovery to LDs monitored using Airyscan imaging or conventional confocal imaging.
- Airyscan video snapshots of BPY‐C12 recovery to LDs as described in (C). Circle denotes bleached ROI. For the last images of both panels, brightness of BPY channel has been increased.
- Analysis of BPY‐C12 recovery to LDs from photobleaching experiments described in (C); data are normalized to both pre‐bleach and post‐bleach intensities, ± SEM, n = 22 bleached LDs/genotype from three experiments.
- Delipidated WT and SKO cells were incubated with OA and LipidTox Green for 1 h to induce LD formation, followed by 10‐min labeling with BPY‐C12. Live cell confocal images were captured at indicated chase time points in the presence of OA and LipidTox Green.
- Colocalization of BPY‐C12 and LDs (Pearson's colocalization correlation coefficient) ± SEM, n = 8–26 cells/time point, two experiments, *P < 0.05, **P < 0.005 (unpaired t‐test, between WT and SKO at the same time point).
- Delipidated WT and SKO cells were pulsed for 10 min with 0.1 mM alkyne‐OA either directly (1–2) or after pre‐incubation with 0.1 mM OA for 1 h (3–4). After alkyne‐OA incubation cells were collected (1 and 3) or further incubated for 20 min in 10% FBS medium (2) or 0.1 mM OA medium (4). Bars: % of alkyne‐OA in neutral lipids (triacylglycerol and cholesterol esters), normalized to WT pulse (1), ± SEM, n = 6–9 samples, 2–3 experiments, *P < 0.05, **P < 0.005 (unpaired t‐test).
To examine the lipid transport capabilities of ER–LD junctions, we utilized Bodipy‐C12 (BPY‐C12), a fluorescent fatty acid analog used to monitor cellular fatty acid trafficking in cells (Rambold et al, 2015; Ohsaki et al, 2016). To this end, we first incubated delipidated cells in the presence of BPY‐C12 for 24 h, resulting in the incorporation of BPY‐C12 into cellular lipids, mostly phosphatidylcholine and neutral lipids (Fig EV6A). We then incubated cells with OA for 1–2 h to induce LD biogenesis, which was accompanied by the accumulation of BPY‐lipids to LDs in both WT and SKO cells (Fig 5C and D). However, FRAP experiments revealed that the return of BPY to LDs was impaired in SKO cells compared to WT (Figs 5D and E, and EV6B) while recovery in ER membranes appeared similar between genotypes (Fig EV6C). Analogously to HPos, this suggests that BPY‐lipids can be incorporated into nascent LDs but cannot reach pre‐existing ones. To probe this further, we first induced LD biogenesis with OA for 1 h and then labeled cells with BPY‐C12 for 10 min and chased for increasing times in the presence of OA. In WT cells, there was a gradual, clear increase in BPY LD localization and a subsequent decrease in BPY labeling of membranous structures (Fig 5F and G). In contrast, in SKO cells the probe largely remained in a membranous pattern and the colocalization of BPY with LDs was markedly attenuated (Fig 5F and G).
Figure EV6. Additional information on fatty acid ER–LD trafficking and metabolism.

- In relation to Fig 5C–E. WT and SKO cells were delipidated for 72 h with the last 24 h in the presence of 1 μM BPY‐C12 to label cellular lipids (pulse). LD biogenesis was induced by incubating cells in the presence of 0.1 mM OA for 2 h (chase). Lipids were extracted, separated on TLC, and imaged. BPY‐containing PC (phosphatidylcholine) and NL (neutral lipid) were identified based on migration corresponding with unlabeled lipids. Representative TLC from two experiments with similar results.
- In relation to Fig 5E. Cells were incubated with BPY‐C12 as in (A). LD biogenesis was induced by incubating cells in the presence of 0.1 mM OA and LipidTox Green for 1–2 h. BPY on LDs was bleached and recovery to LDs monitored. The examples shown are from cells incubated with OA for 85 min (upper panel) and 95 min (lower panel).
- Analysis of BPY‐C12 recovery to LDs from FRAP experiments performed as outlined in (B). Additional photobleaching of ER regions was conducted prior to LD biogenesis induction. Data are normalized to both pre‐bleach and post‐bleach intensities, ± SEM, n = 22 bleached LDs (three experiments) and 10 ER regions/genotype (two experiments). Also shown are curve fits of the recovery curves. Data for LD recovery are the same as in Fig 5E.
- Additional data related to Fig 5H. Bars: % of alkyne‐OA in neutral lipids (TAG and CE) (NL), free fatty acid (FFA), and phosphatidylcholine (PC), normalized to NL in WT pulse (1), ± SEM, n = 6–9, 2–3 experiments, *P < 0.05, **P < 0.005 (unpaired t‐test, all significant differences indicated in graph). Data for NL are also shown in Fig 5H.
- Exemplary TLC plates of alkyne‐OA incorporation into cellular lipids in conditions described in Fig 5H.
To compare the rapid flux of non‐fluorescent fatty acids to neutral lipids in WT and SKO cells, we employed “click” chemistry. Alkyne‐OA has previously been used to monitor fatty acid flux in mammalian cells and shown to perform similarly as radiolabeled tracers (Thiele et al, 2012). We first examined neutral lipid synthesis of WT and SKO cells during early LD biogenesis, incubating delipidated cells with 0.1 mM alkyne‐OA for 10 min and chasing for 20 min. Both after the pulse and after the chase, alkyne‐OA incorporation into neutral lipids was similar between genotypes (Fig 5H), arguing that the neutral lipid synthesis machinery of SKO cells is intact during early steps of LD biogenesis. However, when the 10‐min alkyne‐OA pulse‐chase was performed after a 1‐h pre‐incubation with unlabeled OA to first induce the generation of LDs, the results were different. Both after the pulse and after the chase, there was an impairment of OA incorporation into neutral lipids in SKO cells (Figs 5H and EV6D and E).
Overall, these data suggest that in SKO cells, initial protein and lipid trafficking to nascent LDs is at least partly preserved and neutral lipid synthesis during early LD assembly is intact. Instead, the subsequent trafficking of cargo between ER and more mature LDs is compromised and accompanied by a neutral lipid synthesis defect.
Older LDs of SKO cells display heterogeneous ER connectivity
To study the role of seipin on LDs after longer fatty acid exposure, we incubated cells with OA for 20 h. Also under these conditions, seipin‐GFP was found at ER–LD contacts, while A212P‐seipin‐GFP was more frequently absent (Fig 6A and Appendix Fig S5A–C). By light and electron microscopy, WT cells were characterized by numerous, relatively homogeneous looking LDs, often in clusters (Fig 6B–D). In contrast, SKO cells harbored strikingly heterogeneous LDs, with small aggregated as well as supersized LDs, as described (Szymanski et al, 2007; Fei et al, 2008). In addition, abundant small individual LDs were found throughout the cell (Fig 6B–D). These small LDs behaved similarly as the newly formed LDs of SKO cells, displaying increased mobility and aberrant trajectories, with a subset moving seemingly independently of the ER (Fig 6E and F, and Appendix Fig S5E–G). Instead, the aggregated and supersized LDs were typically immobile (Appendix Fig S5E and F). Also under these conditions, by SB‐EM, LDs disconnected from the ER were only detected in SKO cells (Appendix Fig S5H).
Figure 6. Older LDs of SKO cells display heterogeneous ER connectivity.

- A431 WT cells with seipin tagged at its chromosomal locus with sfGFP and stably expressing ER marker plasmid (BFP‐KDEL) were delipidated and treated with OA for 20 h, fixed, and stained with LipidTox Red. Single confocal plane of an Airyscan z‐stack.
- WT and SKO cells were treated with OA for 20 h, fixed, and stained with LD540. Maximum projections of deconvolved confocal z‐stacks. Dashed lines indicate cell boundaries.
- Analysis of LD areas of cells treated as in (A) and imaged with widefield microscopy. Bars: % of LDs/field of view in indicated size category, mean ± SEM, n = 25–30 fields of view (100–120 ROIs of non‐clustered LD areas from 100 to 120 cells), two experiments, **P < 0.005 (unpaired t‐test). See also Appendix Fig S5D.
- TEM micrographs of WT and SKO cells treated with OA for 20 h.
- WT and SKO cells were treated as in (B), LDs were visualized with LD540, and cells were imaged live with widefield microscopy. Exemplary trajectories of peripheral LDs tracked for 40 s.
- Analysis of cells treated and imaged as in (E). Bars: 1 – [Pearson's colocalization coefficient between subsequent frames/cell], ± SEM, n = 187–221 cells, two experiments, **P < 0.005 (Mann–Whitney test).
- WT and SKO cells were treated with OA for 20 h, fixed, and stained with anti‐ACSL3 antibodies and LD540. Maximum‐intensity projections of deconvolved confocal z‐stacks. Insets show small and large LDs.
- Analysis of (G). Bars: % of small (diameter < 0.5 μm) or large (diameter > 0.5 μm) LDs/cell in the indicated category, mean ± SEM, n = 10 ROIs from 10 cells/genotype (305–581 LDs), **P < 0.005 (unpaired t‐test).
- WT and SKO cells stably expressing HPos‐Cherry were incubated with OA for 20 h, and LDs were labeled with LipidTox Green prior to imaging. The HPos‐Cherry signal was bleached and signal recovery to LDs was monitored.
- Analysis of (I). Data are normalized to both pre‐bleach and post‐bleach intensities, ± SEM, n = 51–61 bleached LD areas/genotype, three experiments.
We next investigated the localization of endogenous ACSL3 in cells after 20 h of OA loading. In WT cells, ACSL3 was invariably associated with LDs (Fig 6G and H). In SKO cells, a substantial fraction of the small LDs did not acquire ACSL3, while the large LDs did (Fig 6G and H). We also studied the localization of diacylglycerol acyltransferase 2 (DGAT2), the final enzyme of TG synthesis that has been shown to localize to LDs to promote their growth (Kuerschner et al, 2008; Wilfling et al, 2013). Indeed, many large LDs of WT and SKO cells recruited this protein, while most small LDs did not, with no obvious difference between genotypes (Appendix Fig S5I). To examine cargo transport at ER–LD junctions at this time point, we performed HPos FRAP experiments. In WT cells, HPos returned efficiently to all LDs analyzed, but in SKO cells, the majority of LDs showed impaired recovery (Fig 6I and J, and Appendix Fig S6). Curiously, some large (> 0.5 μm in diameter) LDs in SKO cells showed exceptionally rapid HPos recovery (Fig 6I and J).
Overall, these data suggest that the connectivity of LDs to the ER is continuous over time in WT cells. In the absence of seipin, small “nascent‐like” LDs with dysfunctional/missing ER contacts are continuously present. In parallel, large LDs of SKO cells display heterogeneous ER connectivity.
LDs without ER contacts, impaired ACSL3 targeting and defective fatty acid flux to neutral lipids in BSCL2 patient fibroblasts
To assess whether our findings in SKO A431 cells can be reproduced in BSCL2 patient‐derived cells, we analyzed LD dynamics and ER–LD relationship in healthy control (control 1 and control 2) and BSCL2 patient‐derived primary fibroblasts with homozygous frameshift mutations in seipin (S3 and S5) (Boutet et al, 2009). When delipidated fibroblasts were incubated for 1 h with OA to induce LD biogenesis, the BSCL2 patient cells showed aberrant LD morphology, with an abundance of tiny LDs (Fig 7A), in agreement with previous findings in fibroblasts from a BSCL2 patient with a different mutation (Szymanski et al, 2007) and our observations in A431 SKO cells. Aberrantly large LDs were also detected, especially after prolonged OA incubation (Appendix Fig S7A). Interestingly, live cell imaging revealed an almost twofold increase in the mobility of nascent LDs in the cell periphery of BSCL2 patient cells as compared to controls (Fig 7B and C, and Movie EV9). High‐resolution live cell imaging of LDs and the ER showed that, similarly to A431 SKO cells, in BSCL2 patient cells a subset of LDs were moving at high velocities and apparently independently of the ER (Fig 7D and E, and Appendix Fig S7B and C, and Movie EV10). In contrast, in control cells even rapidly moving LDs appeared to move along the ER (Fig 7D and E, and Movie EV10). Moreover, analysis of confocal z‐stacks of fixed specimen showed that BSCL2 patient cells harbored LDs with no obvious contact with the ER, while this was not observed in control fibroblasts (Appendix Fig S7D). We also investigated the targeting of endogenous ACSL3 to LDs. In BSCL2 patient cells, ACSL3 localization was altered in a similar manner as observed in A431 SKO cells (Fig 7F and G). Finally, in alkyne‐OA flux experiments (analogous to the ones in A431 cells), we found no defect in OA incorporation into neutral lipids in delipidated cells. After LD biogenesis induction, control fibroblasts increased OA incorporation into neutral lipids, but BSCL2 cells failed to do so (Fig 7H).
Figure 7. BSCL2 patient fibroblasts display LDs moving independently of the ER, ACSL3 mistargeting, and defective fatty acid flux to neutral lipids.

- Two control and BSCL2 fibroblast cell lines were delipidated and treated with OA for 1 h, fixed, and stained with LD540. Maximum‐intensity projections of deconvolved confocal z‐stacks.
- Control and BSCL2 fibroblasts were incubated with OA for 75–90 min, LDs were stained with LD540, and cells were imaged live with widefield microscopy. Insets show overlay of two subsequent frames (400 ms apart).
- Analysis of (B). Bars = 1 − [Pearson's colocalization coefficient between subsequent frames/ROI], ± SEM, n = 120–140 ROIs (60–70 cells), two experiments, **P < 0.005 (Mann–Whitney test).
- Control and BSCL2 fibroblasts were transfected with ER marker plasmid (sfGFP‐ER‐3) for 24 h and treated with OA for 10–60 min. LipidTox Deep Red or LD540 was used to label LDs, and cells were imaged live by Airyscan microscopy. Examples of LDs with high mobility are shown; blue arrowheads indicate a LD moving along the ER, and orange arrowheads indicate LDs moving independent of the ER.
- Analysis of ER‐associated movement of LDs from live Airyscan microscopy as in (D). Bars: % of LDs/ROI displaying indicated mode of movement, mean ± SEM, n = 50–42 ROIs (218–374 LDs), two experiments, **P < 0.005 (Mann–Whitney test).
- Control and BSCL2 fibroblasts were treated with OA for 1 h, fixed, and stained with anti‐ACSL3 antibodies and LD540. Representative sections of peripheral ER areas, maximum‐intensity projections of deconvolved confocal z‐stacks.
- Analysis of (F), with insets illustrating assigned categories of ACSL3 LD association. Insets are the same as in Fig 4F. Bars: % of LDs/ROI showing the category indicated, mean ± SEM, n = 11–10 peripheral ROIs from 11 to 10 cells/group (1,200–2,019 LDs), two experiments, **P < 0.005 (unpaired t‐test).
- Delipidated fibroblasts were pulsed for 20 min with 0.1 mM alkyne‐OA either directly (1) or after pre‐incubation with 0.1 mM OA for 1 h (2), and chased in the presence of 0.1 mM OA for 40 min. Bars: % of alkyne‐OA in neutral lipids (triacylglycerol and cholesterol esters), normalized to control cells in (1), mean ± SEM, n = 11–12 samples, two experiments, *P < 0.05 (unpaired t‐test).
Discussion
In this study, we found that human seipin is present in discrete foci in the ER and these structures were enriched at ER–LD junctions by immuno‐EM, similarly as reported for Ldb16 in yeast (Grippa et al, 2015). We estimated the size of these foci to be roughly 40–50 nm by antibody detection of fluorescently tagged proteins. This size estimate is roughly in line with that obtained by atomic force microscopy of purified seipin oligomers (Sim et al, 2013). It is also possible that several oligomers join into a functional unit at the ER–LD junction.
The seipin‐GFP foci were mobile in the ER, with LD‐associated puncta moving less rapidly than those not associated with LDs. Most nascent LDs harbored only one WT‐seipin‐GFP punctum that appeared to be stably associated with the LD and moving together with it. Importantly, similar stable association of seipin at ER–LD contacts and dynamic non‐LD‐associated seipin foci in the ER were observed when human seipin was tagged with GFP at its endogenous genomic locus. This agrees well with recent findings on endogenously tagged seipin in Drosophila cells (Wang et al, 2016). Seipin recruitment to ER–LD contacts is a relatively early event during LD biogenesis, as reintroduction of seipin did not rescue protein targeting to pre‐existing LDs of seipin‐deficient cells.
Lipid droplets are considered to maintain a close functional and physical relationship with the ER (Jacquier et al, 2011; Wilfling et al, 2013), but proteins tethering LDs to the ER have not been characterized. In A431 cells used in this study, all newly formed LDs appeared to be physically linked to the ER via discrete membrane contacts, as judged by ET. Unexpectedly, in SKO cells, a subset (roughly 10%) of LDs was entirely devoid of membrane contacts to the ER. In addition, the persisting ER–LD contacts in SKO cells appeared morphologically abnormal, forming either very narrow and string‐like or extensive web‐like attachments. These data strongly suggest that seipin is critical for the formation and/or stabilization of normal ER–LD contacts. However, as some LDs in SKO cells appeared extensively surrounded by the ER, seipin is presumably not the only protein responsible for the maintenance of ER–LD contacts. Interestingly, LD detachment from the ER has not been reported in yeast lacking seipin (Fdl1Δ/Ldb16Δ). On the other hand, although we found a subset of LDs wrapped by the ER, we did not observe abnormal proliferations in the ER enwrapping LDs, as described in yeast (Grippa et al, 2015; Wolinski et al, 2015). This suggests cell type‐specific differences in the phenotype(s) of ER–LD contacts in the absence of seipin. We did, however, observe a general widening of ER profiles in SKO cells that had been challenged with OA for 1 h. We speculate that this might reflect the deposition of cargo destined to LDs inside the ER. Indeed, studies in Fdl1Δ yeast have documented increased neutral lipid sequestration in the ER during LD biogenesis (Cartwright et al, 2015).
Based on our studies of protein and lipid delivery from the ER to LDs, it seems that a large fraction, potentially all, of ER–LD contacts in seipin knockout cells were functionally defective. Another unanticipated observation, possibly reflecting the loss of functional ER contacts in seipin‐deficient cells, was the increased mobility of LDs. This was most conspicuous for LDs that appeared not to maintain contacts with the ER, exhibiting rapid, non‐directional jerky movements. Importantly, increased and abnormal LD motility in the cell periphery was also observed in BSCL2 patient fibroblasts. It is conceivable that ER contacts limit LD movement, and if lost, LD mobility becomes unrestricted. Interestingly, in seipin‐deficient cells also those LDs that appeared to move along the ER often had higher velocities. This points to the possibility that seipin plays a role in immobilizing LDs at distinct sites in the ER. Moreover, the generation of abnormally numerous small LDs suggests that seipin may also act by somehow restricting the number of LD nucleation sites in the ER (Cartwright & Goodman, 2012). To better understand this, it will be important to study the functions of non‐LD‐associated seipin foci.
A marked phenotype of seipin‐deficient cells upon fatty acid loading is the formation of numerous tiny LDs. By EM, these LDs had a rather uniform diameter of circa 200 nm. This suggests that the initial formation of LDs in the ER does not depend on seipin, but in the absence of seipin, growth of most LDs beyond this size becomes abortive. A similar conclusion was reached by Wang et al (2016), while our work was under review. Based on our study, one possible explanation for this is the defective recruitment of protein machinery involved in lipid synthesis from the ER to LDs, as indicated by the impaired LD targeting of ACSL3 that should channel fatty acids into nascent LDs and promote their growth (Kassan et al, 2013). Moreover, the recruitment of some protein and lipid cargo to forming LDs was initially successful in seipin‐deficient cells, as indicated by the targeting of BPY‐C12 metabolites and the HPos model peptide to nascent LDs. Yet, based on FRAP studies their recruitment to pre‐formed LDs was compromised. Our rapid fatty acid flux experiments strengthened the idea that the initial machinery for triglyceride synthesis in seipin‐deficient cells is intact. However, a marked defect in OA incorporation into neutral lipids became manifested if OA was introduced into cells that already exhibited triglyceride stores and LDs. Together, these data imply that nascent LDs need to reach a distinct maturity at which the role of seipin in ER–LD cargo exchange becomes apparent.
Lipid droplet biogenesis is considered to be a stepwise process, originating by initial aggregation of neutral lipids inside the ER bilayer (Pol et al, 2014). Such initial lenses have so far not been reported in mammalian cells, but are likely to be followed by bigger blister‐like structures strengthening membrane curvature changes. The neutral lipid core would grow and induce the structure to bud off from the ER but remain in a dynamic contact with it. Indeed, LDs connected to the ER via what appear to be membrane bridges have been visualized by EM by us and others (Kassan et al, 2013; Wilfling et al, 2013). Based on our findings, the simplest interpretation is that seipin plays a role in LD biogenesis after the initial LD nucleation, by helping to physically bridge at least a subset of newly formed LDs to the ER (Fig 8). By contributing structurally to or otherwise stabilizing the ER–LD contact, seipin may also facilitate the incorporation of protein and lipid cargo into growing LDs. This idea does not rule out other proposed functions of seipin at the ER–LD interphase, such as a scaffolding of proteins important for neutral lipid synthesis (Sim et al, 2013; Talukder et al, 2015).
Figure 8. Schematic illustration of the proposed role of seipin in ER–LD contacts.

LD biogenesis is initiated in the ER. Nascent LDs harboring seipin at their ER contact recruit proteins and lipids from the ER to promote LD growth. LDs remain associated with the ER during maturation, allowing continuous cargo exchange between these compartments. In seipin‐deficient cells, ER–LD contacts are morphologically abnormal, either missing, rudimentary, or aberrantly extensive. Most newly formed LDs lack functional contacts with the ER. HPos, a model ER‐to‐LD targeting peptide can initially reach LDs but its access to LDs is later perturbed. ACSL3, a lipid biosynthetic enzyme normally targeted to the LD surface remains in the ER or at ER–LD junctions. Oleic acid flux into neutral lipids is initially intact but subsequently impaired. In contrast, ADRP, a cytoplasmic coat protein, reaches LDs independently of seipin. Defective ER–LD contacts result in discontinued cargo exchange and arrested LD maturation, where the majority of LDs fail to grow beyond the diameter of ~200 nm.
Importantly, it is increasingly evident that the communication between ER and LDs is bidirectional. Proteins and lipids may also relocate from the LD to the ER (Jacquier et al, 2011; Kassan et al, 2013; Wilfling et al, 2013) and mature LDs may be accessible from the ER luminal side (Mishra et al, 2016). The proposal that seipin acts as a diffusion barrier between the two compartments is interesting in this regard (Grippa et al, 2015), and potentially compatible with our data. For instance, nascent LDs might need seipin as a diffusion barrier to control their surface phospholipid composition, which would be required for the proper targeting of proteins destined for growing LDs and for the maintenance of their ER contacts. Considering the persistent localization of seipin at ER–LD contacts, it is likely that it also plays a role in the maintenance of more mature LDs. However, at present it is not possible to discriminate between bona fide later role(s) of seipin from secondary effects induced at the earlier step(s) of LD biogenesis.
In conclusion, this study reveals a role for seipin in ensuring functional ER–LD contacts of nascent LDs in human cells. How defective ER–LD interactions contribute to the near absence of adipose tissue in human BSCL2 remains open. An interesting observation in this context is that unilocular adipocytes may contain ER‐associated micro‐LDs that serve as intermediates in the packaging of triglycerides to the unilocular LD (Chu et al, 2014).
Materials and Methods
Cell culture and transfection
Human epithelial carcinoma A431 cells were grown in DMEM with 10% FBS supplemented with penicillin/streptomycin (100 U/ml each) and L‐glutamine (2 mM). Transfections of plasmids (Lipofectamine LTX with PLUS Reagent) and siRNAs (HiPerfect) were carried out according to the manufacturer's instructions. Control human primary fibroblasts were from Coriell Cell Repositories (GM01650 and GM00323, designated as controls 1 and 2 in this study), and BSCL2 patient fibroblasts S3 and S5 were established from forearm skin biopsies of patients described in Boutet et al (2009). Fibroblasts were cultured in MEM, with 15% non‐heat‐inactivated FBS supplemented with penicillin/streptomycin and L‐glutamine. Primary human fibroblasts were transfected with Amaxa Human Dermal Fibroblasts Nucleofector Kit (Lonza) according to the manufacturer's instructions.
Generation of endogenously tagged seipin‐sfGFP
Superfolder‐GFP (Pédelacq et al, 2006) and a 3XGGGGS linker were inserted at the C‐terminus of endogenous seipin by CRISPR/Cas9‐mediated genome editing (Pinder et al, 2015). Briefly, a homology‐directed repair template was generated by overlap PCR and transfected into A431 cells together with a vector encoding Cas9, sgRNA targeting the C‐terminus of seipin locus, and a puromycin selection marker. Clones were isolated after transient selection with puromycin. See Appendix Fig S4 for details of the constructs.
Delipidation, LD induction, and cell fusion
Cells were delipidated by culturing in serum‐free medium supplemented with 5% lipoprotein‐deficient serum [LPDS; prepared as described in Goldstein et al (1983)] for 3 days. For experiments involving LD induction, unless otherwise stated, cells were supplemented with 0.2 mM OA [final concentration, OA supplemented in complex with BSA in 8:1 molar ratio prepared in serum‐free DMEM as described in Hölttä‐Vuori et al (2013)] for indicated times. For cell fusion, cells were first co‐plated for 2.5 h. Fusion was induced by adding PEG 1500 (50% w/v) to the cells for 1 min at RT, followed by four washes with PBS.
Click‐labeling and lipid analysis
Alkyne‐OA click assay was performed essentially as described in Thiele et al (2012). Briefly, for A431 cells 1 h prior to alkyne‐OA labeling delipidated cells grown in 6‐cm dishes were transferred to CO2‐independent medium containing 5% LPDS only or 5% LPDS and 0.1 mM OA and transferred to 37°C water bath. Cells were then pulsed for 10 min with 0.1 mM alkyne‐OA in 10 mg/ml fatty acid‐free BSA medium and collected, or further incubated in chase medium (10% FBS or 0.1 mM OA) for 20 min. For fibroblasts, pulse and chase times were doubled to account for slower alkyne‐OA uptake and metabolism, chase medium contained 0.1 mM OA, and incubations were performed at 37°C, 5% CO2. Lipids were then extracted and the extracts reacted with 3‐azido‐7‐hydroxycoumarin in the presence of Cu(I) as in Thiele et al (2012). After the click reaction, products were separated on standard silica gel TLC plates and the plates developed and imaged as described in Thiele et al (2012). Densitometric analysis of the fraction of alkyne‐OA incorporated into cellular lipids was analyzed from images as percentage of total lane intensity with ImageJ FIJI.
Neutral lipid analysis and BPY‐C12 incorporation into lipids
For analysis of neutral lipid content, lipids were extracted and analyzed by high‐performance TLC as described in Hölttä‐Vuori et al (2012). For analysis of BPY‐C12 incorporation into cellular lipids, lipids were extracted as described and separated on standard silica gel plates as described (Thiele et al, 2012) and visualized using a FLA‐9000 imager.
Statistical analyses
The results are expressed as mean ± SEM or SD as indicated. Statistical analysis was performed in Microsoft Excel and Prism (GraphPad). Normality of data was assessed with D'Agostino & Pearson omnibus normality test, and parametric or non‐parametric tests indicated were used accordingly. F‐test was used to assess for variance, and t‐tests assuming or not assuming equal variance were used accordingly. P‐values < 0.05 were considered statistically significant.
Descriptions of antibodies and reagents, plasmids and siRNAs, generation of stable cell lines, quantitative PCR, Western blotting, light and electron microscopy, and image processing and analysis can be found in Appendix Supplementary Materials and Methods.
Author contributions
EI, EJ, VTS, and SL designed the study. VTS, IB, SL, LK, HV, and MH‐V conceived and performed experiments and analyzed data. JM, CV, and CT provided tools and techniques. EI and VTS wrote the manuscript, and all authors commented on the manuscript.
Conflict of interest
The authors declare that they have no conflict of interest.
Supporting information
Appendix
Expanded View Figures PDF
Movie EV1
Movie EV2
Movie EV3
Movie EV4
Movie EV5
Movie EV6
Movie EV7
Movie EV8
Movie EV9
Movie EV10
Source Data for Expanded View and Appendix
Review Process File
Acknowledgements
We acknowledge technical assistance by P. Kaipainen, A. Uro, M. Veikkola, M. Lindman, and A. Salminen and support by the Biomedicum Imaging Unit, especially M. Liljeström and A. Isomäki. We thank the Core Facility for Advanced Light Microscopy, Montebello, Oslo University Hospital, for access to the 3D‐SIM microscope and V. Sørenson for assistance. This study was supported by grants from the Academy of Finland (EI grants 272130, 282192, 284667; EJ grants 131650, 1287975), The Finnish Medical Foundation (VTS), Helsinki Biomedical Graduate School (VTS), Sigrid Juselius Foundation (EI), Biocenter Finland (EJ and IB), Institut National de la Santé et de la Recherche Médicale (Inserm) (JM and CV), Aide aux Jeunes Diabétiques (JM and CV), Société Francophone du Diabète (JM and CV), and Deutsche Forschungsgemeinschaft (CT grant SFB645).
The EMBO Journal (2016) 35: 2699–2716
References
- Binns D, Lee S, Hilton CL, Jiang Q‐X, Goodman JM (2010) Seipin is a discrete homooligomer. Biochemistry 49: 10747–10755 [DOI] [PMC free article] [PubMed] [Google Scholar]
- Boutet E, El Mourabit H, Prot M, Nemani M, Khallouf E, Colard O, Maurice M, Durand‐Schneider A‐M, Chrétien Y, Grès S, Wolf C, Saulnier‐Blache J‐S, Capeau J, Magré J (2009) Seipin deficiency alters fatty acid Delta9 desaturation and lipid droplet formation in Berardinelli‐Seip congenital lipodystrophy. Biochimie 91: 796–803 [DOI] [PubMed] [Google Scholar]
- Brasaemle DL, Barber T, Wolins NE, Serrero G, Blanchette‐mackie EJ, Londos C (1997) Adipose differentiation‐related protein is an ubiquitously expressed lipid storage droplet‐associated protein. J Lipid Res 38: 2249–2263 [PubMed] [Google Scholar]
- Cartwright BR, Goodman JM (2012) Seipin: from human disease to molecular mechanism. J Lipid Res 53: 1042–1055 [DOI] [PMC free article] [PubMed] [Google Scholar]
- Cartwright BR, Binns DD, Hilton CL, Han S, Gao Q, Goodman JM (2015) Seipin performs dissectible functions in promoting lipid droplet biogenesis and regulating droplet morphology. Mol Biol Cell 26: 726–739 [DOI] [PMC free article] [PubMed] [Google Scholar]
- Chen W, Yechoor VK, Chang BH‐J, Li MV, March KL, Chan L (2009) The human lipodystrophy gene product Berardinelli‐Seip congenital lipodystrophy 2/seipin plays a key role in adipocyte differentiation. Endocrinology 150: 4552–4561 [DOI] [PMC free article] [PubMed] [Google Scholar]
- Chu M, Sampath H, Cahana DY, Kahl CA, Somwar R, Cornea A, Roberts CT, Varlamov O (2014) Spatiotemporal dynamics of triglyceride storage in unilocular adipocytes. Mol Biol Cell 25: 4096–4105 [DOI] [PMC free article] [PubMed] [Google Scholar]
- Fei W, Shui G, Gaeta B, Du X, Kuerschner L, Li P, Brown AJ, Wenk MR, Parton RG, Yang H (2008) Fld1p, a functional homologue of human seipin, regulates the size of lipid droplets in yeast. J Cell Biol 180: 473–482 [DOI] [PMC free article] [PubMed] [Google Scholar]
- Fei W, Zhong L, Ta MT, Shui G, Wenk MR, Yang H (2011) The size and phospholipid composition of lipid droplets can influence their proteome. Biochem Biophys Res Commun 415: 455–462 [DOI] [PubMed] [Google Scholar]
- Fujimoto Y, Itabe H, Kinoshita T, Homma KJ, Onoduka J, Mori M, Yamaguchi S, Makita M, Higashi Y, Yamashita A, Takano T (2007) Involvement of ACSL in local synthesis of neutral lipids in cytoplasmic lipid droplets in human hepatocyte HuH7. J Lipid Res 48: 1280–1292 [DOI] [PubMed] [Google Scholar]
- Goldstein JL, Basu SK, Brown MS (1983) Receptor‐mediated endocytosis of low‐density lipoprotein in cultured cells. Methods Enzymol 98: 241–260 [DOI] [PubMed] [Google Scholar]
- Grippa A, Buxó L, Mora G, Funaya C, Idrissi F‐Z, Mancuso F, Gomez R, Muntanyà J, Sabidó E, Carvalho P (2015) The seipin complex Fld1/Ldb16 stabilizes ER‐lipid droplet contact sites. J Cell Biol 211: 829–844 [DOI] [PMC free article] [PubMed] [Google Scholar]
- Guimaraes SC, Schuster M, Bielska E, Dagdas G, Kilaru S, Meadows BRA, Schrader M, Steinberg G (2015) Peroxisomes, lipid droplets, and endoplasmic reticulum ‘hitchhike’ on motile early endosomes. J Cell Biol 211: 945–954 [DOI] [PMC free article] [PubMed] [Google Scholar]
- Herms A, Bosch M, Reddy BJN, Schieber NL, Fajardo A, Rupérez C, Fernández‐Vidal A, Ferguson C, Rentero C, Tebar F, Enrich C, Parton RG, Gross SP, Pol A (2015) AMPK activation promotes lipid droplet dispersion on detyrosinated microtubules to increase mitochondrial fatty acid oxidation. Nat Commun 6: 7176 [DOI] [PMC free article] [PubMed] [Google Scholar]
- Hölttä‐Vuori M, Vainio S, Kauppi M, Van Eck M, Jokitalo E, Ikonen E (2012) Endosomal actin remodeling by coronin‐1A controls lipoprotein uptake and degradation in macrophages. Circ Res 110: 450–455 [DOI] [PubMed] [Google Scholar]
- Hölttä‐Vuori M, Salo VT, Ohsaki Y, Suster ML, Ikonen E (2013) Alleviation of seipinopathy‐related ER stress by triglyceride storage. Hum Mol Genet 22: 1157–1166 [DOI] [PubMed] [Google Scholar]
- Jacquier N, Choudhary V, Mari M, Toulmay A, Reggiori F, Schneiter R (2011) Lipid droplets are functionally connected to the endoplasmic reticulum in Saccharomyces cerevisiae . J Cell Sci 124: 2424–2437 [DOI] [PubMed] [Google Scholar]
- Kano F, Kondo H, Yamamoto A, Kaneko Y, Uchiyama K, Hosokawa N, Nagata K, Murata M (2005) NSF/SNAPs and p97/p47/VCIP135 are sequentially required for cell cycle‐dependent reformation of the ER network. Genes Cells 10: 989–999 [DOI] [PubMed] [Google Scholar]
- Kaprielian Z, Robinson SW, Fambrough DM, Kessler PD (1996) Movement of Ca(2+)‐ATPase molecules within the sarcoplasmic/endoplasmic reticulum in skeletal muscle. J Cell Sci 109: 2529–2537 [DOI] [PubMed] [Google Scholar]
- Kassan A, Herms A, Fernández‐Vidal A, Bosch M, Schieber NL, Reddy BJN, Fajardo A, Gelabert‐Baldrich M, Tebar F, Enrich C, Gross SP, Parton RG, Pol A (2013) Acyl‐CoA synthetase 3 promotes lipid droplet biogenesis in ER microdomains. J Cell Biol 203: 985–1001 [DOI] [PMC free article] [PubMed] [Google Scholar]
- Kuerschner L, Moessinger C, Thiele C (2008) Imaging of lipid biosynthesis: how a neutral lipid enters lipid droplets. Traffic 9: 338–352 [DOI] [PubMed] [Google Scholar]
- Magré J, Delépine M, Khallouf E, Gedde‐Dahl T, Van Maldergem L, Sobel E, Papp J, Meier M, Mégarbané A, Bachy A, Verloes A, d'Abronzo FH, Seemanova E, Assan R, Baudic N, Bourut C, Czernichow P, Huet F, Grigorescu F, de Kerdanet M et al (2001) Identification of the gene altered in Berardinelli‐Seip congenital lipodystrophy on chromosome 11q13. Nat Genet 28: 365–370 [DOI] [PubMed] [Google Scholar]
- Martell JD, Deerinck TJ, Sancak Y, Poulos TL, Mootha VK, Sosinsky GE, Ellisman MH, Ting AY (2012) Engineered ascorbate peroxidase as a genetically encoded reporter for electron microscopy. Nat Biotechnol 30: 1143–1148 [DOI] [PMC free article] [PubMed] [Google Scholar]
- Mishra S, Khaddaj R, Cottier S, Stradalova V, Jacob C, Schneiter R (2016) Mature lipid droplets are accessible to ER luminal proteins. J Cell Sci 129: 3803–3815 [DOI] [PubMed] [Google Scholar]
- Ohsaki Y, Cheng J, Suzuki M, Fujita A, Fujimoto T (2008) Lipid droplets are arrested in the ER membrane by tight binding of lipidated apolipoprotein B‐100. J Cell Sci 121: 2415–2422 [DOI] [PubMed] [Google Scholar]
- Ohsaki Y, Suzuki M, Fujimoto T (2014) Open questions in lipid droplet biology. Chem Biol 21: 86–96 [DOI] [PubMed] [Google Scholar]
- Ohsaki Y, Kawai T, Yoshikawa Y, Cheng J, Jokitalo E, Fujimoto T (2016) PML isoform II plays a critical role in nuclear lipid droplet formation. J Cell Biol 212: 29–38 [DOI] [PMC free article] [PubMed] [Google Scholar]
- Payne VA, Grimsey N, Tuthill A, Virtue S, Gray SL, Nora ED, Semple RK, Rahilly SO, Rochford JJ (2008) The human lipodystrophy gene BSCL2/seipin may be essential for normal adipocyte differentiation. Diabetes 57: 2055–2060 [DOI] [PMC free article] [PubMed] [Google Scholar]
- Pédelacq J‐D, Cabantous S, Tran T, Terwilliger TC, Waldo GS (2006) Engineering and characterization of a superfolder green fluorescent protein. Nat Biotechnol 24: 79–88 [DOI] [PubMed] [Google Scholar]
- Pinder J, Salsman J, Dellaire G (2015) Nuclear domain ‘knock‐in’ screen for the evaluation and identification of small molecule enhancers of CRISPR‐based genome editing. Nucleic Acids Res 43: 9379–9392 [DOI] [PMC free article] [PubMed] [Google Scholar]
- Pol A, Gross SP, Parton RG (2014) Review: biogenesis of the multifunctional lipid droplet: lipids, proteins, and sites. J Cell Biol 204: 635–646 [DOI] [PMC free article] [PubMed] [Google Scholar]
- Poppelreuther M, Rudolph B, Du C, Großmann R, Becker M, Thiele C, Ehehalt R, Füllekrug J (2012) The N‐terminal region of acyl‐CoA synthetase 3 is essential for both the localization on lipid droplets and the function in fatty acid uptake. J Lipid Res 53: 888–900 [DOI] [PMC free article] [PubMed] [Google Scholar]
- Rambold AS, Cohen S, Lippincott‐Schwartz J (2015) Fatty acid trafficking in starved cells: regulation by lipid droplet lipolysis, autophagy, and mitochondrial fusion dynamics. Dev Cell 32: 678–692 [DOI] [PMC free article] [PubMed] [Google Scholar]
- Robenek H, Hofnagel O, Buers I, Robenek MJ, Troyer D, Severs NJ (2006) Adipophilin‐enriched domains in the ER membrane are sites of lipid droplet biogenesis. J Cell Sci 119: 4215–4224 [DOI] [PubMed] [Google Scholar]
- Shubeita GT, Tran SL, Xu J, Vershinin M, Cermelli S, Cotton SL, Welte MA, Gross SP (2008) Consequences of motor copy number on the intracellular transport of kinesin‐1‐driven lipid droplets. Cell 135: 1098–1107 [DOI] [PMC free article] [PubMed] [Google Scholar]
- Sim MFM, Talukder MMU, Dennis RJ, O'Rahilly S, Edwardson JM, Rochford JJ (2013) Analysis of naturally occurring mutations in the human lipodystrophy protein seipin reveals multiple potential pathogenic mechanisms. Diabetologia 56: 2498–2506 [DOI] [PMC free article] [PubMed] [Google Scholar]
- Szymanski KM, Binns D, Bartz R, Grishin NV, Li W, Agarwal AK, Garg A, Anderson RGW, Goodman JM (2007) The lipodystrophy protein seipin is found at endoplasmic reticulum lipid droplet junctions and is important for droplet morphology. Proc Natl Acad Sci USA 104: 20890–20895 [DOI] [PMC free article] [PubMed] [Google Scholar]
- Talukder MMU, Sim MFM, O'Rahilly S, Edwardson JM, Rochford JJ (2015) Seipin oligomers can interact directly with AGPAT2 and lipin 1, physically scaffolding critical regulators of adipogenesis. Mol Metab 4: 199–209 [DOI] [PMC free article] [PubMed] [Google Scholar]
- Targett‐Adams P, Chambers D, Gledhill S, Hope RG, Coy JF, Girod A, McLauchlan J (2003) Live cell analysis and targeting of the lipid droplet‐binding adipocyte differentiation‐related protein. J Biol Chem 278: 15998–16007 [DOI] [PubMed] [Google Scholar]
- Thiele C, Papan C, Hoelper D, Kusserow K, Gaebler A, Schoene M, Piotrowitz K, Lohmann D, Spandl J, Stevanovic A, Shevchenko A, Kuerschner L (2012) Tracing fatty acid metabolism by click chemistry. ACS Chem Biol 7: 2004–2011 [DOI] [PubMed] [Google Scholar]
- Walther TC, Farese RV (2012) Lipid droplets and cellular lipid metabolism. Annu Rev Biochem 81: 687–714 [DOI] [PMC free article] [PubMed] [Google Scholar]
- Wang C‐W, Miao Y‐H, Chang Y‐S (2014) Control of lipid droplet size in budding yeast requires the collaboration between Fld1 and Ldb16. J Cell Sci 127: 1214–1228 [DOI] [PubMed] [Google Scholar]
- Wang H, Becuwe M, Housden BE, Chitraju C, Porras AJ, Graham MM, Liu XN, Thiam AR, Savage DB, Agarwal AK, Garg A, Olarte M‐J, Lin Q, Fröhlich F, Hannibal‐Bach HK, Upadhyayula S, Perrimon N, Kirchhausen T, Ejsing CS, Walther TC et al (2016) Seipin is required for converting nascent to mature lipid droplets. Elife 5: 133–150 [DOI] [PMC free article] [PubMed] [Google Scholar]
- Wilfling F, Wang H, Haas JT, Krahmer N, Gould TJ, Uchida A, Cheng J‐X, Graham M, Christiano R, Fröhlich F, Liu X, Buhman KK, Coleman RA, Bewersdorf J, Farese RV, Walther TC (2013) Triacylglycerol synthesis enzymes mediate lipid droplet growth by relocalizing from the ER to lipid droplets. Dev Cell 24: 384–399 [DOI] [PMC free article] [PubMed] [Google Scholar]
- Wolinski H, Kolb D, Hermann S, Koning RI, Kohlwein SD (2011) A role for seipin in lipid droplet dynamics and inheritance in yeast. J Cell Sci 124: 3894–3904 [DOI] [PubMed] [Google Scholar]
- Wolinski H, Hofbauer HF, Hellauer K, Cristobal‐Sarramian A, Kolb D, Radulovic M, Knittelfelder OL, Rechberger GN, Kohlwein SD (2015) Seipin is involved in the regulation of phosphatidic acid metabolism at a subdomain of the nuclear envelope in yeast. Biochim Biophys Acta 11: 1450–1464 [DOI] [PubMed] [Google Scholar]
Associated Data
This section collects any data citations, data availability statements, or supplementary materials included in this article.
Supplementary Materials
Appendix
Expanded View Figures PDF
Movie EV1
Movie EV2
Movie EV3
Movie EV4
Movie EV5
Movie EV6
Movie EV7
Movie EV8
Movie EV9
Movie EV10
Source Data for Expanded View and Appendix
Review Process File