Abstract
Anterior cruciate ligament (ACL) ruptures rank among the most prevalent and costly sports-related injuries. Current tendon grafts used for ACL reconstruction are limited by suboptimal biomechanical properties. We have addressed these issues by engineering multiphasic bone-ligament-bone (BLB) constructs which develop structural and mechanical properties similar to native ACL. The purpose of this study was to examine the acute remodeling process that occurs as the BLB grafts advance toward the adult ligament phenotype in vivo. Thus, we implanted BLB constructs fabricated from male cells into female host sheep and allowed 3,7,14 or 28 days (n=4 at each time point) for recovery. To address whether or not graft-derived cells were even necessary, a subset of BLB constructs (n=3) were acellularized, implanted and allowed 28 days for recovery. At each recovery time point, the following histological analyses were performed: Picrosirius red staining to assess collagen alignment and immunohistochemistry to assess both graft development and host immune response. PCR analysis, performed on every explanted BLB, was used to detect the presence of graft-derived male cells remaining in the constructs and/or migration into surrounding host tissue. The analysis of the PCR and histology samples revealed a rapid migration of host-derived macrophages and neutrophils into the graft at 3 days, followed by increased collagen density and alignment, vascularization, innervation and near complete repopulation of the graft with host cells within 28 days. This study provides a greater understanding of the processes of ligament regeneration in our BLB constructs as they remodel towards the adult ligament phenotype.
Keywords: tissue engineering, scaffoldless, ACL reconstruction, remodeling
Introduction
Anterior cruciate ligament (ACL) ruptures are among the most prevalent and costly sports-related injuries, occurring at a frequency of 200,000 tears per year in the United States.1 These injuries cause knee instability, leading to meniscal damage and osteoarthritis. As a result, surgical intervention is usually recommended to reconstruct the damaged ligament with graft tissue2. ACL grafts are created from autologous or allogenic sources; however, in either case, poor enthesis formation and inappropriate graft mechanical properties contribute to elevated rates of re-injury, with >10% of repairs failing in the long-term.3–6 Additionally, the common use of autologous tendon graft tissue often results in donor site morbidity, which may hinder recovery for the patient7. Furthermore, mismatched biomechanical properties from the autologous or allogenic graft tissues may contribute to the osteoarthritis burden postoperatively.3–6
In response to these limitations, tissue-engineering approaches to ACL reconstruction are under investigation. Our laboratory has previously fabricated scaffoldless, multiphasic bone-ligament-bone (BLB) constructs from bone marrow stromal cells (BMSCs), which have been evaluated for ACL reconstruction8. We have demonstrated that by six to nine months in vivo in a sheep model, these grafts develop similar structural and mechanical properties to the native ACL.8–12 We have also demonstrated similar efficacy between BLB grafts fabricated from autologous and allogeneic cell sources, as well as allogeneic BLB grafts frozen for storage, indicating that these constructs may offer a true “off-the-shelf” technology for ligament reconstruction.11,12
Understanding the remodeling process that the BLB constructs undergo in vivo is critical to advancing this technology. The remodeling process is characterized by changes in both cellular content and structural properties. The presence of graft-derived cells or their removal by host-derived cells will help drive graft-host biointegration and graft maturation. At six months in vivo, these constructs exhibit longitudinal collagen and elastin organization indistinguishable from native ACL tissue.8 The regenerated ligament was vascularized and innervated as early as two months in vivo.8 These cellular and structural developments result in viscoelastic properties that are nearly indistinguishable from native adult ACL.8–12
The relative timing of the host cell migration into the BLB construct and the spatial relationships between these cells is crucial to the cellular process of regeneration. Neutrophils and macrophages likely contribute to removal of graft-derived cells, removal of cellular debris and instigate the repopulation of these constructs by host-derived cells. Foreign tissue can induce inflammation with varied response by macrophage type; pro-inflammatory macrophages (M1) and anti-inflammatory macrophages (M2) are integral components of these inflammation-related regenerative processes13–17. M1 macrophages secrete inflammatory cytokines and nitric oxide, promoting pathogen destruction, while M2 macrophages promote matrix deposition for tissue remodeling.13–17 Therefore, characterizing the timing of immune cells presence within our BLB constructs in vivo helps identify the host immune system’s role in the maturation of the graft tissue. A more complete understanding of the graft-host response is critical for bringing this BLB technology toward clinical application. Thus, the purpose of this study was to investigate in vivo cellular turnover and structural maturation at four critical time points: 3, 7, 14 and 28 days, following ACL reconstruction. We hypothesized that host-derived cells, such as fibroblast and immune cells, would infiltrate the BLBs and promote the regeneration of the graft to a more mature ligament phenotype. Since implanted (exogenous) cells were suspected to be the important agents in the BLB remodeling process, we further hypothesized that after 28 days, the acellularized BLB group would be less developed compared to cellular BLBs explanted at the same time point.
Methods
Experimental Design and Animal Care
We used our previously established model of ACL replacement in adult Black Suffolk sheep due to the anatomical and functional similarities between sheep and human knees8. In this study, BMSCs were aspirated from five adult male sheep to fabricate our tissue engineered constructs for use as ACL replacement graft tissue in female recipients. BLBs fabricated from each donor were divided into the five different groups (3, 7, 14, and 28-day, and acellularized) to eliminate donor variability. All animals (n=4 for 3, 7 14, and 28-day, and n=3 for the acellularized group) were acclimated to the Unit for Laboratory Animal Medicine husbandry facilities at the University of Michigan for at least one week prior to any procedure. Sheep were given access to food and water ad libitum. All animal care and animal surgeries were performed in accordance with The Guide of Care and Use of Laboratory Animals (Public Health Service, 2011 NIH Publication No. 85-23); the experimental protocol (PRO00005978) was approved by the University Committee for the Use and Care of Animals.
Preparation of Cell Culture Supplies
Unless otherwise indicated, all solutions and media were prepared and stored at 4°C before the isolation & culture of primary cells and were warmed to 37°C in a heated bead bath prior to use. The media used in this experiment have been previously described.8,9,11,12 Briefly, growth medium (GM) consisted of 78% Dulbecco’s modified Eagle medium (DMEM; Gibco, Grand Island, NY, USA), with 20% fetal bovine serum (FBS; Gibco, Grand Island, NY, USA), 2% antibiotic anti-mycotic (ABAM; Grand Island, NY, USA), 6ng/mL basic fibroblast growth factor (bFGF; Peprotech, Rocky Hill, NJ, USA), 0.13 mg/mL ascorbic acid-2-phosphotase (Sigma-Aldrich, St. Louis, MO), and 0.05 mg/mL L-proline (Sigma-Aldrich, St. Louis, MO, USA); differentiation medium (DM) consisted of 91% DMEM, 7% horse serum (HS; Gibco, Grand Island, NY, USA), 2% ABAM, 0.13 mg/mL asc-2-phos, 0.05 mg/mL L-proline, and 2 ng/mL transforming growth factor beta (TGF-b; Peprotech, Rocky Hill, NJ, USA). 10−8 M dexamethasone (DEX; Sigma-Aldrich, St. Louis, MO, USA) was added to GM and DM for the culture of bone cells.
Construct dishes were prepared as described previously to form and maintain three-dimensional constructs8,9. Briefly, 100 mm diameter cell culture plates were coated with 12 ml Sylgard (Dow Chemical Corp., Midland, MI, USA; type 184 silicon elastomer) and allowed to cure for 3 weeks at room temperature. Prior to use, plates were decontaminated with UV light (wavelength 253.7 nm) for 60 min and rinsed with 70% EtOH and DPBS.
Isolation and Expansion of BMSCs
Marrow aspirations were used to obtain bone marrow stromal cells (BMSCs) for construct fabrication. Bone marrow was aspirated from the iliac crest of a sheep using a Monoject Illinois needle (Sherwood Medical Company, St. Louis, MO, USA) with the animal under general anesthesia induced by intravenous propofol and sustained with inhalation of isoflurane in oxygen. Marrow was collected using heparinized needles and dispensed into EDTA blood collection tubes (BD, San Jose, CA, USA) for processing.
The collected marrow aspirate was filtered through a 100 mm filter to remove solid debris with 15 ml marrow consolidated into a conical with an equivalent volume of DPBS added. A layer of 15 ml Ficoll-Paque Premium (MNC; GE Healthcare, Munich, Germany) was added on top of the aspirate solution and was centrifuged (AccuSpin FR; Beckman Coulter Inc., Fullerton, CA, USA) at room temperature at 600 g for 30 minutes. The upper layer of plasma was discarded and the mesenchymal cells contained in the mononuclear cell layer were transferred into a new conical. The isolate was then centrifuged at 500 g for 10 minutes and the supernatant removed. An equivalent volume to the pellet of ACK lysing buffer (Gibco, Grand Island, NY, USA) was added and mixed for 30 seconds to lyse any remaining red blood cells. The conical was then filled with DPBS and centrifuged at 400 g for 5 minutes to wash the cells. After the supernatant was removed, the pellet was resuspended in 20 ml GM and a cell count was taken. Cells were then plated at 40,000 cells/cm2 in cell culture dishes.
Fabrication of BLBs
BMSCs were expanded into ligament and bone lineages using slight modifications to a previously described procedure.8,9,11,12 Briefly, passage-3 cells in the ligament pathway and passage-4 cells in the bone pathway were seeded at a density of 21,000 cells/cm2 and switched to DM after 8 days of culture. Plates used for bone were 100 mm diameter and plates for ligament were 150 mm diameter. After two days in DM, the bone monolayers were rolled with sterile tweezers into a tube shape and transferred to Sylgard plates. After one to two additional days, the bone constructs were then ready to be incorporated into a ligament monolayer to create our BLB. Each confluent ligament monolayer was removed intact from the cell culture plate surface and transferred to Sylgard plates where they were pinned back into a single monolayer of cells. Bone constructs were then pinned on each end of the ligament monolayer and subsequently surrounded by ligament tissue. The length of the BLB was adjusted with minutien pins to the desired length of approximately 60–80 mm comprised of at least a 30 mm ligament portion and two 15–20 mm bone ends. Two to five of these constructs were placed side-by-side and allowed to fuse to achieve the final dimensions of the BLB: 6.5–8 cm long and 4–5mm wide at the ligament region. (Figure 1A). The DM was changed thereafter every 2–3 days. After an additional 2–3 weeks in culture, the fully formed BLB was ready for implantation. Prior to implanting, the bone ends of the BLB were threaded with non-absorbable 5-0 silk suture to allow for passage into the 6 mm bone tunnel and fixation onto the periosteum.
Figure 1.
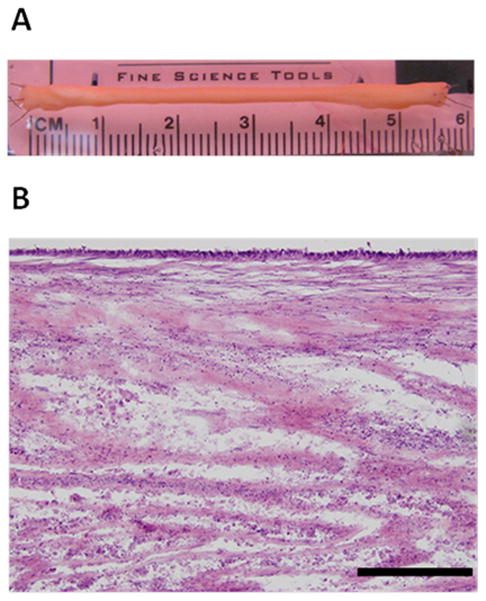
In Vitro BLB (A) Representative image of BLB. Each ACL BLB construct was fabricated with 2-5 smaller BLBs made of a 30 mm ligament portion flanked by two 15 mm bone ends. These constructs were placed side-by-side and allowed to fuse in vitro before implantation. (B) Representative longitudinal H&E section of a BLB in vitro prior to implantation. Scale bar indicates 200 μm.
Surgical Procedure
ACL replacements were performed arthroscopically based on a previously described procedure.8,9,11,12 Briefly, after induction of general anesthesia and preparation of the surgical site, two 6 mm incisions were made at the joint line on either side of the patellar tendon for arthroscopic access. After excising the native ACL, remnants of the stump on both the femur and tibia were left to aid in anatomical positioning of the BLB. Drill guides were used to position Steinmann pins in the center of the tibial and femoral footprints. Cannulated reamers were used over the pins to drill 5–6 mm bone tunnels. The BLB was then passed through the bone tunnels with suture and the proximal and distal ends were secured with suture to the periosteum with the knee in 30 degrees of flexion. Incisions were closed with staples and the surgical site was sprayed with Alushield (Neogen Corp., Lansing, MI, USA).
Acellularized BLB Protocol
For the acellularized group, BLBs were fabricated as described above and acellularized prior to implantation using previously established methods in Haase et al.18 The acellularized BLBs were explanted after 28 days in vivo.
Sheep Tissue DNA Extraction Protocol
DNA was extracted from sheep tissue using the following protocol. 500 μL lysis buffer (10 mM Tris-HCl 8.5, 5 mM EDTA, 0.2% SDS, 200 mM NaCl, 100μL proteinase K) was added to a tube containing each tissue sample and placed overnight at 50°C on a shaker moving 200–300 RPM. The tubes were then inverted, vortexed, and centrifuged for 10 minutes at 14,000 RPM. 450 μL of supernatant and 450 μL of isopropanol were mixed in new tubes. The tubes were inverted until a precipitate appeared. The supernatant was pipetted out and the pellets were resuspended in 25 μL of PCR grade water. Samples were then placed on a shaker moving 200 RPM for one hour at 50°C then stored at −20°C until used for PCR.
Sheep Blood/Synovial Fluid DNA Extraction Protocol
DNA was extracted from sheep blood and synovial fluid using the following protocol. Blood and synovial fluid was collected in EDTA blood collection tubes and cryovials respectively. 100 μL of fluid sample and 200 μL of lysis buffer (0.32M sucrose, 10 mM Tris-HCl pH 7.5, 5 mM MgCl2, 1% v/v Triton X-100) were combined then vortexed in a 1.5 microfuge tube. Tubes were centrifuged for 30 seconds at 16000 RCF. Supernatant was removed. Centrifugation was repeated 1–3 more times, or until no more hemoglobin remained. The nuclear pellet was resuspended in 100 μL of PBND (50 mM KCl, 10 mM Tris-Hcl pH 8.3, 2.5 mM MgCl2, 0.1 mg/mL gelatin, 0.45% (v/v) Nonident P-40, 0.45% (v/v) Tween® 20) with 60 μg/mL proteinase K and incubated for 1 hour at 55°C. Samples were then heated to 97°C to ensure proteinase K inactivation before being stored at −20°C until used for PCR.
Polymerase Chain Reaction (PCR) Protocol
PCR-based assay for Y chromosome detection in BLBs, synovial fluid, blood, bicep femoris muscle, patellar tendon, Hoffa’s fat pad, and bone marrow samples was performed with UcdO43 and ZFX/ZFY (P1-5EZ & P2-3EZ) primers as described in Gutierrez-Adan et al.19 To ensure that negative results weren’t due to PCR failure, samples were run with both UcdO43 and ZYX/ZFY primers. PCR controls were as follows: 25 pg male sheep DNA in 50 ng female sheep DNA, 100 pg male sheep DNA, 100 pg female sheep DNA and a blank lane. In certain samples, when PCR efficiency was low, the 25 pg male DNA and 25 pg male DNA in 50 pg female DNA controls was replaced with a 50 pg male DNA and 50 pg male DNA in 50 ng female DNA. Three sections of each BLB were tested: BLB spanning intracapsular space, BLB found within the femoral bone tunnel, and BLB found within the tibial bone tunnel. In the PCR results, if any of these three sections showed detectable levels of male DNA, that particular BLB was considered positive for male sheep DNA. PCR was only performed on samples with successfully isolated DNA.
Histological Analysis
After 3, 7, 14, and 28 days of implantation, BLBs and contralateral native ACLs were dissected for morphological analysis. For histological preparation, samples were fixed in 4% paraformaldehyde at room temperature for 2 hours, washed in PBS, and placed 15% sucrose overnight and then 30% sucrose overnight. Samples were then frozen in Tissue-Tek ® O.C.T. Compound at −80°C until processing. Each tissue sample was sectioned to 12 μm using a cryostat, placed onto Superfrost Plus microscopy slides and stored at −20°C. For morphological characteristics, sections were stained with hematoxylin and eosin (H&E)20. Picrosirius red staining kit and associated protocol (cat# 24901-500 Polysciences, Inc. Warrington, PA, USA). was used for analysis of collagen content and fiber organization. Semi-quantitative analysis was performed of the collagen fiber birefringence using previously established methods.21 Under uniform conditions, sections stained for picrosirius red were imaged at 10X magnification in a single session under monochromatic polarized light rotated in the plane for maximum brightness. Images were imported using ImageJ software into 8 bit gray scale showing collagenous material representing a gray scale value 1–255 and non-collagenous components as dark with a gray scale value of zero. The entire area of each sample was imaged at 4X and merged in Photoshop. Mean gray scale values of the entire tissue of each animal were obtained using ImageJ to assign a brightness value for comparison.
For immunohistological analysis of CD31, neurofilament, caspase-3, neutrophils, general macrophages and M2 macrophages, slides were fixed in methanol for 10 minutes at −20°C. All slides were then washed in phosphate buffered saline-0.1% Triton X-100 (PBST) (Sigma-Aldrich, St. Louis, MO, USA) for 15 minutes at room temperature. Sections were covered in blocking solution containing PBST with 3% Bovine Serum Albumin (Sigma-Aldrich, St. Louis, MO, USA) for 30 minutes at room temperature. Primary antibodies were diluted in blocking solution and added to the sections and incubated overnight at 4°C in a hydration chamber. The dilutions of the primary antibodies used were as follows: 1:100 rabbit anti-CD31 (Abbiotec, San Diego, CA, USA, #250590); 1:200 mouse anti-neurofilament (Abcam, Cambridge, MA, USA, #AB24574); 1:50 rabbit anti-Caspase-3 (Abcam, Cambridge, MA, USA, #AB4051); 1:100 rat anti-neutrophil (Abcam, Cambridge, MA, USA, #AB53453); 1:100 mouse anti-human CD68 (Dako, Carpinteria, CA, USA, #M071801-5); and 1:100 mouse anti-CD163 (Abcam, Cambridge, MA, USA, #AB111250). Slides were then washed for 5 minutes in PBST at room temperature three times for a total of 15 minutes. Secondary antibodies were diluted at 1:500 in blocking solution in the dark and added to the sections. The slides were kept in a hydration chamber and incubated at room temperature for 2.5 hours. The slides were then washed for 15 minutes in PBS at room temperature three times for a total of 45 minutes. Nuclei were stained using Prolong Gold with DAPI (Sigma-Aldrich, St. Louis, MO, USA) on each section. Slides were then cover slipped and incubated overnight at room temperature before imaging with an Olympus BX-51 microscope. For the CD31 stain only, antigen retrieval was performed after the methanol fixation step by submerging slides in citrate buffer (Thermo Fisher Scientific, Waltham, MA, USA, #00-5001) in a pressure cooker for 10 minutes.
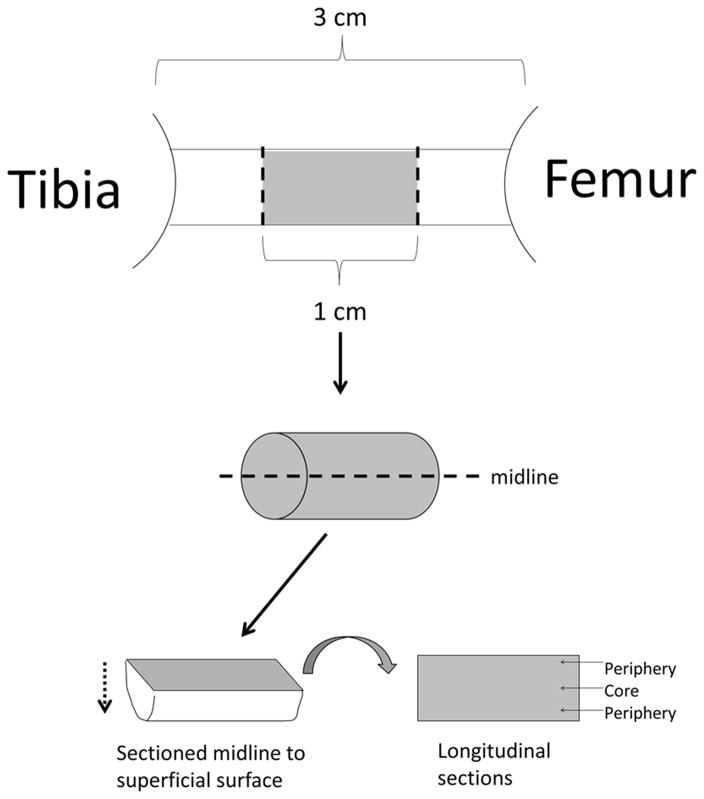
Immunohistological quantification was achieved by first taking the middle 1 cm of the tissue spanning the intra-articular space and splitting this tissue longitudinally at the midline into two samples to expose the entire mid portion of the graft, including tissue from the periphery and core (Figure 2). The samples were sectioned at 12 μm starting from the midline and moving towards the superficial surface, taking sections for 6 separate stains. For each stain we analyzed two separate sections per sheep, n=4 for 3, 7, 14 and 28 days, and n=3 for acellularized group. Each tissue section was stained and imaged at 20X. Longitudinal sections were analyzed by superimposing a 3×3 grid (composed of 0.572 mm2 rectangles) on to the sample and all 9 areas of the grid were quantified. For each section of the grid, an image was taken of the secondary antibody fluorescent channel and DAPI channel. Merged co-stain images of each section were created using ImageJ. A cell was considered positively stained when it showed co-localization of both secondary antibody and DAPI fluorescence. The number of positive stained cells and total number of cells (indicated by DAPI-stained nuclei) for each section were counted by hand after ImageJ thresholding and recorded for analysis. For each sample grid, the percentage positive stained cells over total cells was averaged. The averages for each of the two tissue sections were then averaged together for the final percentage of positive stained cells in each individual BLB construct. For total construct cell density, DAPI counts from the macrophage/neutrophil co-stained and M2 macrophage stained images were averaged. Tissues from the contralateral ACL were used as control.
Figure 2.
Sectioning Procedure for Histological Analysis: Immunohistological quantification was achieved by first taking the middle 1 cm of the tissue spanning the intra-articular space and splitting this tissue longitudinally at the midline into two samples to expose the entire mid portion of the graft, including tissue from the periphery and core. The samples were sectioned at 12 μm starting from the midline and moving towards the superficial surface, taking sections for 6 separate stains.
Statistical Analysis
Comparisons among all five groups were done using one-way analysis of variance (ANOVA) with Tukey’s post hoc test. A p-value of <0.05 was considered significant for all tests. All data were reported as mean ± standard deviation.
Results
Gross Morphology& Cellularity
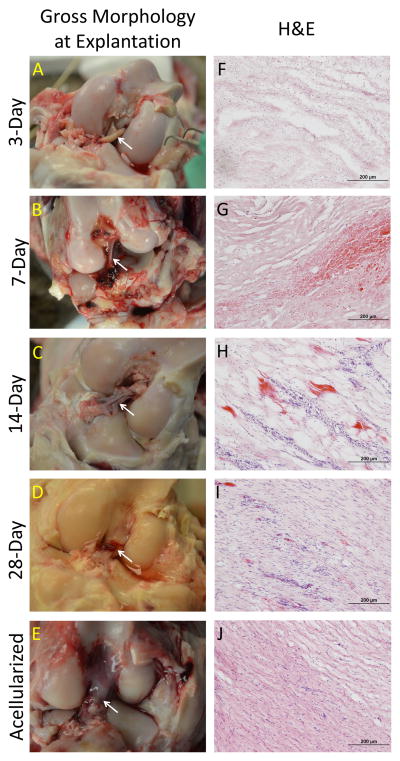
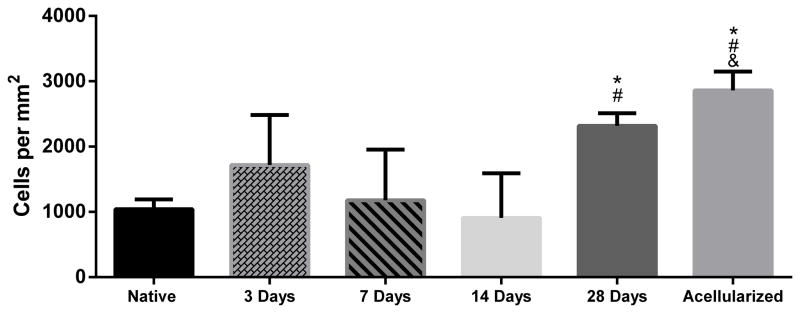
Images taken at the time of explant revealed the gross morphology of the BLB after 3, 7, 14, and 28 days in vivo (Figure 3). BLBs at the 3-day time point showed the most variability in gross morphology. Two of the four 3-day BLBs looked very much like the graft prior to implantation (Figure 1A, Figure 4, A–B). However, the other two 3-day grafts had already been encapsulated by blood clots and host-derived tissue, suggesting that the remodeling process had already begun (Figure 4, C–D). At the 7 and 14 day time points, blood clots spanning the length of the intracapsular space are observed in majority of samples (Figure 3, B–C). By 28 days, blood clots were no longer observed in the intracapsular space, and the BLB constructs had increased in diameter (Figure 3D). H&E stains showed disorganized, collagenous tissue within the constructs at 3 days. At 7 and 14 days post-implantation, the BLB constructs became more acellular, as indicated by a decrease in stained nuclei (Figure 3, G, H). By 28 days, cellularity within the BLBs had increased and acellularized BLBs showed repopulation of graft tissue by host-derived cells (Figure 3, I, J). Total cell counts revealed an average cell density of 1041± 151 cells/mm2 in native ACL tissue, 1719± 766 cells/mm2 in BLBs at the 3-day time point, 1178± 777 cells/mm2 at the 7-day time point, 908± 684 cells/mm2 at the 14-day time point, 2318 ± 198 cells/mm2 at the 28-day time point, and 2862 ± 289 cells/mm2 in the acellularized group (Figure 5).
Figure 3.
Gross Morphology of BLB constructs at day of explanation. (A–E) Image of BLBs during explantation. White arrows indicate BLB within the intracapsular space. Blood clots were evident in the intracapsular space in 7 and 14 day samples (B,C). (F–J) Longitudinal H&E of BLB constructs at each time point.
Figure 4.
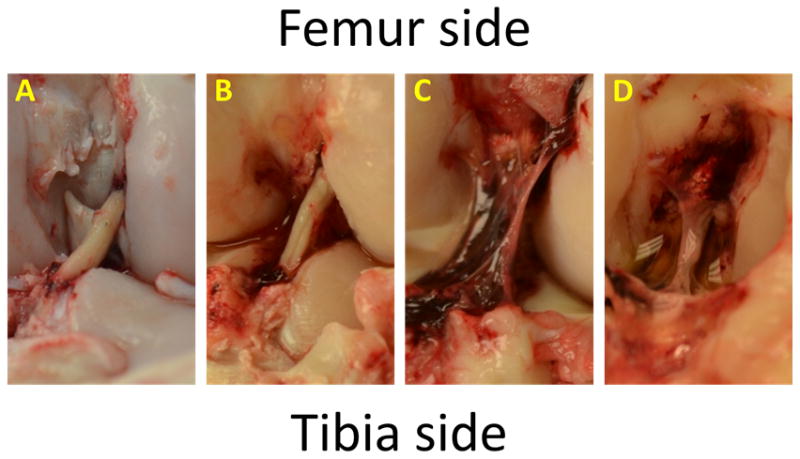
Gross Morphology of 3-Day BLBs. BLBs at the 3-day time point showed the most variability in gross morphology. Two of the four 3-day BLBs looked very much like the graft prior to implantation (A,B), however, the other two 3-day grafts had already been encapsulated by blood clots and endogenous tissue, suggesting that the remodeling process had already begun (C–D).
Figure 5.
Cell Density of BLB constructs. For total construct cell density, DAPI counts from the macrophage/neutrophil co-stain and M2 macrophage stain were averaged. There was a decrease in nuclei in the BLB at 7 and 14 days post implantation followed by an infiltration of new cells by 28 days. At 28 days, acellularized constructs reveal increased cell density by host cell infiltration. (*) indicates significance compared to the native ACL control. (#) indicates significance compared to the 14-day time point. (&) indicates significance compared to the 7-day time point.
PCR Analysis
Following explant of the BLB, Y chromosome PCR was performed and used to determine the fate of male graft-derived cells originally in the BLB construct at implantation. Three regions of the BLB were tested for Y chromosome content: 1) BLB tissue spanning the intracapsular space, 2) BLB tissue from within femoral bone tunnel, and 3) BLB from within the tibial bone tunnel. For the BLB samples results from the three successful PCR gels showed that at 3 days, two of the three BLB constructs contained detectable levels of male DNA. However, it is unlikely that all the male DNA had been removed from the one of the 3-day BLBs after only 3 days in vivo. A possible explanation for the negative results could be that the DNA isolated from the three BLB regions was actually from host-derived tissue, such as the blood clot surrounding the BLB (Figure 4C). At 7 and 14 days, male DNA was detected in three of the four BLB constructs, and at 28 days, male DNA was detected in two of four BLB constructs (Table 1). Male DNA was not detected anywhere within acellularized BLB constructs after 28 days in vivo (Table 1). PCR data did not reveal male DNA in synovial fluid, blood, bicep femoris muscle, patellar tendon, Hoffa’s fat pad, or bone marrow samples taken from the surgical side.
Table 1.
Detection of male cells by Y chromosome PCR analysis.
| # of BLBs that contain male DNA | |
|---|---|
| 3-Day | 2/3* |
| 7-Day | 3/4 |
| 14-Day | 3/4 |
| 28-Day | 2/4 |
| Acellularized | 0/3 |
BLB constructs were engineered from bone marrow derived mesenchymal stem cells (MSCs) obtained from male donor sheep. There was significant amplification of the Y-chromosome specific sequence Ucd043 in both the pre-implant and 3-day explant samples. Three sections of each BLB were tested: BLB spanning intracapsular space, BLB found within the femoral bone tunnel, and BLB found within the tibial bone tunnel. In the PCR results, if any of these three sections showed detectable levels of male DNA, that particular BLB was considered positive for male sheep DNA. The numerators represent the number of BLBs containing male DNA, and the denominators are the total number of successfully tested BLBs for each group.
Insufficient DNA for PCR for one of the 3-day samples.
Neurofilament & CD31 Immunohistological Stains
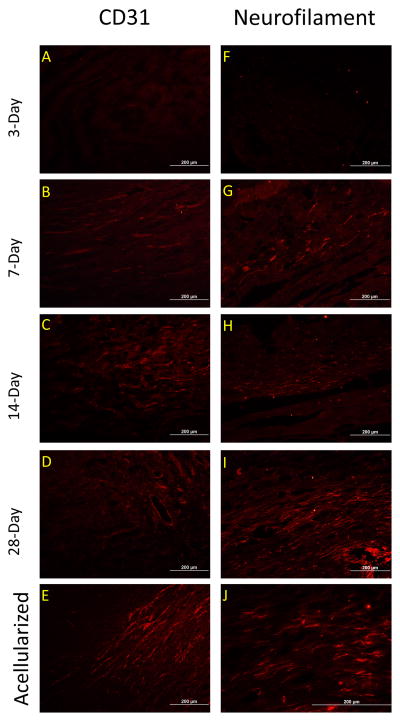
Functional integration of host tissue with the BLB graft tissue was characterized by examining the presence of innervation and vascularization (Figure 6). Immunohistological stains revealed neurofilament stained neurons and CD-31 stained vasculature in the BLB constructs at the 7-day time point (Figure 6B & 6G). By 28 days in vivo, both nerves and vasculature in the BLB constructs have elongated (Figure 6, D,E,I,J).
Figure 6.
Development of innervation and vasculature in BLB constructs. (A–E) Innervation, assessed with neurofilament first appeared in BLB construct by 7 days in vivo (B) and continued to form longer filament strands from 14 to 28 days (C,D, E) (F–J) Vasculature assessed with CD31first appeared in the BLB construct by 1 week in vivo (G). Vascularization increased with time in vivo (I–J).
Picrosirius Red Stain
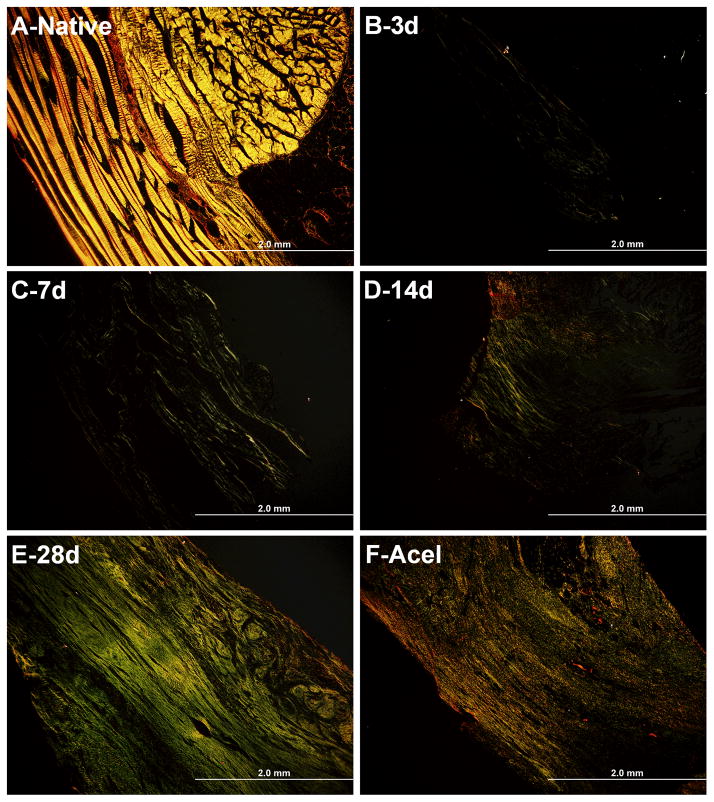
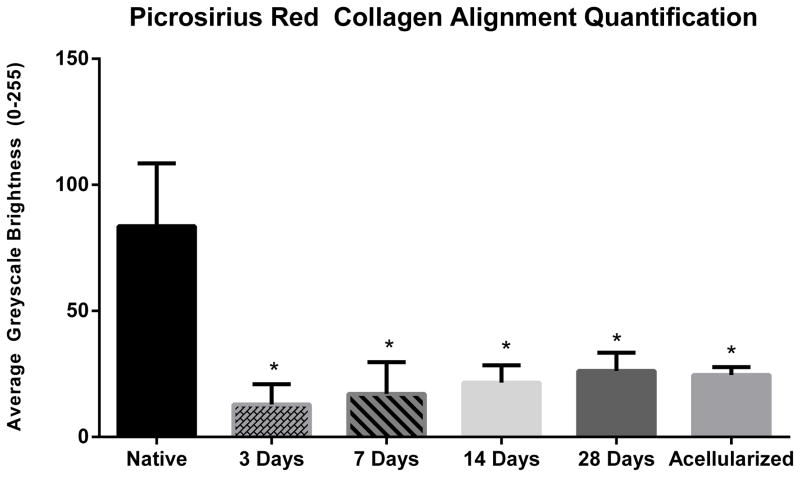
Picrosirius red staining was used to characterize collagen content and alignment of the BLB constructs as they matured in vivo (Figure 7). BLB samples viewed through polarized light demonstrated increased collagen alignment over time in vivo (Figure 7, B–E). The brightness analysis revealed an average greyscale brightness of 83.63 ±24.90 for native ACL, 12.88 ±8.08 brightness at the 3-day time point, 17.08 ±12.65 brightness at the 7-day time point, 21.60 ±6.82 brightness at the 14-day time point, 26.21 ± 7.20 brightness at the 28-day time point, and 24.64 ± 3.12 brightness for the acellularized group. There is a clear positive correlation between brightness intensity and time in vivo (Figure 8) suggesting an increase in remodeling of the collagen fibers to a more adult phenotype.
Figure 7.
Picrosirius Red Analysis of collagen alignment in BLB constructs. Picrosirius red staining showed a positive trend between time in vivo and brightness intensity. (A–F) Native ACL morphology of collagen alignment (n=4) (A) compared to BLB collagen alignment at 3 days (n=4) (B), 7 days (n=3) (C), 14 daysweeks (n=3) (D), 28 days (n=4) (E), and for the acellularized group (n=3) (F).
Figure 8.
Picrosirius Red Quantification. The brightness analysis revealed an average greyscale brightness of 83.63 ±24.90 for native ACL, 12.88 ±8.08 brightness at the 3-day time point, 17.08 ±12.65 brightness at the 7-day time point, 21.60 ±6.82 brightness at the 14-day time point, 26.21 ± 7.20 brightness at the 28-day time point, and 24.64 ± 3.12 brightness for the acellularized group. Construct collagen alignment at all time points was significantly less than native ligament. (P<0.05).
Caspase-3
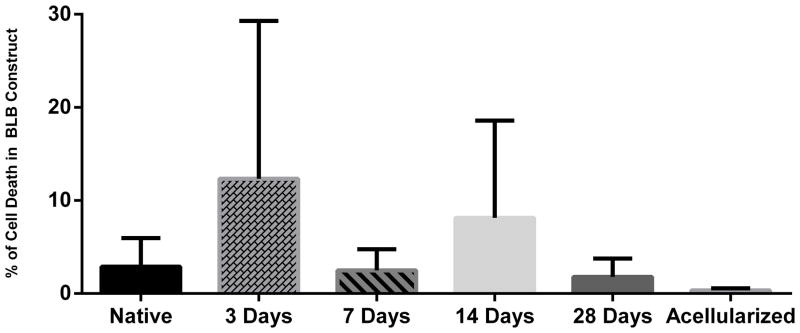
Histological analysis of caspase-3 positive cells was performed to measure apoptosis within the BLB constructs at each time point. Quantification of caspase-3 staining showed an average 2.90 ± 3.01% cell death for native ACL ligament, an increase 12.34 ± 16.95% in cell death at 3 days, and a decrease back to baseline levels 2.49 ± 2.27% cell death at 7 days, 8.13 ± 10.46% cell death at 14 days, 1.98 ± 1.54 % cell death at 28 days, and 0.34 ± 0.19% cell death for the acellularized group (Figure 9). A post-hoc analysis found no significance between any of the groups.
Figure 9.
Percentage Cell Death (Caspase-3) in BLB constructs. Percentage cell death in BLB constructs at 3 days (n=3), 7 days (n=4), 14 days (n=4), 28 days (n=4), and the acellularized group (n=3) compared to native ACL ligament (n=3). Quantification of caspase-3 staining showed an average 2.90 ± 3.01% cell death for native ACL ligament, an increase 12.34 ± 16.95% in cell death at 3 days, and a decrease back to baseline levels 2.486 ± 2.27% cell death at 7 days, 8.126 ± 10.46% cell death at 14 days, 1.98 ± 1.54 % cell death at 28 days, and 0.336 ± 0.19% cell death for the acellularized group. The percentage cell death was not significantly different compared to native ACL for any time points (p<0.05).
Neutrophil Stain
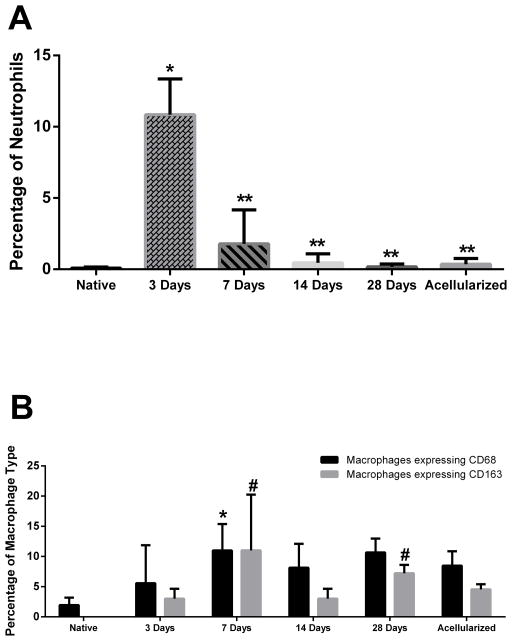
In order to examine the inflammatory response of the host innate immune system, histological analysis of neutrophil content was performed. Quantification of neutrophil staining showed an average 0.08 ± 0.09% of neutrophils within native ACL, 10.85 ±2.50% of neutrophils within the construct at 3 days, 1.78 ± 2.39% at 7 days, 0.46 ± 0.62% at 14 days, 0.17 ± 0.21% at 28 days, and 0.36 ± 0.40% at acellularized group (Figure 10A). These results revealed significant neutrophil infiltration 3 days post-implantation when compared to native neutrophil levels (p<0.05). By 7 days post-implantation, the neutrophil percentage within the construct had significantly decreased (p<0.05) and were not significantly different from native levels for all subsequent time points.
Figure 10.
Neutrophil and Macrophage Percentages in BLB constructs. (A) Percentage neutrophils in BLB constructs at 3 days (n=3), 7 days (n=4), 14 days (n=3), 28 days (n=4), and acellularized group (n=3) compared to native ACL ligament (n=4). Neutrophil percentage at the 3-day time point is significantly higher than native ACL levels. Quantification of neutrophil staining showed an average 0.08 ± 0.09% of neutrophils within native ACL, 10.85 ±2.50% of neutrophils within the construct at 3 days, 0.46 ± 0.62% at 7 days, 0.46 ± 0.62% at 14 days, 0.17 ± 0.21% at 28 days, and 0.36 ± 0.40% in the acellularized group.(*) indicates significance compared to the native ACL control. (**) indicates significance compared to the 3-day time point. (B) Total macrophage percentage, marked by CD68, in BLB construct at 3 days (n=4), 7 days (n=4), 14 days (n=3), 28 days (n=4), and in the acellularized group (n=3) compared to native ACL (n=4). Total M2 macrophage percentage, marked by CD163, in BLB construct at 3 days (n=4), 7 days (n=3), 14 days (n=4), 28 days (n=4), and acellularized group (n=3) compared to native ACL (n=3). The average percentage of all macrophages (CD68) in the BLB construct was 7.40 ± 6.26% for the 3-day time point, 11.00 ± 4.39% in the 7-day time point, 8.15 ± 3.95% in the 14-day time point, 10.66 ± 2.30% in the 28-day time point, and 8.46 ± 2.40% for the acellularized group. For the total macrophage data (CD68), * indicates significance compared to the native ACL control. The average percent of M2 macrophage (CD163) in native ACL ligament is 0.01 ± 0.002%. The average percent of M2 macrophages (CD163) in the BLB construct was 3.00 ± 1.65% for the 3-day time point, 6.69 ± 3.99% for the 7-day time point, 3.00 ± 1.65% in the 14-day time point, 7.22± 1.39% for the 28-day time point, and 4.55 ± 0.86% for the acellularized group. For the M2 macrophage data (CD163), # indicates significance compared to the native ACL control. Total macrophage percentage was significantly higher at the 7-day time point. M2 macrophage percentage was significantly higher at both the 7-day and 28-day time points when compared to native ACL (p<0.05).
General Macrophage and M2 Macrophage Stains
In order to investigate the role of the host immune response in the maturation and integration of BLB constructs in vivo, general macrophage marker CD68 and anti-inflammatory macrophage marker CD163 were used to characterize the presence of total and M2 macrophages, respectively. The average percentage of macrophages in native ACL ligament is 1.94 ± 1.23%. The average percentage of all macrophages (CD68) in the BLB construct was 7.40 ± 6.26% for the 3-day time point, 11.00 ± 4.39% in the 7-day time point, 8.15 ± 3.95% in the 14-day time point, 10.66 ± 2.30% in the 28-day time point, and 8.46 ± 2.40% for the acellularized group. The average percent of M2 macrophage (CD163) in native ACL ligament is 0.01 ± 0.002% (Figure 10B). The average percent of M2 macrophages (CD163) in the BLB construct was 3.00 ± 1.65% for the 3-day time point, 6.69 ± 3.99% for the 7-day time point, 3.00 ± 1.65% in the 14-day time point, 7.22± 1.39% for the 28-day time point, and 4.55 ± 0.86% for the acellularized group (Figure 10B). A post-hoc analysis revealed that the total level of macrophages was significantly higher at the 7-day time point when compared to native levels, and that the level of M2 macrophages was significantly higher than native levels at both the 7-day and 28-day time points (p<0.05).
Discussion
The purpose of this study was to evaluate the acute remodeling process of our implanted scaffoldless bone-ligament-bone (BLB) constructs and better understand the progression of cellular and structural changes that occur during in vivo maturation. At the 3-day time point, the BLB constructs were composed of disorganized bands of collagen fibrils between regions of collagen-rich cellular tissue; constructs were also partially or entirely encapsulated in clotted red blood cells (RBC) (Figure 3, A,F, Figure 4). The high neutrophil percent of 10.58 ± 2.50% within the constructs suggested an acute inflammatory response likely initiated by circulating macrophages responding to post-surgical inflammation22. This inflammatory response is likely critical to the remodeling process. Blood vessels and nerves were not present at day 3 (Figure 6, A,F). PCR analysis found male DNA in two of the three BLB constructs, indicating that graft-derived cells were still present in the graft.
At 7 days, the first signs of tissue remodeling following acute inflammation were observed. Neutrophil levels decreased from 10.58 ± 2.50% at 3 days to 0.46 ± 0.62% at 7 days, while total macrophage and M2-macrophage levels peaked, suggesting a shift in the host immune response (Figure 10). The clearance of neutrophils is known to induce anti-inflammatory functions within macrophages21, which could explain the significantly higher levels of M2 macrophages present at this time point. Vascularization and innervation within the constructs indicated structural maturation (Figure 6, B, G). The PCR analysis for the 7-day constructs showed male DNA in three of the four BLBs, indicating the presence of graft-derived cells in the tissue. Between the 3 and 7-day time points, cell density decreased from 1719 ± 766 cells/mm2 to 1178 ± 767 cells/mm2, suggesting that the host-derived cell population within the graft was decreasing. These results, in conjunction with the significantly elevated levels of host-derived macrophages, implicate the host immune system’s involvement in the removal of these graft-derived cells.
At 14 days, the BLB constructs demonstrated a marked advancement in morphology. The graft tissue had matured from loosely connected collagenous bands into a uniform, dense tissue (Figure 3H, Figure 7D). The fascicular structure of adult ligament was not observed yet, but aligned collagen fibers with native-like crimp patterns were visible throughout the graft tissue. Innervation and vascularization continued (Figure 6, C,H). The overall cellularity of the grafts continued to decrease, with an average cell density of 907.58 ± 684.16 cells/mm2. PCR analysis revealed three of the four BLBs contained detectable levels of male DNA, indicating graft-derived cells were still present in the tissue. The decrease in male sheep DNA and cellularity within the BLB implies that the BLBs were being acellularized, likely by the host-derived immune cells that were present within the construct.
At 14 days, two constructs were partially encapsulated in blood clots rich with M2 macrophages. While the overall macrophage percentage remained similar between the 7 and 14-day time points, there was a decline in M2 macrophages from 6.69 ± 3.99% to 3.00 ± 1.65%, suggesting tissue regeneration had begun. While M2 macrophages are known for matrix deposition and tissue healing, an overabundance of M2 macrophages can lead to excessive fibrosis16,17, with the balance between M1 and M2 macrophages critical to equilibrium. Therefore, a shift in macrophage type away from a high M2 macrophage population at this time point could indicate a return to an equilibrium between pro and anti-inflammatory macrophages and less fibrosis throughout construct remodeling.
At 28 days, the graft tissue was dense and uniform, with increased collagen crimp organization as well as innervation and vascularity, indicating advancement toward the adult ligament phenotype (Figure 3I, Figure 7E). However, the quantitative picrosirius red analysis showed that collagen alignment in the graft tissue at 28 days was still significantly lower than in native ACL, suggesting that the BLBs were still developmentally immature compared to mature ligament tissue, and that the grafted tissue is still remodeling towards the adult phenotype. Host cell repopulation of the BLBs was evident by the significant increase in cell density between the 14 and 28-day time point. Clotted RBC’s had been removed and neutrophil percentage remained near native ACL levels of 0.08 ± 0.09%. M2 macrophage levels were significantly higher at this time point, suggesting that tissue remodeling and wound healing was still underway. PCR analysis showed a continued decrease in male DNA within the BLBs. Two of the four BLBs had no detectable male DNA content, suggesting that the graft-derived cell population within the graft tissue was decreasing. This observation in conjunction with the significantly elevated M2 macrophage levels could suggest M2 macrophages were removing graft-derived cellular debris from graft tissue as a part of the remodeling process. The significant increase in cell density from the 14-day to the 28-day time point was another indicator of tissue remodeling that demonstrated host-derived cell were infiltrating graft tissue. Thus, these results suggest that the BLBs are being acellularized during the first weeks in vivo and ultimately may serve as a optimized scaffold for infiltrating host-derived cells, such as fibroblasts. The continued advancements in innervation, vascularization, and collagen alignment also suggested that construct remodeling towards a mature ACL phenotype was ongoing.
The acellularized group, which was explanted at 28 days, had very similar properties to fresh 28-day BLBs. Acellularized graft tissue showed dense, crimped collagen-rich tissue containing nerves and vessels (Figure 7F, Figure 6, E,J). Picrosirius red quantification revealed that collagen alignment in the acellularized group was higher than BLBs from the 3, 7 and 14-day time points. However, the acellularized group had a slightly lower collagen alignment than the 28-day time point, though not significantly different. The acellularized group was not statistically different from the 28-day BLBs in cell density, or the percentage of cell death, neutrophils, total macrophages, and M2 macrophages. Without the presence of graft-derived cells, host-derived cells still infiltrated and repopulated graft tissue, further supporting the conclusion that our BLBs acted as an optimized scaffold for host-derived cells to begin the remodeling process.
Contrary to our hypothesis, the structural and cellular similarities between the acellularized and cellular BLBs explanted acutely at 28 days suggested that graft-derived cells may not be necessary for tissue regeneration observed in our longer term, 6-month studies. The lack of significant differences between these groups after explantation indicated that the acellularity of the graft did not affect its remodeling capabilities in vivo. Thus, the use of acellularized constructs is an attractive alternative to cellular constructs, as the lack of foreign cells could reduce the likelihood of immune rejection, allow easier integration into surrounding host tissue, and ultimately improve ACL regeneration.
These data suggest a mechanism of BLB maturation. The first event was an acute infiltration of graft tissue by host-derived immune cells, as indicated by the significantly elevated percentages of both neutrophils in 3-day BLBs and both total and M2 macrophages in 7-day BLBs. The second event was the decrease of graft-derived cells and infiltration of host-derived cells within graft tissue, suggesting the onset of ligament tissue regeneration.
The progression of cellular replacement corresponds to the structural alterations seen in the BLB grafts. In the 7-day BLBs, the tissue content was non-uniform, consisting of alternating bands of dense and diffuse collagen. Maturation in collagen structure was noted at 28 days, when the grafts showed collagen alignment and a crimp pattern. This shift in structural properties was likely due to the aforementioned cellular alterations. During the early inflammatory first 14 days, host immune cells migrated into the graft tissue. Their presence within the BLBs could indicate the removal of graft cells, which would have allowed the constructs to be repopulated with the host cells necessary for cellular remodeling of collagen fibers. As this occurred, the grafts became vascularized and innervated creating the optimal environment for ligament regeneration. These results suggest the importance of the acute host immune response in the remodeling process of our BLB constructs as they mature in vivo.
Acknowledgments
The authors would like to acknowledge contributions by Chris J. Larkin, Pablo Moncada-Larrotiz, Brian C. Syverud, Stoyna S. Novakova, and Delta L. Leeper, as well as the support of NIH R21 grant: R21AR063444-01, The University of Michigan Microscopy, Imaging & Analysis Laboratory (MIL) and Animal Surgery Operating Rooms (ASOR).
Footnotes
Declaration of Interest
The authors have no competing financial interests.
References
- 1.Surgeons, A.A.O.S. Anterior Cruciate Ligament Injury: Surgical Considerations. 2007 Available at http://orthoinfo.aaos.org/topic.cfm?topic=A00297#A00297_R4_anchor.
- 2.Fu FH, Bennett CH, Ma CB, Menetrey J, Lattermann C. Current trends in anterior cruciate ligament reconstruction. Part II. Operative procedures and clinical correlations. Am J Sports Med. 2000;28(1):124–130. doi: 10.1177/03635465000280010801. [DOI] [PubMed] [Google Scholar]
- 3.Barker JU, Drakos MC, Maak TG, Warren RF, Williams RJ, Allen AA. Effect of graft selection on the incidence of postoperative infection in anterior cruciate ligament reconstruction. Am J Sports Med. 2010;38(2):281–286. doi: 10.1177/0363546509346414. [DOI] [PubMed] [Google Scholar]
- 4.Deacon A, Bennell K, Kiss ZS, Crossley K, Brukner P. Osteoarthritis of the knee in retired, elite Australian Rules footballers. Med J Aust. 1997;166(4):187–90. doi: 10.5694/j.1326-5377.1997.tb140072.x. [DOI] [PubMed] [Google Scholar]
- 5.Roos EM. Joint injury causes knee osteoarthritis in young adults. Curr Opin Rheumatol. 2005;17:195–200. doi: 10.1097/01.bor.0000151406.64393.00. [DOI] [PubMed] [Google Scholar]
- 6.Wojtys EM, Brower AM. Anterior cruciate ligament injuries in the prepubescent and adolescent athlete: clinical and research considerations. J Athl Train. 2010;45:509. doi: 10.4085/1062-6050-45.5.509. [DOI] [PMC free article] [PubMed] [Google Scholar]
- 7.Duquin TR, Wind WM, Fineberg MS, Smolinski RJ, Buyea CM. Current trends in anterior cruciate ligament reconstruction. J Knee Surg. 2009;22:7. doi: 10.1055/s-0030-1247719. [DOI] [PubMed] [Google Scholar]
- 8.Ma J, Smietana MJ, Kostrominova TY, Wojtys EM, Larkin LM, Arruda EM. Three-dimensional engineered bone-ligament-bone constructs for anterior cruciate ligament replacement. Tissue Eng Part A. 2012;18(1–2):103–116. doi: 10.1089/ten.tea.2011.0231. [DOI] [PMC free article] [PubMed] [Google Scholar]
- 9.Ma J, Goble K, Smietana MJ, Kostrominova TY, Larkin LM, Arruda EM. Morphological and functional characteristics of three-dimensional engineered bone-ligament-bone constructs following implantation. J Biomech Eng. 2009;131(10):101017. doi: 10.1115/1.4000151. [DOI] [PubMed] [Google Scholar]
- 10.Syed-Picard FN, Larkin LM, Shaw CM, Arruda EM. Three-dimensional engineered bone from bone marrow stromal cells and their autogenous extracellular matrix. Tissue Eng Part A. 2009;15(1):187–195. doi: 10.1089/ten.tea.2007.0140. [DOI] [PubMed] [Google Scholar]
- 11.Mahalingam VD, Behbahani-Nejad N, Horine SV, Olsen TJ, Smietana MJ, Wojtys EM, Wellik DM, Arruda EM, Larkin LM. Allogenic Versus Autologous Derived Cells Sources for Use in Engineered Bone-Ligament-Bone Grafts in Sheep Anterior Cruciate Ligament Repair. Tissue Eng Part A. 2015;21(5–6):1047–1054. doi: 10.1089/ten.tea.2014.0422. [DOI] [PMC free article] [PubMed] [Google Scholar]
- 12.Mahalingam VD, Behbahani-Nejad N, Ronan EA, Olsen TJ, Smietana MJ, Wojtys EM, Wellik DM, Arruda EM, Larkin LM. Fresh versus frozen engineered bone-ligament-bone grafts for sheep anterior cruciate ligament repair. Tissue Eng Part C Methods. 2015;21(6):548–56. doi: 10.1089/ten.tec.2014.0542. [DOI] [PMC free article] [PubMed] [Google Scholar]
- 13.Röszer T. Understanding the Mysterious M2 Macrophage Through Activation Markers and Effector Mechanisms. Mediators of inflammation. 2015;2015:16. doi: 10.1155/2015/816460. Article ID 186460. [DOI] [PMC free article] [PubMed] [Google Scholar]
- 14.Ferrante CJ, Leibovich SJ. Regulation of macrophage polarization and wound healing. Adv Wound Care. 2012;1:10–16. doi: 10.1089/wound.2011.0307. [DOI] [PMC free article] [PubMed] [Google Scholar]
- 15.Sica A, Mantovani A. Macrophage plasticity and polarization: in vivo veritas. J Clin Invest. 2012;122(3):787–795. doi: 10.1172/JCI59643. [DOI] [PMC free article] [PubMed] [Google Scholar]
- 16.Meneghin A, Hogaboam CM. Infectious disease, the innate immune response, and fibrosis. J Clin Invest. 2007;117(3):530–538. doi: 10.1172/JCI30595. [DOI] [PMC free article] [PubMed] [Google Scholar]
- 17.Eaton KV, Yang HL, Giachelli CM, Scatena M. Engineering macrophages to control the inflammatory response and angiogenesis. J Biomed Eng. 2015;339(2):300–309. doi: 10.1016/j.yexcr.2015.11.021. [DOI] [PMC free article] [PubMed] [Google Scholar]
- 18.Haase SC, Rovak JM, Dennis RG, Kuzon WM, Jr, Cederna PS. Recovery of Muscle Contractile Function Following Nerve Gap Repair with Chemically Acellularized Peripheral Nerve Grafts. J reconstr Microsurg. 2003;19(4):241–248. doi: 10.1055/s-2003-40580. [DOI] [PubMed] [Google Scholar]
- 19.Gutiérrez-Adan A, Cushwa WT, Anderson GB, Medrano JF. Ovine-specific Y chromosome RAPD-SCAR marker for embryo sexing. Anim Genet. 1997;28(2):135–138. doi: 10.1111/j.1365-2052.1997.00104.x. [DOI] [PubMed] [Google Scholar]
- 20.Luna LG. Institute of Pathology, editor. Manual of histologic staining methods of the Armed Forces. McGraw-Hill; New York: 1968. Mayer’s Hematoxylin & Eosin Stain (H&E) [Google Scholar]
- 21.Cohen DB, Kawamura S, Ehteshami JR, Rodeo SA. Indomethacin and celecoxib impair rotator cuff tendon-to-bone healing. Am J Sports Med. 2006;34(3):362–9. doi: 10.1177/0363546505280428. [DOI] [PubMed] [Google Scholar]
- 22.Soehnlein O, Lindbom L. Phagocyte partnership during onset and resolution of inflammation. Nat Rev Immunol. 2010;10:427–439. doi: 10.1038/nri2779. [DOI] [PubMed] [Google Scholar]


