Abstract
Gradient-echo (GE) echo-planar imaging (EPI) is the method of choice in blood-oxygenation level-dependent (BOLD) functional MRI (fMRI) studies, as it demonstrates substantially higher BOLD sensitivity than its spin-echo (SE) counterpart. However, it is also well known that the GE-EPI signal is prone to signal dropouts and shifts due to susceptibility effects near air–tissue interfaces. SE-EPI, in contrast, is minimally affected by these artifacts. In this study, we quantify, for the first time, the sensitivity and specificity of SE and GE EPI for resting-state fMRI functional connectivity (fcMRI) mapping, using the 1000-brain fcMRI atlas (Yeo et al., 2011) as the pseudoground truth. Moreover, we assess the influence of physiological processes on resting-state BOLD measured using both regular and ultrafast GE and SE acquisitions. Our work demonstrates that SE-EPI and GE-EPI are associated with similar sensitivities, specificities, and intersubject reproducibility in fcMRI for most brain networks, generated using both seed-based analysis and independent component analysis. More importantly, SE-based fcMRI measurements demonstrated significantly higher sensitivity, specificity, and intersubject reproducibility in high-susceptibility regions, spanning the limbic and frontal networks in the 1000-brain atlas. In addition, SE-EPI is significantly less sensitive to prominent sources of physiological noise, including low-frequency respiratory volume and heart rate variations. Our work suggests that SE-EPI should be increasingly adopted in the study of networks spanning susceptibility-affected brain regions, including those that are important to memory, language, and emotion.
Keywords: BOLD, gradient echo, heart rate, hippocampus, inferior temporal, orbitofrontal, perirhinal cortex, physiological noise, respiratory volume, resting-state fMRI, resting-state functional connectivity, spin echo, susceptibility effects, temporal pole
Introduction
Gradient-echo (GE) echo-planar imaging (EPI) is the method of choice in blood-oxygenation level-dependent (BOLD) functional MRI (fMRI) studies. However, it is also well known that the GE-EPI signal is prone to macroscopic field inhomogeneity effects, which are particularly apparent at air–tissue interfaces. These effects, including signal loss and signal shifts (pileups), are apparent at 3 Tesla (Weiskopf et al., 2006) and scale up with field strength. Notable regions of signal loss and pileup include the orbito-frontal region, the inferior temporal lobe, and the temporal poles. These effects compromise BOLD signal sensitivity and specificity in these areas (Ojemann et al., 1997) and hamper the study of functional connectivity associated with key brain functions, including language (Pobric et al., 2007) and memory (Visser et al., 2010).
Compensatory techniques using z-shimming have shown promise in activation studies (Constable and Spencer, 1999; Yang et al., 2005), but entail additional image acquisitions, which is nonideal for an application such as functional connectivity (fcMRI) mapping. Reducing slice thickness and voxel size also reduces susceptibility-related signal loss (Bellgowan et al., 2006), but at the cost of spatial coverage if acquisition speed is to be maintained. Moreover, while scan parameters such as slice orientation, echo time (TE), and phase-encoding polarity can be chosen to minimize signal loss without introducing additional scan time (Deichmann et al., 2003; Domsch et al., 2013; Weiskopf et al., 2006), they are location dependent and require accurate cross-alignment of multiple scans (Weiskopf et al., 2006).
It has long been established that the spin echo (SE) is T2 weighted, and thus, it is robust against signal loss caused by macroscopic susceptibility gradients (Bandettini et al., 1994; Norris, 2012). Indeed, this feature has allowed spin echo to detect cognitive BOLD response in the orbitofrontal region that was undetectable using gradient echo at 3 T (Norris et al., 2002). Recent works successfully use SE-EPI to probe the BOLD response in the inferior temporal lobe (Binney et al., 2010; Visser et al., 2010). At 3 T, the spin-echo signal has the marginal advantage of being more sensitive to microvascular BOLD and less biased toward draining veins than GE-EPI (Boxerman et al., 1995; Duong et al., 2003; Jochimsen et al., 2004; Norris, 2012; Thulborn et al., 1997). Purely T2-weighted techniques such as HASTE (Poser and Norris, 2007) and RASER (Goerke et al., 2011) aim to eliminate T2* weighting, but introduce high-power deposition, necessitating longer repetition times (TR) that are nonideal for fcMRI applications. Alternatively, asymmetric spin echo (Stables et al., 1998), dual-echo gradient-spin echo (Halai et al., 2014; Schwarzbauer et al., 2010), or 3D GRASE (Feinberg et al., 2008) can be used to compensate for signal loss while boosting BOLD signal contrast. However, these approaches also reduce acquisition speed and are not available on all commercial MR scanners. In comparison, SE-EPI is widely available commercially, entails negligible RF power deposition compared to non-EPI techniques such as HASTE, and its inherent EPI-associated residual T2* at higher spatial frequencies may provide SE-EPI an advantage in terms of BOLD sensitivity.
Another emerging issue for fcMRI is the role of physiological noise. Notably, respiration-related physiological noise is prominent in GE-EPI due to related changes in susceptibility and leads to global off-resonance effects (Van de Moortele et al., 2002). While much of it may be removable using standard denoising methods, our recent work in a phantom clearly illustrates that low-frequency respiratory variability (Birn et al., 2006) leads to a dynamic low-frequency susceptibility variation that can be immune to conventional denoising methods (Khatamian et al., 2015). This effect can result in significant false positives in GE-fcMRI maps (Chang and Glover, 2009). In addition, the typical TR (sampling interval) for whole-brain imaging is 2 sec (a sampling rate of 0.5 Hz), which precludes accurate sampling of cardiac noise (requiring TR of <0.5 sec) (Cordes et al., 2001). Thus, high-frequency cardiac noise would alias into lower frequencies and become impossible to remove using existing denoising methods, and may also compromise the removal of physiological effects due to low-frequency variability in heart rate (CRV) (Chang et al., 2009).
Recently, multislice-accelerated SE-EPI was used for rs-fMRI functional connectivity measurement at 7 T (Koopmans et al. 2012). However, the performance of SE-EPI may be field dependent, given that (1) the relative intra-and extravascular contribution to the GE and SE signals depends on field strength, and the intravascular (large vessel) contribution is greater at 3 T than at 7 T (Uludag et al., 2009); (2) extravascular SE sensitivity is lower at 3 T than at 7 T. However, the effect of physiological noise is more pronounced at 7 T than at 3 T (Triantafyllou et al., 2005), as are T2*-related susceptibility effects, for example, signal dropout and image distortions. These factors would likely translate into differences in the sensitivity (contrast-to-noise) of GE and SE BOLD between field strengths, and necessitates our direct 3 T comparison of GE and SE.
Using 3 T scanning and seed-based analysis of five commonly studied brain networks, Chiacchiaretta and Ferretti (2015) illustrated that SE-fcMRI produced similar results as GE-fcMRI. In our work, we extend the feasibility analysis by explicitly assessing brain networks localized to regions of high-susceptibility effects and by quantifying the fcMRI sensitivity and specificity of each acquisition technique using a 1000-brain fcMRI atlas (Yeo et al., 2011) as the pseudoground truth. In addition, we assess connectivity using both seed-based and independence-component analysis-based approaches. We optimize the SE-EPI echo time based on maximal sensitivity to task-induced neuronal activation. Furthermore, we compare the sensitivity of SE-EPI and GE-EPI to respiration-related physiological noise effects. We find that GE-fcMRI is significantly more sensitive in only one of the six brain networks examined and that sensitivity was not significantly different between SE and GE in the majority of brain networks. Importantly, SE-fcMRI exhibited higher sensitivity and specificity in regions affected by susceptibility artifacts, such as the inferior temporal and medial prefrontal regions, irrespective of spatial-smoothing and physiological correction schemes. Furthermore, SE-EPI is indeed less sensitive to respiratory and cardiac variability, and thus, a potentially more robust tool for mapping functional connectivity.
Materials and Methods
SE fMRI parameter optimization
We tested TEs of 35, 45, 55, 65, and 75 msec by assessing BOLD sensitivity to (1) simultaneous visual and motor sensory tasks and (2) an auditory–visual task. The details are documented elsewhere (Khatamian and Chen, 2013; Ragot et al., 2015). While most fMRI studies have used echo times (TE) of 65–80 msec for SE-EPI (Norris et al., 2002; Schmidt et al., 2005; Thompson et al., 2011; Visser et al., 2010), our data showed that this TE range did not provide the highest BOLD contrast, likely due to signal-to-noise (SNR) limitations and potentially an increasing dominance of physiological noise at longer TEs. Our functional task-based optimization procedure showed that a TE of 45 msec provided a combination of the highest BOLD signal contrast and image SNR.
Participants
We studied nine healthy participants (five men, four women), aged from 21 to 37 years (mean = 27.3 years, SD = 5.87). Participants were recruited through the Baycrest Participants Database, consisting of individuals from the Baycrest and local communities. The study was approved by the Research Ethics Board (REB) of Baycrest, and the experiments were performed with the understanding and written consent of each participant, in accordance with REB guidelines.
MRI acquisition
All images were acquired using a Siemens TIM Trio 3 Tesla System (Siemens). The scans used 32-channel phased-array head coil reception and body-coil transmission. We acquired 8 min of resting-state fMRI (rs-fMRI) data with SE-EPI, with TR/TE = 2000 mecs/45 msec, 3.44 × 3.44 × 4 mm voxel size, totaling 240 frames (lasting 8 min), while the participants remained at rest with eyes closed. To reduce T2*-induced image distortion in the SE-EPI images, we minimized the echo spacing (readout train = 35.2 msec). We compared the results to GE-EPI data acquired during the same sessions and under the same conditions, with TR/TE = 2000 msec/30 msec, 240 frames.
For five of the subjects, we also acquired SE-EPI and GE-EPI data at ultrashort TE to allow facilitate comparison with regular-TE scans in terms of physiological noise effects. The acquisition parameters are as follows: short-TE SE-EPI: TR = 0.346 sec, five slices; short-TE GE-EPI: TR = 0.323 sec, five slices; matrix size, voxel dimensions, and scan duration same as those in regular TE scans.
Cardiac pulsation was recorded using the scanner’s builtin finger oximeter, whereas respiratory bellows measurements were recorded using a BioPac system (BioPac).
Data analysis
Data preprocessing
All fMRI data were slice time corrected, motion corrected, spatially smoothed using a 5 mm Gaussian kernel, and spatially normalized to MNI305 space. We also noted a fat suppression-associated artifactural low-frequency signature (Khatamian and Chen, 2015) in all SE-EPI data, which was only apparent after independent component analysis (ICA) decomposition. This artifact was removed by reconstructing an individual SE-EPI scan from all ICA components with the exception of any that could be identified as resulting from the fat saturation artifact, as described in our previous work (Khatamian and Chen, 2015). Nonetheless, as the artifact was highly localized to the vicinity of the scalp region and was clearly separable from other signals using ICA, it is not expected to affect the reported connectivity analyses.
Independent component analysis
For ICA-based connectivity calculations, following preprocessing, all functional data were high-pass filtered with 0.008 Hz as the cutoff. FSL’s MELODIC tool (Beckmann and Smith, 2004; Damoiseaux et al., 2006) was then used to run a group ICA for all GE-EPI scans through multisession temporal concatenation; the same was done for all SE-EPI scans and then again for all GE-EPI scans, but using only the last 120 frames (4 min) from each scan (GE120). We compared our findings to the functional networks outlined in the 7-network and 17-network rs-fMRI functional network atlases, generated from 1000 data sets by Yeo et al. (2011), hitherto referred to as the “Yeo atlas.” In describing our findings, we also adopt the numberings in the Yeo atlas.
Seed-based functional connectivity analysis
For seed-based analysis, following preprocessing, all functional data were band-pass filtered (0.008–0.09 Hz) and white matter, cerebrospinal fluid, and motion correction signals were included as confound regressors. We applied the following methodology to both smoothed (6 mm kernel) and unsmoothed data.
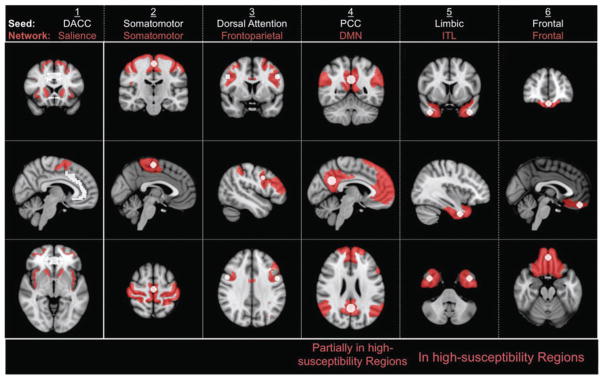
Using the CONN toolbox (Whitfield-Gabrieli and Nieto-Castanon, 2012), seed-to-voxel correlation maps were calculated as a measure of connectivity to the six seeds and networks shown in Figure 1. The coordinates and sizes of five of these seeds are outlined in Table 1, while the sixth seed is defined by its anatomical parcellation. Of these, seeds four to six were chosen in regions deemed to be affected most by susceptibility artifacts, as determined from poor SNR and visible distortions in raw GE-EPI. Then, considering only those voxels with statistically significant correlations (p ≤ 0.05), the sensitivity, specificity, and intersubject reproducibility of each correlation map to a network associated with a given seed (Table 1 and Fig. 1) were calculated. Both sensitivity and specificity are calculated using the Yeo atlas as reference:
FIG. 1.
Seed/network pairs used to assess sensitivity/specificity of GE- and SE-EPI for resting-state functional connectivity. Seed regions are shown in white, while the resulting network regions (averaged across all subjects) are shown in red. The networks are obtained from the Yeo atlas (detailed in Table 1). DACC, dorsal anterior cingulate cortex; PCC, posterior cingulate cortex; DMN, default-mode network; ITL, inferior temporal network.
Table 1.
Network Definitions and Seed Locations for Seed-Based fcMRI Analysis
| Seed/network number | Seed structure | Seed locations | Radius (mm) | Network |
|---|---|---|---|---|
| 1 | DACC | — | — | Salience |
| 2 | Somatometer | (0, −18, 60) | 7 | Somatometer (Yeo17-3) |
| 3 | Dorsal Attention (from Yeo et al., 2011) | (−49, 3, 34); (49, 3, 34) | 7 | Frontoparietal (Yeo17-12) |
| 4 | PCC | (0, −56, 28) | 10 | DMN (Yeo7-7) |
| 5 | Limbic | (−40 4, −38); (40, 4, −38) | 9 | ITL (Yeo17-10) |
| 6 | Frontal | (0, 46, −20) | 7 | Frontal (Yeo17-10) |
Seed locations are indicated in MNI coordinates. Networks located in high-susceptibility regions are shaded. While networks 5 and 6 are situated within high-susceptibility regions, network 4 is partially affected by susceptibility. Correspondence to networks in the 1000-brain
“Yeo atlas” is indicated by the numbers. For instance, “Yeo17-12” indicates network 12 in the 17-network Yeo atlas, while “Yeo7-7” corresponds to network 7 in the 7-network Yeo atlas, and so on. The DACC seed is defined as the entire DACC anatomical parcellation.
DACC, dorsal anterior cingulate cortex; PCC, posterior cingulate cortex; DMN, default-mode network; ITL, inferior temporal network.
Sensitivity of each acquisition method for a given network is calculated as the number of voxels exhibiting significant positive correlations that overlap with Yeo-atlas network definition, divided by the total number of voxels in the Yeo-atlas network template.
Specificity is calculated as the number of voxels that overlap with Yeo-atlas network definition divided by the total number of voxels exhibiting significant positive correlations in our data sets.
Intersubject reproducibility is calculated as the Dice Coefficient, defined as the number of overlapping voxels between connectivity maps of two subjects divided by the sum of numbers of voxels from each subject’s connectivity map. The Dice Coefficient is computed for each network separately.
Seed/network pairs 1 to 4 were chosen to consist of networks commonly found in GE-EPI resting-state fcMRI studies, while seed/network pairs 5 and 6 were chosen to consist of networks most severely affected by signal dropout in GE-EPI acquisitions, with seed locations chosen based on the centroids of the 17-network Yeo atlas definitions.
It has been documented that the computed functional connectivity strength varies with BOLD acquisition length (Birn et al., 2013). Alternatively, SE-EPI is known to be less sensitive to the overall BOLD effect at 3 T, affecting the strength and reproducibility of associated connectivity measurements. Thus, we set out to also test the effect of reduced signal power by creating a truncated version of the GE-EPI data. The rationale is that reduced acquisition duration, like reduced BOLD sensitivity, can both lead to reduced BOLD connectivity reliability. By extension, if a truncated GE-EPI data set produced results equivalent to a standard SE-EPI data set, then it is likely that by increasing the SE-EPI acquisition duration, the sensitivity and reproducibility can be improved.
Calculations of physiological effects
We computed heart rate variability (CRV) using pulse recordings as described by Chang and colleagues (2009), except using an averaging period of 6 sec and a sliding window of 60 sec. We assessed the effects of two cardiac variability regressors, namely, CRV and CRV convolved with the cardiac response function (hitherto referred as “CRV-CRF”) (Chang et al., 2009). However, since the canonical CRV was estimated from GE-EPI data and may not be suitable for SE-EPI, we also assessed the directly associations between BOLD and the unconvolved CRV. We used both regular TR and short TR BOLD data to assess the cardiac correlations; the former is more representative of typically fcMRI methods, while the latter would allow us to minimize the effect of time-locked cardiac pulsation and hence to focus on the low-frequency CRV effects.
Likewise, two different respiration-related regressors were assessed, namely RVT and the convolution of RVT with the respiratory response function (RRF) (Birn et al., 2008) (hitherto referred to as “RVT-RRF”). We calculated respiratory volume time courses based on the respiratory bellows measurements. The use of the unconvolved RVT was motivated by the fact that the canonical RRF, like the CRF, was also estimated from GE-EPI data.
Subsequently, we assessed the influence of both on both GE- and SE-EPI data through cross-correlations between functional data and on all respiratory and cardiac regressors. We examined time lags ranging from −20 sec to +30 sec in increments of 1 sec, with positive lags indicating the BOLD signal being more latent. The resulting spatial correlation maps were transformed into MNI305 space and averaged across all subjects. We do not assess the effect of time locked respiration, as it is commonly removed using standard functional connectivity preprocessing strategies.
Furthermore, we estimated the voxelwise RVT-HRF and CRV-HRF based on previously proposed methods (Chang et al., 2009), to assess any differences between HRF shapes for GE and SE. Specifically, we constructed a multiregression model to simultaneously deconvolve the two HRFs from the BOLD time series, through which each response was modeled as a Gaussian process. The response functions were computed for each voxel of gray matter in each participant.
Finally, based on our estimated HRFs, we removed the effects of RVT and CRV individually to assess the impact of physiological correction on fcMRI measurement accuracy, in terms of both sensitivity and specificity, as described previously.
Results
Image signal-to-noise ratio across the brain
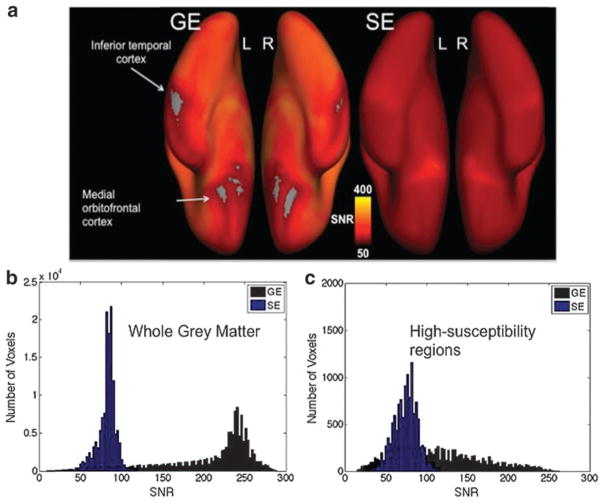
In Figure 2, we show maps of GE and SE fMRI SNR mapped onto the left and right cortices. While GE-EPI is associated with higher SNR than SE-EPI in the majority of areas, the SNR distribution is evidently nonuniform across the cortex. Specifically, it is evident that while SE-EPI results in a consistent SNR level across the entire cortex, the SNR found in GE-EPI drops off significantly in those areas most affected by signal dropout due to susceptibility effects, namely the medial orbital frontal cortex and the inferior temporal lobe just above the ear canals. These observations will guide our later investigations of functional connectivity comparisons.
FIG. 2.
SNR properties of GE and SE fMRI. (a) Group-averaged SNR maps for GE-and SE-EPI fMRI, mapped onto the ventral view of the inflated cortex. SNR is thresholded at 50 for both GE- and SE-EPI scans. Note drop out in GE images in regions typically affected by susceptibility issues (medial orbital frontal cortex, inferior temporal lobe). This spatial differentiation is detailed in the group-mean SNR histogram for whole gray matter (b) and for high-susceptibility regions (c), involving the frontal, temporal, and limbic regions.
Functional connectivity mapping in all brain regions
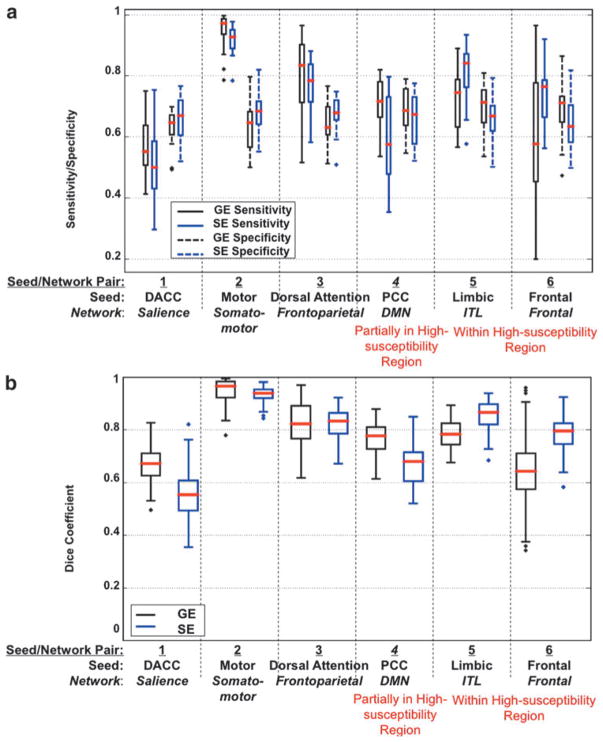
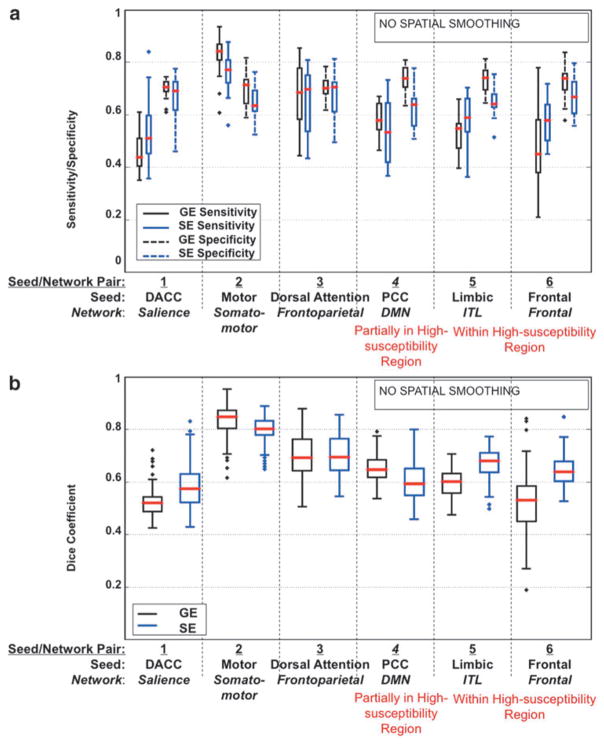
The sensitivity and specificity values of both GE- and SE-EPI runs in detecting resting-state networks through seed-based analysis are presented in Figure 4a. As mentioned, the first 4 seed/network pairs were chosen to compare the ability of GE- versus SE-EPI to detect networks that are among the most commonly studied using rs-fMRI. With the exception of seed/network 4, namely the posterior-cingulate (PCC) seed to default-mode network (DMN), SE-EPI provided a slightly lower sensitivity but higher specificity in all cases, although the trend did not reach statistical significance. In the case of network 4 (DMN), both sensitivity and specificity were slightly lower with SE-EPI, although again, not statistically significantly. In terms of intersubject reproducibility of functional networks, GE outperformed SE in nonsusceptibility regions, (Fig. 4b) in the presence of spatial smoothing, although the Dice Coefficients reflect only moderate intersubject reproducibility for GE-fcMRI. Interestingly, SE performed similarly to GE when spatial smoothing was removed (Fig. 5b).
FIG. 4.
Sensitivity, specificity, and reliability of smoothed GE- and SE-EPI to seed-based functional connectivity in various networks. (a) Sensitivity and specificity plots and (b) Dice Coefficient plots representing spatial reliability between subjects. Results include only voxels with a statistically significant correlation, p ≤ 0.05, to the seed. The plots are based on data for all subjects. Networks located in high-susceptibility regions are indicated in red.
FIG. 5.
Sensitivity, specificity, and reliability of un-smoothed GE- and SE-EPI to seed-based functional connectivity in various networks. (a) Sensitivity and specificity plots and (b) Dice Coefficient plots representing spatial reliability between subjects. Results include only voxels with a statistically significant correlation, p ≤ 0.05, to the seed. The plots are based on data for all subjects. Networks located in high-susceptibility regions are indicated in red.
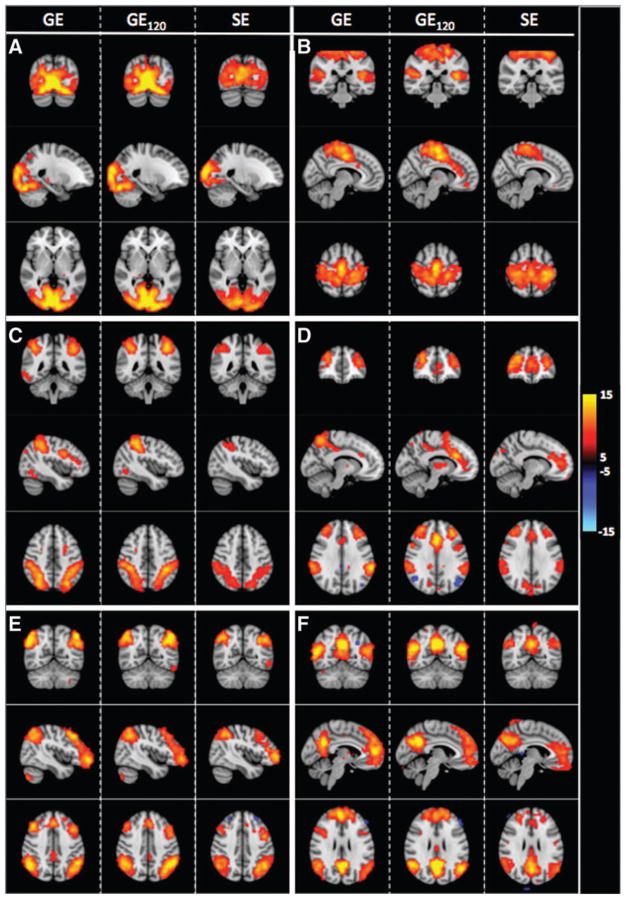
In Figure 6, we display resting-state networks outlined in the 7-network rs-fMRI functional network atlas described by Yeo and colleagues (2011). We show ICA-based functional networks obtained from GE- and SE-EPI data, including the truncated GE data (GE120); all presented networks were robustly revealed by all three GE and SE data sets.
FIG. 6.
Coronal, sagittal, and axial slices of common ICA estimated resting-state components found in GE and SE data that correspond to the following networks: (A) visual (Yeo7-1) (Damoiseaux A/E) (BA 17, 18, 19), (B) somatomotor (Yeo7-2) (Damoiseaux F) (BA 1, 2, 3, 4), (C) dorsal attention (Yeo7-3) (Damoiseaux H) (BA 2,5,7), (D) ventral attention (Yeo7-4), (E) fronto-parietal (Yeo7-6) (Damoiseaux C/D) (BA 6, 7, 9, 10, 40), (F) default mode (Yeo7-7) (Damoiseaux B). Black to yellow (or blue) represent alternative hypothesis test values (p < 0.05) ranging from 5 to 15 (−5 to −15). Bright colors represent stronger connectivity. We also assessed the effect of using 120 frames of GE-EPI (GE120: half of the length of the full GE acquisition) to extrapolate on whether SE-fcMRI performance could potentially be improved with longer acquisition time. Left hemisphere is on the right side of the image.
Functional connectivity mapping in high-susceptibility regions
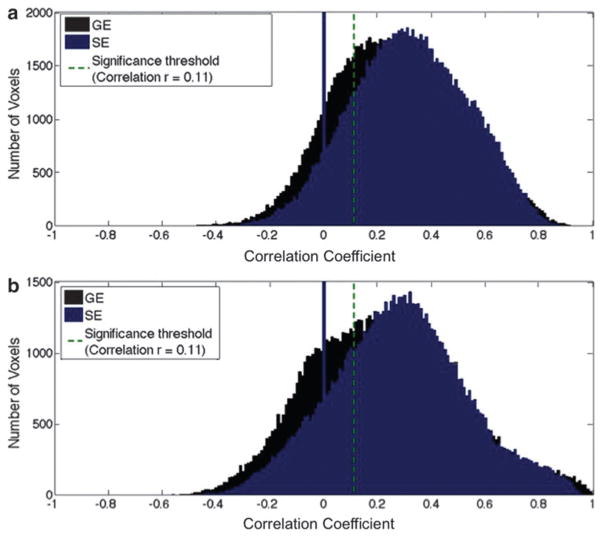
The last two seed/network pairs presented in Figures 3 and 5 were chosen to probe the effect of susceptibility-related signal dropout in GE-EPI acquisitions (inferior temporal lobe and frontal lobe). SE-EPI data resulted in higher connectivity values in these regions, as shown in Figure 3. Also, unlike in the cases of the first 4 networks, sensitivity to networks 5 and 6 was higher when using SE-EPI (Fig. 4a). This was particularly significant in the inferior-temporal cortex (p < 0.05). The sensitivity of GE-fcMRI in the frontal region (Network 6) was highly variable across the group, as shown in the box plot in Figure 4, potentially resulting in a lack of significant difference between GE and SE-fcMRI sensitivity. Also, the lower specificity of SE-fcMRI suggests that SE-EPI reveals larger areas of functional connectivity in these high-susceptibility regions than were in the Yeo atlas (which was itself based on GE-EPI). Overall, we noted from Figure 4 that the gain in sensitivity achieved using SE-EPI in high-susceptibility regions is more substantial than the advantage of GE-EPI over SE-EPI in the remaining parts of the brain. In terms of intersubject reproducibility, SE-EPI performed substantially better than GE-EPI in networks 5 and 6. These findings were consistent irrespective of the level of spatial smoothing, as fcMRI maps obtained with no spatial smoothing demonstrated similar trends (Fig. 5).
FIG. 3.
Histogram of correlation coefficients (functional connectivity) based on GE and SE in high-susceptibility brain regions. (a) Limbic (ITL) network and (b) frontal network. Both positive and negative correlations to the seed are observed with both GE and SE data. However, SE-based connectivity values are higher than GE-based ones in these regions. Results are based on data from all subjects, without physiological (RVT and CRV) correction.
Sensitivity to physiological noise
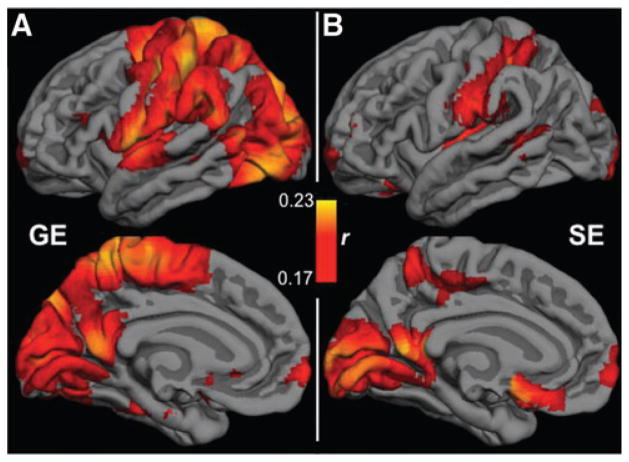
The effects of RVT-RRF were substantially stronger than those of RVT alone, but GE-EPI was also more strongly associated with RVT than SE-EPI. We summarize in Figure 7 the group-average max correlations between the RRF-RVT and the BOLD scans, which are markedly less strong and less widespread in SE-EPI than in GE-EPI. However, these effects are highly spatially dependent. In particular, certain regions (pre- and postcentral cortices, supramarginal gyrus, lateral occipital sulcus, superior parietal lobule, precuneus, and posterior cingulate) in the GE-EPI data showed stronger and more widespread correlations to the RRF-RVT than SE-EPI. Similar effects (but opposite polarity) were found in the correlations with RVT alone (data not shown).
FIG. 7.
The effect of respiratory volume variability (RVT). Group-mean maps of correlation between the BOLD signal and the convolved RVT (RVT-RRF) are overlaid on the Free-Surfer cortical model, averaged across all nine subjects. SE-EPI exhibited markedly lower sensitivity to RVT, particularly in the default-mode network and paracentral regions. BOLD, blood-oxygenation level dependent.
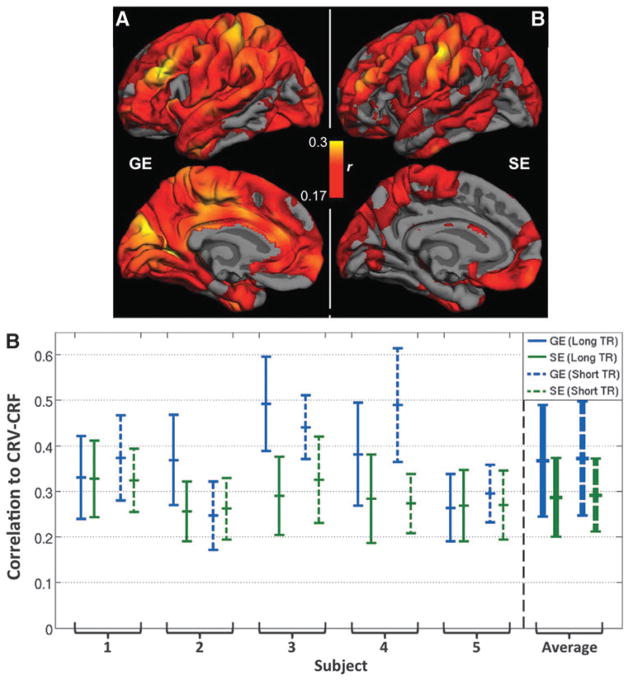
Likewise, for both regular TR and short TR data sets, CRV-CRF was associated with stronger BOLD correlations than CRV alone, but GE-EPI remains more strongly correlated with CRV than SE-EPI. As shown in Figure 8A, while SE-EPI and GE-EPI showed similar spatial distributions of CRV sensitivity, SE-EPI also exhibited lower sensitivity to heart rate effects. Global correlations are substantially lower for SE than for GE data (Fig. 8A), particularly in the medial and occipital brain regions. Furthermore, as mentioned previously, we included short-TR GE- and SE-EPI acquisitions in this study, as short TR allows for more effective removal of time-locked high-frequency cardiac effects, hence allowing us to better isolate the effect of CRV. While the use of short TR did not reduce the BOLD correlation to CRV compared with using the regular TR, both types of acquisitions revealed significantly lower sensitivity to CRV-CRF than their GE-EPI counterparts (Fig. 8B).
FIG. 8.
The effect of heart rate variability (CRV). (A) Maps of correlations between the regular TR BOLD signals and the convolved CRV (CRV-CRF) are overlaid on the FreeSurfer cortical model, averaged across nine subjects. SE-EPI exhibited lower CRV sensitivity than GE-EPI. (B) Gray matter averaged correlations between CRF-CRF and the BOLD signal for both regular (long) TR and short TR data. The group-level differences were statistically significant for both TRs.
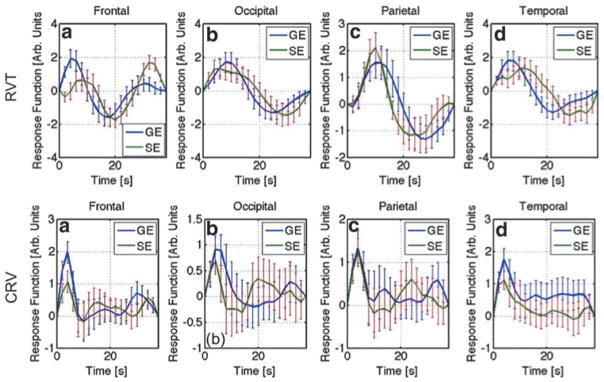
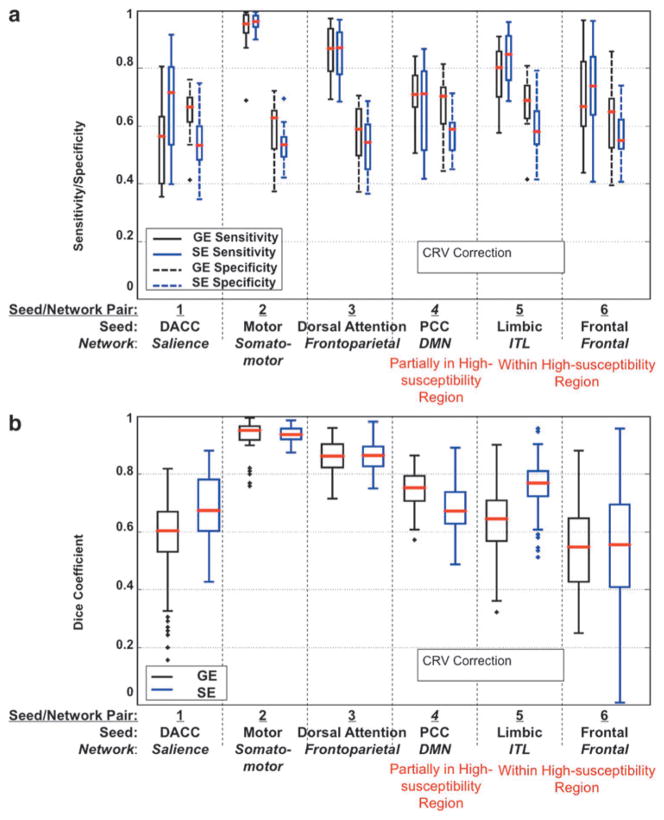
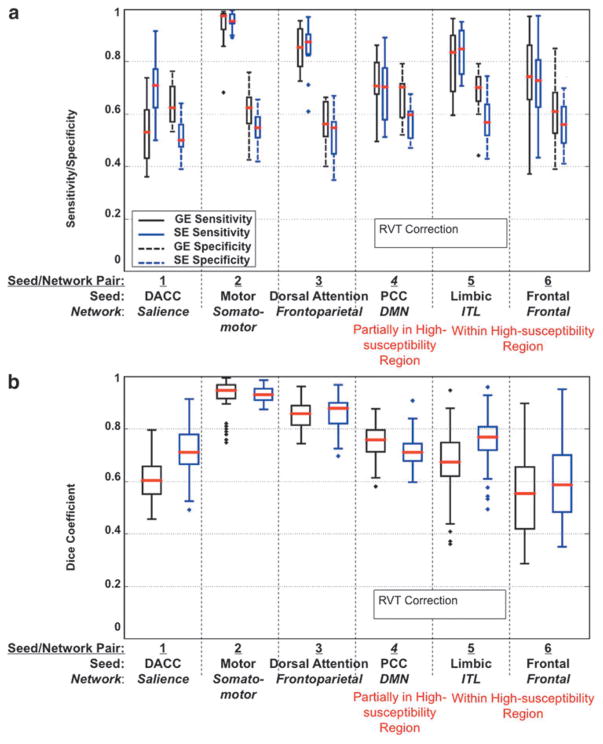
As shown in Figure 9, for the most part, SE- and GE-EPI response functions were estimated with similar levels of variability (as represented by the error bars), but interestingly, the temporal features of the two sets of HRFs are different in most regions. For instance, the RVT-HRF for SE data is delayed compared with that of GE in the temporal and frontal regions, but the opposite is true for the parietal and occipital regions. In contrast, the CRV-HRF for SE is faster than that of GE in all brain regions considered. Furthermore, as shown in Figures 10 and 11, the application of RVT correction did not alter the conclusion regarding the higher performance of SE-EPI in susceptibility-affected regions and generally improved SE-EPI performance in other brain regions, in terms of sensitivity, specificity, and intersubject reproducibility. Conversely, CRV correction rather boosted GE-EPI performance relative to SE-EPI in nonsusceptibility regions, with the exception of the salience network.
FIG. 9.
RVT and CRV response functions derived from GE and SE data. The displayed HRFs are the intersubject averages, and the error bars represent standard error.
FIG. 10.
The effect of RVT correction on GE and SE functional connectivity measures. (a) Sensitivity and specificity plots; (b) Dice Coefficient plots representing spatial reliability between subjects. Results include only voxels with a statistically significant correlation, p ≤ 0.05, to the seed. The plots are based on data for all subjects. Networks located in high-susceptibility regions are indicated in red.
FIG. 11.
The effect of CRV correction on GE and SE functional connectivity measures. (a) Sensitivity and specificity plots; (b) Dice Coefficient plots representing spatial reliability between subjects. Results include only voxels with a statistically significant correlation, p ≤ 0.05, to the seed. The plots are based on data for all subjects. Networks located in high-susceptibility regions are indicated in red.
Discussion
Overview: spin-echo EPI versus gradient-echo EPI
As briefly mentioned earlier, SE-EPI and GE-EPI have been compared in a number of task-related fMRI scenarios. While GE-EPI has consistently been found more sensitive in whole-brain studies (Norris, 2012; Thompson et al., 2011), the superior sensitivity of SE-EPI susceptibility-affected regions has been well documented in this context (Bandettini et al., 1994; Boyacioğlu et al., 2014; Norris et al., 2002). At 3 T, novel techniques such as dual-echo GE-EPI (Halai et al., 2014) and distortion-corrected GE-EPI (Visser et al., 2010) have demonstrated superior sensitivity than simple SE-EPI in high-susceptibility regions. However, many 3 T sites do not have access to custom sequences, and hence, it is valuable to quantify the performance of a commercially available SE-EPI sequence.
While the superior microvascular sensitivity of SE-EPI is not the primary motivation behind this work, we argue that SE-EPI can potentially provide more accurate representations of functional connections, as the SE-EPI signal is more determined by neuronally specific BOLD signal fluctuations. At 3 T, GE-EPI is primarily sensitive to extravascular effects, whereas SE-EPI is sensitive to both intra- and extra-vascular effects (Lu and van Zijl, 2005). The intravascular BOLD contribution from large veins decreases with increasing field strength, due to deoxyhemoglobin-related T2 reductions. However, at 3 T, the intravascular effect remains substantial. Although our main motivation is to regain signal integrity in regions typically affected by signal dropouts and pileups, we do note that SE-EPI is shown to be more specific globally to microvascular signals (Hulvershorn et al., 2005; Parkes et al., 2005) at 3 T In fact, our work also demonstrates that SE-EPI is much less sensitive than GE-EPI to susceptibility-induced respiratory artifacts.
Our custom TE optimization was not based on resting-state contrast, but on task-related BOLD response. The optimal TE identified in our experiments is much shorter than the theoretically optimal TE (between 70 and 80 msec at 3 T). We attribute this finding to the following: (1) as mentioned earlier, previous experiments (Liu et al., 2006) found the growing influence of physiological noise to become curtailed at a TE of 50 msec (close to our TE), thus potentially boosting our observed contrast-to-noise ratio; (2) in determining the optimal TE, we sought to maximize CNR in gray matter, while minimizing CNR of large vein voxels, which yielded a TE that is rather shorter than expected. While it is encouraging that we obtained robust fcMRI maps using this TE, we do not include a more detailed characterization of tissue vs. macrovascular weighting of the BOLD contrast, as it is to be reported in our follow-up work.
Spin-echo fcMRI in high-susceptibility regions
Despite the wide application of rs-fMRI for functional connectivity mapping, the dominant use of GE-EPI BOLD likely impedes the study of the inferior and medial temporal lobes, the orbitofrontal cortex, and the amygdala, involved in networks related to memory (Halai et al., 2014; Visser et al., 2010), emotion (Merboldt et al., 2001), and language (Devlin et al., 2000; Pobric et al., 2007).
The medial temporal memory network (Libby et al., 2012; Poppenk and Moscovitch, 2011) involves connections between the entorhinal, perirhinal, and parahippocampal regions, as shown by high-resolution fMRI, and targeted by our network 5. These anterior inferior temporal connections have not been consistently observed in our per-subject GE-EPI data sets, as reflected by the comparison in Figures 4 and 5. In addition, connections between the ventral medial orbitofrontal cortex and the hippocampus (de Souza Silva et al., 2015), probed through our network 6 (frontal network), were also not robust in our GE-EPI data. In this respect, SE-EPI demonstrated a significantly higher sensitivity and substantially higher specificity in this area, culminating in reduced intersubject variability (Fig. 4). This was the case irrespective of spatial smoothing (Fig. 5) and physiological corrections (Figs. 10 and 11). In this work, we did not explicitly investigate connectivity of the amygdala, specifically medial and ventral amygdala (Johnstone et al., 2005). However, we note that T2* effects in the vicinity have recently been demonstrated to compromise the ability to detect the neuronally relevant amygdala BOLD signal (Boubela et al., 2015). While SE-EPI is also sensitive to intravascular venous effects, overall draining vein effects are expected to be much lower than that in GE-EPI at 3 T (Uludag et al., 2009), making SE-EPI a potentially more appropriate tool for imaging networks located close to large veins.
Spin-echo fcMRI in the rest of the brain
In general, functional connectivity does not simply depend on BOLD fMRI contrast-to-noise, but also on the degree of similarity between two BOLD time series. In a seed-based approach, the similarity is measured primarily by temporal synchrony, while in a temporal spatial ICA-based approach, networks are also separated based on the degree of their statistical independence. In this work, we build upon previous work defining the BOLD CNR of SE-EPI, and in turn assess how this translates into fcMRI measurements. Our findings constitute the first independent confirmation of the seed-based findings by Chiacciaretta and Ferretti (Chiacchiaretta and Ferretti, 2015); although a much longer TE was used in this latter work, the similarity of results with our own consolidates the feasibility of SE-EPI in rs-fMRI connectivity mapping.
We also found that, from the ICA results in nonsusceptibility affected networks, the fcMRI measurements from the truncated GE-EPI data set (GE120) exhibited sensitivity more akin to that of SE-EPI. This finding suggests that data acquisition length plays a role in modulating fcMRI sensitivity and robustness. That is, if we were to extend our SE-EPI acquisition beyond 8 min, we can expect to see a corresponding increase in fcMRI sensitivity, particularly in non-susceptibility affected regions. Furthermore, with the introduction of multiband SE-EPI (Auerbach et al., 2013; Boyacioğlu et al., 2014), we expect a substantial boost to the sensitivity of SE-EPI for fcMRI mapping.
Finally, we showed that GE-fcMRI only slightly outperforms SE-fcMRI in nonsusceptibility regions, echoing recent findings by Chiacchiaretta and Ferretti (2015). While this is clearly attributable to the greater BOLD sensitivity of GE-EPI at 3 T, we also raise the possibility that the lack of sensitivity seen in some earlier SE-EPI studies (Thompson et al., 2011) may, in part, be due to the use of suboptimal TE. Although theory predicts that the optimal TE is close to tissue T2, our own optimization demonstrated that a shorter TE might be more advantageous, potentially due to the increasing dominance of physiological noise at longer TEs. While our optimization was based on sensitivity to an auditory–visual stimulus, the BOLD vascular response to a respiratory stimulus (Triantafyllou et al., 2011) is potentially more robust and will be used in our further TE refinement for SE-EPI.
Effect of spatial smoothing
Our results (Figs. 4 and 5) show that the sensitivity and specificity advantages of SE-EPI for fcMRI measurement remain unchanged in the high-susceptibility regions, while SE-and GE-based fcMRI remains comparable in most of the other brain networks investigated. The removal of spatial smoothing seems to reduce the advantage of GE in intersubject reproducibility, such that SE and GE perform at a similar level across all networks. Spatial smoothing has been shown to increase BOLD temporal SNR as well as the amplitude of correlated physiological noise (Triantafyllou et al., 2005). While Molloy and colleagues (2014) demonstrated that spatial smoothing did not significantly impact GE-EPI-based connectivity measurements, the SNR of SE-EPI is significantly lower than GE-EPI in general, and hence, the effect of spatial smoothing on SE may differ.
Sensitivity to physiological noise
A key message in this respect is that physiological correction seems to allow SE to perform better than GE in terms of sensitivity, specificity, and intersubject reproducibility. This was the case in over half of the six networks considered in our seed-based analysis. In our study, RVT-RRF showed tremendously stronger correlations to GE-EPI than SE-EPI in gray matter. While a potential concern in this finding is that the canonical RRF was derived from GE-EPI data, we note that similar results were found for correlations with RVT, suggesting that RRF-related biases do not dominate the observed respiratory sensitivity differences between GE- and SE-EPI. A similar argument can be made for CRV, in that GE-EPI was more strongly associated with CRV than SE-EPI.
Based on prior work by Triantafyllou and colleagues (2005), we conclude that our GE-EPI acquisition parameters place us in the physiological noise-dominated rather than thermal noise-dominated regime. While these regimes are less well defined for SE-EPI, we understand that correlated physiological noise increases with localized spatial smoothing (Triantafyllou et al., 2005). Previous work by Liu et al. (2006) at 3 T has found that that while spatial averaging increased noise amplitude in both SE-EPI and GE-EPI, the increase for SE-EPI began to slow down at a TE of 50 msec. As we took our SE-EPI measurements at approximately the same TE, the prior work suggests that noncorrelated (including thermal) noise begins to overtake physiological noise at TE = 50 msec.
Respiration in vivo is associated with blood flow and oxygenation fluctuations, but there is also the factor of chest motion-induced dynamic susceptibility effects (Pfeuffer et al., 2002), which has been shown to induce BOLD signal changes in the brain. Our recent work in a phantom clearly illustrates that RVT leads to a dynamic low-frequency susceptibility effect in the BOLD signal that is beyond the reach of conventional denoising methods such as RETROI-COR (Khatamian et al., 2015). This finding is consistent with our current finding that SE-EPI is less sensitive to RVT-related physiological signals. However, intrinsically, SE-EPI is overall less sensitive to the BOLD effect than GE-EPI at 3 T, as SE-based techniques are insensitive to the extravascular static dephasing effect. This could be at the center of the reduced SE sensitivity to CRV (and to a lesser degree, to RVT), as CRV is not known to be associated with susceptibility changes.
Judging by the group-mean HRFs shown in Figure 9, there is no fundamental difference between the shapes of the HRF estimated from SE and GE data, for either RVT or CRV. However, shape differences do exist. The faster SE CVR-HRF compared with GE is consistent with the faster neuronal BOLD response observed using SE than using GE by Hulvershorn and colleagues (2005). In contrast, the delayed SE RVT-HRF compared with GE may be attributed to the fact that respiration acts on the BOLD signal in more than one way: (1) the dynamic susceptibility changes are induced by chest expansions and act more noticeably on the GE-EPI signal, with immediate effect; (i) the blood-oxygenation fluctuations act on both the SE- and GE-EPI signals, and is expected to be delayed due to the need for alveolar gas exchange. In other words, we argue that the slower SE-EPI response to RVT might reflect the latter mechanism.
Caveats
It is important to note that in rs-fMRI, the assessment of fcMRI measurement accuracy is made difficult by a lack of ground truth. Currently, all large-data fcMRI studies are conducted using GE-EPI. Based on these data, several methods for resting-state functional parcellations have been proposed recently (Phlypo et al., 2014; Shen et al., 2013). As mentioned earlier, our choice of the Yeo atlas as pseudoground truth was motivated by its inclusion of a large number of data sets (N = 1000). As the atlas demonstrates most robust networks across this large sample of subjects, it is expected to be less affected by interindividual differences in susceptibility-related signal loss. Nonetheless, we recognize that the Yeo atlas is itself based on GE-EPI and, thus, will contain biases directly related to the artifacts mentioned in this article. In addition, we argue that the fact that SE-EPI was able to produce fcMRI maps that extended outside the Yeo-atlas-defined networks in high-susceptibility regions attests to the advantage of SE-EPI at re-establishing fcMRI sensitivity in these regions. To consolidate this conclusion, we hope to further assess SE-based fcMRI in scenarios involving the association between fcMRI measures and cognitive measures relevant to the frontal or temporal regions.
Second, we attempted to maximize the neuronal sensitivity of our SE-EPI protocol based on sensitivity to a visual motor stimulus. While this optimization has never been performed in existing SE-EPI-based work, repeated administration of a task may induce acclimatization effects. In that regard, the BOLD vascular response to a respiratory stimulus (Triantafyllou et al., 2011) is potentially more robust. Furthermore, we have yet to assess the optimal TE in view of the trade-off between BOLD sensitivity and microvascular specificity. These will be targets of our future work.
Inflow effects were not explicitly addressed in this work. However, we only examined the short TR data in the context of cardiac noise, which should be a primary driver of potential inflow effects. In that context, compared with regular TR data, we found that short TR data are generally more strongly associated with cardiac variability in the GE-EPI case, but not for SE-EPI. This may be, in part, explained by differential inflow effects associated with the refocusing pulse. As we did not use short TR data to assess functional connectivity, inflow effects minimally affect the conclusions regarding the connectivity sensitivity and specificity.
Conclusion
In this work, we quantify, for the first time, the sensitivity and specificity of spin-echo (SE) and gradient-echo (GE) EPI for resting-state fMRI functional connectivity (fcMRI) mapping. While SE-EPI has long been viewed as insufficiently sensitive at 3 T for task-related studies, it has demonstrated similar sensitivity and specificity as GE-EPI in fcMRI mapping. More importantly, SE-based fcMRI demonstrated significantly higher sensitivity and specificity in high-susceptibility regions, as well as lower sensitivity to physiological noise. Our work suggests that SE-EPI should be increasingly adopted for the study of networks related to memory, language, and emotions.
Acknowledgments
This research was supported by grant funding from the Natural Sciences and Engineering Council of Canada (NSERC App. 418443, JJC) and the Canadian Institutes of Health Research (CIHR: App. 286286, JJC). We also thank Mr. Powell Chu for assistance in the article preparation.
Footnotes
Author Disclosure Statement
No competing financial interests exist.
References
- Auerbach EJ, Xu J, Yacoub E, Moeller S, Uğurbil K. Multiband accelerated spin-echo echo planar imaging with reduced peak RF power using time-shifted RF pulses. Magn Reson Med. 2013;69:1261–1267. doi: 10.1002/mrm.24719. [DOI] [PMC free article] [PubMed] [Google Scholar]
- Bandettini PA, Wong EC, Jesmanowicz A, Hinks RS, Hyde JS. Spin-echo and gradient-echo EPI of human brain activation using BOLD contrast: a comparative study at 1.5 T. NMR Biomed. 1994;7:12–20. doi: 10.1002/nbm.1940070104. [DOI] [PubMed] [Google Scholar]
- Beckmann CF, Smith SM. Probabilistic independent component analysis for functional magnetic resonance imaging. IEEE Trans Med Imaging. 2004;23:137–152. doi: 10.1109/TMI.2003.822821. [DOI] [PubMed] [Google Scholar]
- Bellgowan PSF, Bandettini PA, van Gelderen P, Martin A, Bodurka J. Improved BOLD detection in the medial temporal region using parallel imaging and voxel volume reduction. NeuroImage. 2006;29:1244–1251. doi: 10.1016/j.neuroimage.2005.08.042. [DOI] [PubMed] [Google Scholar]
- Binney RJ, Embleton KV, Jefferies E, Parker GJM, Lambon-Ralph MA. The ventral and inferolateral aspects of the ante- rior temporal lobe are crucial in semantic memory: evidence from a novel direct comparison of distortion-corrected fMRI, rTMS, and semantic dementia. Cereb Cortexx. 2010;20:2728–2738. doi: 10.1093/cercor/bhq019. [DOI] [PubMed] [Google Scholar]
- Birn RM, Diamond JB, Smith MA, Bandettini PA. Separating respiratory-variation-related fluctuations from neuronal-activity-related fluctuations in fMRI. NeuroImage. 2006;31:1536–1548. doi: 10.1016/j.neuroimage.2006.02.048. [DOI] [PubMed] [Google Scholar]
- Birn RM, Molloy EK, Patriat R, Parker T, Meier TB, Kirk GR, Nair VA, Meyerand ME, Prabhakaran V. The effect of scan length on the reliability of resting-state fMRI connectivity estimates. NeuroImage. 2013;83:550–558. doi: 10.1016/j.neuroimage.2013.05.099. [DOI] [PMC free article] [PubMed] [Google Scholar]
- Birn RM, Smith MA, Jones TB, Bandettini PA. The respiration response function: the temporal dynamics of fMRI signal fluctuations related to changes in respiration. NeuroImage. 2008;40:644–654. doi: 10.1016/j.neuroimage.2007.11.059. [DOI] [PMC free article] [PubMed] [Google Scholar]
- Boubela RN, Kalcher K, Huf W, Seidel EM, Derntl B, Pezawas L, Nasel C, Moser E. fMRI measurements of amygdala activation are confounded by stimulus correlated signal fluctuation in nearby veins draining distant brain regions. Sci Rep. 2015;5:10499. doi: 10.1038/srep10499. [DOI] [PMC free article] [PubMed] [Google Scholar]
- Boxerman JL, Bandettinin PA, Kwong KK, Baker JR, Davis TL, Rosen BR, Weisskoff RM. The intravascular contribution to fMRI signal change: monte Carlo modeling and diffusion-weighted studies in vivo. Magn Reson Med. 1995;34:4–10. doi: 10.1002/mrm.1910340103. [DOI] [PubMed] [Google Scholar]
- Boyacioğlu R, Schulz J, Müller NCJ, Koopmans PJ, Barth M, Norris DG. Whole brain, high resolution multiband spin-echo EPI fMRI at 7T: a comparison with gradient-echo EPI using a color-word Stroop task. NeuroImage. 2014;97:142–150. doi: 10.1016/j.neuroimage.2014.04.011. [DOI] [PubMed] [Google Scholar]
- Chang C, Cunningham JP, Glover GH. Influence of heart rate on the BOLD signal: the cardiac response function. NeuroImage. 2009;44:857–869. doi: 10.1016/j.neuroimage.2008.09.029. [DOI] [PMC free article] [PubMed] [Google Scholar]
- Chang C, Glover GH. Effects of model-based physiological noise correction on default mode network anti-correlations and correlations. NeuroImage. 2009;47:1448–1459. doi: 10.1016/j.neuroimage.2009.05.012. [DOI] [PMC free article] [PubMed] [Google Scholar]
- Chiacchiaretta P, Ferretti A. Resting state BOLD functional connectivity at 3T: spin echo versus gradient echo EPI. PLoS ONE. 2015;10:e0120398. doi: 10.1371/journal.pone.0120398. [DOI] [PMC free article] [PubMed] [Google Scholar]
- Constable RT, Spencer DD. Composite image formation in z-shimmed functional MR imaging. Magn Reson Med. 1999;42:110–117. doi: 10.1002/(sici)1522-2594(199907)42:1<110::aid-mrm15>3.0.co;2-3. [DOI] [PubMed] [Google Scholar]
- Cordes D, Haughton VM, Arfanakis K, Carew JD, Turski PA, Moritz CH, Quigley MA. Frequencies contributing to functional connectivity in the cerebral cortex in “resting-state” data. AJNR Am J Neuroradiol. 2001;22:1326–1333. [PMC free article] [PubMed] [Google Scholar]
- Damoiseaux JS, Rombouts SARB, Barkhof F, Scheltens P, Stam CJ, Smith SM, Beckmann CF. Consistent resting-state networks across healthy subjects. PNAS Proc Natl Acad Sci USA. 2006;103:13848–13853. doi: 10.1073/pnas.0601417103. [DOI] [PMC free article] [PubMed] [Google Scholar]
- de Souza Silva MA, Huston JP, Wang AL, Petri D, Chao OY. Evidence for a Specific Integrative Mechanism for Episodic Memory Mediated by AMPA/kainate Receptors in a Circuit Involving Medial Prefrontal Cortex and Hippocampal CA3 Region. Cereb Cortex. 2015 doi: 10.1093/cer-cor/bhv1112. Epub ahead of print. [DOI] [PubMed] [Google Scholar]
- Deichmann R, Gottfried JA, Hutton C, Tuner R. Optimized EPI for fMRI studies of the orbitofrontal cortex. NeuroImage. 2003;19:430–441. doi: 10.1016/s1053-8119(03)00073-9. [DOI] [PubMed] [Google Scholar]
- Devlin JT, Russell RP, Davis MH, Price CJ, Wilson J, Moss HE, Matthews PM, Tyler LK. Susceptibility-induced loss of signal: comparing PET and fMRI on a semantic task. NeuroImage. 2000;11:589–600. doi: 10.1006/nimg.2000.0595. [DOI] [PubMed] [Google Scholar]
- Domsch S, Linke J, Heiler PM, Kroll A, Flor H, Wessa M, Schad LR. Increased BOLD sensitivity in the orbitofrontal cortex using slice-dependent echo times at 3 T. Magn Reson Imaging. 2013;31:201–211. doi: 10.1016/j.mri.2012.06.020. [DOI] [PubMed] [Google Scholar]
- Duong TQ, Yacoub E, Adriany G, Hu X, Ugurbil K, Kim SG. Microvascular BOLD contribution at 4 and 7 T in the human brain: gradient-echo and spin-echo fMRI with suppression of blood effects. Magn Reson Med. 2003;49:1019–1027. doi: 10.1002/mrm.10472. [DOI] [PubMed] [Google Scholar]
- Feinberg DA, Harel N, Ramanna S, Ugurbil K, Yacoub E. Sub-millimeter single-shot 3D GRASE with inner volume selection for T2 weighted fMRI applications at 7 Tesla. Int Soc Magn Reson Med. 2008:2373. [Google Scholar]
- Goerke U, Garwood M, Ugurbil K. Functional magnetic resonance imaging using RASER. NeuroImage. 2011;54:350–360. doi: 10.1016/j.neuroimage.2010.08.011. [DOI] [PMC free article] [PubMed] [Google Scholar]
- Halai AD, Welbourne SR, Embleton K, Parkes LM. A comparison of dual gradient-echo and spin-echo fMRI of the inferior temporal lobe. Hum Brain Mapp. 2014 doi: 10.1002/hbm.22463. Epub ahead of print. [DOI] [PMC free article] [PubMed] [Google Scholar]
- Hulvershorn J, Bloy L, Gualtieri EE, Leigh JS, Elliott MA. Spatial sensitivity and temporal response of spin echo and gradient echo bold contrast at 3 T using peak hemodynamic activation time. NeuroImage. 2005;24:216–223. doi: 10.1016/j.neuroimage.2004.09.033. [DOI] [PubMed] [Google Scholar]
- Jochimsen TH, Norris DG, Mildner T, Moller HE. Quantifying the intra- and extravascular contributions to spin-echo fMRI at 3 T. Magn Reson Med. 2004;52:724–732. doi: 10.1002/mrm.20221. [DOI] [PubMed] [Google Scholar]
- Johnstone T, Somerville LH, Alexander AL, Oakes TR, Davidson RJ, Kalin NH, Whalen PJ. Stability of amygdala BOLD response to fearful faces over multiple scan sessions. NeuroImage. 2005;25:1112–1123. doi: 10.1016/j.neuroimage.2004.12.016. [DOI] [PubMed] [Google Scholar]
- Khatamian Y, Chen JJ. Artifact associated with fat suppression in spin-echo EPI. Intl Soc Magn Reson Med. 2015:3775. [Google Scholar]
- Khatamian Y, Faraji-Dana Z, Chen JJ. Org Hum Brain Mapp. Honolulu: 2015. Signifiance and correction of respiratory off-resonance effects in fMRI - A phantom study; p. 1651. [Google Scholar]
- Khatamian YB, Chen JJ. Resting-state functional connectivity mapping in humans using spin-echo EPI BOLD. Intl Soc Magn Reson Med. 2013:2234. [Google Scholar]
- Libby LA, Ekstrom AD, Ragland JD, Ranganath C. Differential connectivity of perirhinal and parahippocampal cortices within human hippocampal subregions revealed by high-resolution functional imaging. J Neurosci. 2012;32:6550–6560. doi: 10.1523/JNEUROSCI.3711-11.2012. [DOI] [PMC free article] [PubMed] [Google Scholar]
- Liu C-SJ, Miki A, Hulvershorn J, Bloy L, Gualtieri EE, Liu GT. Spatial and temporal characteristics of physiological noise in fMRI at 3T. Acad Radiol. 2006;13:313–323. doi: 10.1016/j.acra.2005.10.018. [DOI] [PubMed] [Google Scholar]
- Lu H, van Zijl PCM. Experimental measurement of extra-vascular parenchymal BOLD effects and tissue oxygen extraction fractions using multi-echo VASO fMRI at 1.5 and 3.0 T. Magn Reson Med. 2005;53:808–816. doi: 10.1002/mrm.20379. [DOI] [PubMed] [Google Scholar]
- Merboldt KD, Fransson P, Bruhn H, Frahm J. Functional MRI of the human amygdala? NeuroImage. 2001;14:253–257. doi: 10.1006/nimg.2001.0802. [DOI] [PubMed] [Google Scholar]
- Molloy EK, Meyerand ME, Birn RM. The influence of spatial resolution and smoothing on the detectability of resting-state and task fMRI. NeuroImage. 2014;86:221–230. doi: 10.1016/j.neuroimage.2013.09.001. [DOI] [PMC free article] [PubMed] [Google Scholar]
- Norris DG. Spin-echo fMRI: the poor relation? Neuro-Image. 2012;62:1109–1115. doi: 10.1016/j.neuroimage.2012.01.003. [DOI] [PubMed] [Google Scholar]
- Norris DG, Zysset S, Mildner T, Wiggins CJ. An investigation of the value of spin-echo-based fMRI using a Stroop color-word matching task and EPI at 3 T. NeuroImage. 2002;15:719–726. doi: 10.1006/nimg.2001.1005. [DOI] [PubMed] [Google Scholar]
- Ojemann J, Akbudak E, Snyder AZ, McKinstry RC, Raichle ME, Conturo TE. Anatomic localization and quantitative analysis of gradient refocused echo-planar fMRI susceptibility artifacts. NeuroImage. 1997;6:156–167. doi: 10.1006/nimg.1997.0289. [DOI] [PubMed] [Google Scholar]
- Parkes LM, Schwarzbach JV, Bouts AA, Deckers RHR, Pullens P, Kerskens CM, Norris DG. Quantifying the spatial resolution of the gradient echo and spin echo BOLD response at 3 Tesla. Magn Reson Med. 2005;54:1465–1472. doi: 10.1002/mrm.20712. [DOI] [PubMed] [Google Scholar]
- Pfeuffer J, Van De Moortele P-F, Uğurbil K, Hu X, Glover GH. Correction of physiologically induced global off-resonance effects in dynamic echo-planar and spiral functional imaging. Magn Reson Med. 2002;47:344–353. doi: 10.1002/mrm.10065. [DOI] [PubMed] [Google Scholar]
- Phlypo R, Thirion B, Varoquaux G. Deriving a multi--subject functional-connectivity atlas to inform connectome estimation. Med Image Comput Comput Assist Interv. 2014;17:185–192. doi: 10.1007/978-3-319-10443-0_24. [DOI] [PubMed] [Google Scholar]
- Pobric G, Jefferies E, Lambon-Ralph MA. Anterior temporal lobes mediate semantic representation: mimicking semantic dementia by using rTMS in normal participants. Proc Natl Acad Sci U S A. 2007;104:20137–20141. doi: 10.1073/pnas.0707383104. [DOI] [PMC free article] [PubMed] [Google Scholar]
- Poppenk J, Moscovitch M. A hippocampal marker of recollection memory ability among healthy young adults: contributions of posterior and anterior segments. Neuron. 2011;72:931–937. doi: 10.1016/j.neuron.2011.10.014. [DOI] [PubMed] [Google Scholar]
- Poser BA, Norris DG. Fast spin echo sequences for BOLD functional MRI. MAGMA. 2007;20:11–17. doi: 10.1007/s10334-006-0063-x. [DOI] [PMC free article] [PubMed] [Google Scholar]
- Ragot DM, Mazerolle EL, Chen JJ. Investigating task-based activation and functional connectivity in the white matter using fMRI at 3 Tesla. Int Soc Magn Reson Med. 2015:1339. [Google Scholar]
- Schmidt CF, Boesiger P, Ishai A. Comparison of fMRI activation as measured with gradient- and spin-echo EPI during visual perception. NeuroImage. 2005;26:852–859. doi: 10.1016/j.neuroimage.2005.02.043. [DOI] [PubMed] [Google Scholar]
- Schwarzbauer C, Mildner T, Heinke W, Brett M, Deichmann R. Dual echo EPI—the method of choice for fMRI in the presence of magnetic field inhomogeneities? NeuroImage. 2010;49:316–326. doi: 10.1016/j.neuroimage.2009.08.032. [DOI] [PubMed] [Google Scholar]
- Shen X, Tokoglu F, Papademetris X, Constable RT. Group-wise whole-brain parcellation from resting-state fMRI data for network node identification. NeuroImage. 2013;82:403–415. doi: 10.1016/j.neuroimage.2013.05.081. [DOI] [PMC free article] [PubMed] [Google Scholar]
- Stables LA, Kennan RP, Gore JC. Asymmetric spin-echo imaging of magnetically inhomogeneous systems: theory, experiment, and numerical studies. Magn Reson Med. 1998;40:432–442. doi: 10.1002/mrm.1910400314. [DOI] [PubMed] [Google Scholar]
- Thompson R, Correia M, Cusack R. Vascular contributions to pattern analysis: comparing gradient and spin echo fMRI at 3T. NeuroImage. 2011;56:643–650. doi: 10.1016/j.neuroimage.2010.03.061. [DOI] [PMC free article] [PubMed] [Google Scholar]
- Thulborn KR, Chang SY, Shen GX, Voyvodic JT. High-resolution echo-planar fMRI of human visual cortex at 3.0 tesla. NMR Biomed. 1997;10:183–190. doi: 10.1002/(sici)1099-1492(199706/08)10:4/5<183::aid-nbm469>3.0.co;2-w. [DOI] [PubMed] [Google Scholar]
- Triantafyllou C, Hoge RD, Krueger, Wiggins CJ, Potthast A, Wiggins GC, Walda LL. Comparison of physiological noise at 1.5 T, 3 T and 7 T and optimization of fMRI acquisition parameters. NeuroImage. 2005;26:243–250. doi: 10.1016/j.neuroimage.2005.01.007. [DOI] [PubMed] [Google Scholar]
- Triantafyllou C, Wald LL, Hoge RD. Echo-time and field strength dependence of BOLD reactivity in veins and parenchyma using flow-normalized hypercapnic manipulation. PLoS ONE. 2011;6:e24519. doi: 10.1371/journal.pone.0024519. [DOI] [PMC free article] [PubMed] [Google Scholar]
- Uludag K, Muller-Bierl B, Ugurbil K. An integrative model for neuronal activity-induced signal changes for gradient and spin echo functional imaging. NeuroImage. 2009;48:150–165. doi: 10.1016/j.neuroimage.2009.05.051. [DOI] [PubMed] [Google Scholar]
- Van de Moortele PFO, Pfeuffer J, Glover GH, Uğurbil K, Hu X. Respiration-induced B0 fluctuations and their spatial distribution in the human brain at 7 Tesla. Magn Reson Med. 2002;47:888–895. doi: 10.1002/mrm.10145. [DOI] [PubMed] [Google Scholar]
- Visser M, Embleton KV, Jefferies E, Parker GJ, Ralph MAL. The inferior, anterior temporal lobes and semantic memory clarified: novel evidence from distortion-corrected fMRI. Neuropsychologia. 2010;48:1689–1696. doi: 10.1016/j.neuropsychologia.2010.02.016. [DOI] [PubMed] [Google Scholar]
- Weiskopf N, Hutton C, Josephs O, Deichmann R. Optimal EPI parameters for reduction of susceptibility-induced BOLD sensitivity losses: a whole-brain analysis at 3 T and 1.5 T. NeuroImage. 2006;33:493–504. doi: 10.1016/j.neuroimage.2006.07.029. [DOI] [PubMed] [Google Scholar]
- Whitfield-Gabrieli S, Nieto-Castanon A. Conn: a functional connectivity toolbox for correlated and anticorrelated brain networks. Brain Connect. 2012;2:125–141. doi: 10.1089/brain.2012.0073. [DOI] [PubMed] [Google Scholar]
- Witleson SF. The brain connection: the corpus callosum is larger in left-handers. Science. 1985;229:665–668. doi: 10.1126/science.4023705. [DOI] [PubMed] [Google Scholar]
- Yang Y, Gu H, Silbersweig DA, Stern E. Simultaneous perfusion and blood-oxygenation-level-dependent measurements using single-shot interleaved z-shim echo-planar imaging. Magn Reson Med. 2005;53:1207–1211. doi: 10.1002/mrm.20431. [DOI] [PubMed] [Google Scholar]
- Yeo BT, Krienen FM, Sepulcre J, Sabuncu MR, Lashkari D, Hollinshead M, Roffman JL, Smoller JW, Zollei L, Polimeni JR, Fischl B, Liu H, Buckner RL. The organization of the human cerebral cortex estimated by intrinsic functional connectivity. J Neurophysiol. 2011;106:1125–1165. doi: 10.1152/jn.00338.2011. [DOI] [PMC free article] [PubMed] [Google Scholar]


