Abstract
Purpose
To determine the reproducibility of a comprehensive single-session measurement of glutathione (GSH), γ-aminobutyric acid (GABA), glutamate, and other biochemicals implicated in the pathophysiology of multiple sclerosis (MS) in the human brain with 1H MR spectroscopy.
Materials and Methods
Five healthy subjects were studied twice in separate 1-hour sessions at 7 Tesla. One MS patient was also scanned once. GSH and GABA were measured with J-difference editing using a semi-localized by adiabatic selective refocusing sequence (semi-LASER, TE=72 ms). A stimulated echo acquisition mode sequence (STEAM, TE=10 ms) was used to detect glutamate along with the overall biochemical profile. Spectra were quantified with LCModel. Quantification accuracy was assessed through Cramer-Rao lower bounds (CRLB). Reproducibility of the metabolite quantification was tested using coefficients of variation (CoV).
Results
CRLB were ≤7% for GSH, GABA, and glutamate and average CoV of 7.8±3.2%, 9.5±7.0%, and 3.2±1.7% were achieved, respectively. The average test/re-test concentration differences at this measurement reproducibility and quantification accuracy were smaller for GABA and glutamate than inter-subject variations in metabolite content with CoV ratios of 0.6 and 0.8, respectively. As proof of principle, GSH, GABA, and glutamate were also detected in an MS patient.
Conclusion
GSH, GABA, glutamate, and other metabolites relevant in MS can be quantified at 7 Tesla with high accuracy and reproducibility in a single 1-hour session. This methodology might serve as a clinical research tool to investigate biochemical markers associated with MS.
Keywords: multiple sclerosis, human, brain, magnetic resonance spectroscopy, 7 Tesla, reproducibility
Introduction
Multiple sclerosis (MS) is a chronic disorder of the central nervous system that leads to demyelination and neurodegeneration. MS disease-modifying therapies can minimize the number of relapses and associated neurological deficits during the predominantly inflammation-mediated relapsing-remitting phase (RR-MS) (1). To date, however, only partially effective treatments have been developed to prevent progressive disability and functional decline observed throughout the disease course (1). Despite significant research progress, the cause of MS and the underlying neurobiological mechanisms leading to progressive impairment remain unclear.
Clinical symptoms may worsen despite stable magnetic resonance imaging (MRI) lesion burden, which suggests that processes other than acute inflammation and its immediate consequences must contribute to cell loss, brain atrophy and ongoing clinical decline (2). Magnetic resonance spectroscopy (MRS) enables the assessment of pathological changes and brain damage non-invasively from the earliest stage of the disease (3). Previous MRS studies largely focused on structural and cellular integrity and therefore mainly aimed to quantify N-acetylaspartate (NAA) (4), choline (5), and myo-inositol (6). Besides these established biomarkers, there is increasing evidence that glutathione (GSH) is involved in MS pathology. For example, reactive oxygen species (ROS) are generated by activated macrophages during inflammation and have been linked to damage of myelin, oligodendrocytes, and mitochondria (7). GSH is assumed to play a neuroprotective role through direct interaction with ROS or as part of enzymatic redox cycling by which ROS are rendered innocuous (8). Largely based on investigations in vitro and animal models, it has been hypothesized that dysfunction of GSH metabolism impairs the brain's auto-protection against oxidative stress, thereby promoting demyelination, neurotoxicity, and cell death (9-12) as a basis for functional decline in MS (13). However, to what extent the neurochemistry of GSH is deficient in MS remains unknown.
GSH is by no means independent from its biochemical environment. Rates of GSH synthesis depend on the extracellular glutamate concentrations (14). Glutamate is the major excitatory neurotransmitter in the brain, a precursor of γ-aminobutyric acid (GABA), and with cysteine and glycine one of the three amino acids comprising the GSH tripeptide. Glutamate is closely linked to glutamine by the glutamate-glutamine cycle (15), a process that depends on the neurotransmission rate (16). As such, the link between GSH and other metabolites is neither negligible nor is it purely chemical in nature, but is dynamically influenced by brain function and neurotransmitter homeostasis.
Several metabolites involved in GSH metabolism play a role in MS pathology themselves. Excess extracellular glutamate has been reported to cause calcium-mediated apoptosis in an in vitro model of MS and a lack of oligodendrocytic glutamate transporters has been speculated as a cause for excitotoxicity (17). Moreover, recent studies have strongly tied alterations in genes associated with glutamate metabolism to MS markers of injury (18). The immediate role of the inhibitory neurotransmitter GABA in MS is still unknown, but its anti-inflammatory potential has been suggested based on the concurrent observations of increased GABAergic activity and reduced inflammation in animals with experimental autoimmune encephalomyelitis (EAE), a murine model of brain inflammation (11,19).
Despite ongoing efforts (20,21), neither the link between GSH and related substances nor the relevance of these biochemicals themselves to MS pathophysiology has been fully explored, partly due to constraints to non-invasively measure GSH metabolism in the human brain in a limited time frame. Several important challenges need to be overcome to achieve reliable quantification of GSH and related metabolites by MRS. The relatively low in vivo concentrations of GSH and GABA (22), for instance, limit the detection sensitivity; moreover, their resonances are obscured by much stronger signals from creatine and macromolecules. Specialized MRS techniques like J-difference editing (JDE) must therefore be applied to isolate GSH and GABA (23). JDE is a subtraction technique that extracts the metabolite of interest from the rest of the spectrum by exploiting a selected intramolecular coupling. Another difficulty is the individual quantification of overlapping resonances from glutamate and glutamine. Increasing magnetic field strength improves the overall MRS detection sensitivity and enhances spectral dispersion, which allows the separation of glutamate and glutamine at 7 Tesla (24).
The aim of this study was to determine the accuracy and reproducibility of a comprehensive single-session measurement of GSH, GABA, glutamate, and other biochemicals implicated in the pathophysiology of MS in the human brain with MR spectroscopy to explore their potential as clinical research tool.
Materials and Methods
Five healthy subjects (3 males and 2 females, aged 24-40 years, mean age 32±8 years) were studied twice in different sessions to assess the measurement accuracy and reproducibility of the MRS methods. Test-retest sessions were between 1 hour and 1 month apart. As proof of principle, one RR-MS patient (female, 41 years old) was studied once. In addition, a sixth subject (female, 28 years old) was scanned twice in different sessions, but was on a medication known to impact GABA concentrations and therefore not included in the general analyses. The total session duration did not exceed 1 hour in any case. All participants provided written informed consent, and the measurements were conducted in accordance with the Institutional Review Board guidelines for research on human subjects.
Experiments were carried out on a 7 Tesla head-only MR system (Agilent, Santa Clara, CA, USA) interfaced to a DirectDrive spectrometer operating at 298.1 MHz for protons. The MR scanner was equipped with custom-designed actively-shielded gradients (Magnex Scientific, Oxford, UK) and operated with Vnmrj 2.3A software (Varian, Santa Clara, CA, USA). An 8-channel transmit-receive array was used for spin handling and signal reception.
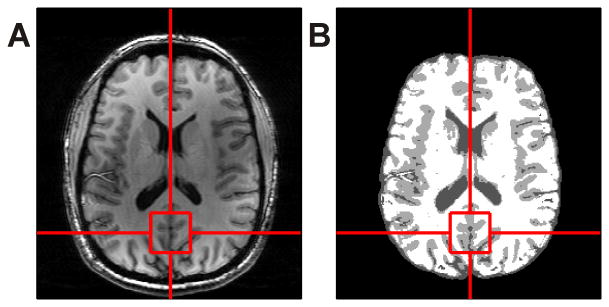
T1-weighted anatomical images were obtained with a customized inversion-recovery prepared MRI sequence (field of view 200×220×78 mm3, matrix size 256×256×39, resolution 0.78×0.86×2.00 mm3, inversion time (TI) 1000 ms, repetition time (TR) 3000 ms, echo time (TE) 6 ms, acquisition time 5 min). The anatomical images were used in the first session to position the spectroscopy voxel on the midline occipital cortex (Figure 1A). The voxel was visually repositioned in the second session at an estimated ≤ 1 mm error. Brain extraction of the anatomical images was performed using the Brain Extraction Tool (BET) (27) of the Oxford centre for functional MRI of the brain (FMRIB) Software Library (FSL) version 5.0 prior to brain segmentation. Gray matter, white matter, and cerebrospinal fluid (CSF) segmentation was applied using FMRIB's Automated Segmentation Tool (FAST) (28) (Figure 1B).
Figure 1.
Anatomical image in the axial plane (A) used for both voxel positioning on the midline occipital cortex and for brain segmentation (B).
B1 phase shimming was achieved through in-house developed MR methods and software (IMAGO). The B0 magnetic field of the unshimmed brain was derived from five single-echo gradient-echo images (field of view 220×220×60 mm3, matrix size 126×64×20, TE 3.8 ms, TR 1.3 s) at additional TE delays of 0/0.2/0.5/1.5/3 ms. B0 shimming included zero- through third-order spherical harmonic terms and was calculated with customized software (B0DETOX, (29)).
After shimming, a single-voxel version of the semi-localized by adiabatic selective refocusing (semi-LASER) JDE sequence (26) was applied for GABA editing (voxel size 3×3×3 cm3, TR 3 s, TE 72 ms, 128 averages per JDE condition, acquisition time 13 min) similar to Andreychenko et al (30). A multi-frequency pulse (Gaussian, 8 ms) was used for simultaneous spectral editing at 1.89 ppm (J-coupled to the 2CH2 GABA resonance at 3.01 ppm) and water suppression. The frequency position of the non-inverted condition was mirrored around water (∼7.51 ppm). A global inversion-preparation was applied to minimize potential macromolecule (MM) contributions and to prevent MM co-editing due to its coupling partner at 1.7 ppm. The optimal TI (300 ms) was determined experimentally and applied for the minimization of signals from the 3.01 ppm MM resonance.
Subsequently, the same JDE semi-LASER sequence was also used for GSH editing (number of averages 64 per JDE condition, acquisition time 7 min). The editing pulse was applied at 4.56 ppm to select the J-coupled CH2 signal from the 2.95 ppm GSH cysteine moiety and far away (5 kHz offset) for the non-edited condition. Here, inversion preparation was not necessary due to the lack of potential MM co-editing. Water suppression was achieved with CHESS in both the GSH and GABA editing experiments (31). Water references were acquired with both GSH and GABA spectra for eddy current correction.
Lastly, the short echo-time stimulated echo acquisition mode (STEAM) sequence (32) was used to detect GSH, GABA, glutamate, glutamine, choline, myo-inositol, NAA, N-acetylaspartylglutamate (NAAG), creatine, phosphocreatine, ascorbate, aspartate, scyllo-inositol, and taurine (voxel size 2×2×2 cm3, TR 3 s, TE 10 ms, mixing time 50 ms, 96 averages, acquisition time 5 min). MM resonances were suppressed by a non-selective inversion pulse (TI 320 ms) optimized to minimize the majority of the MM signals. Water suppression was based on CHESS and outer-volume suppression was used for improved localization specificity (33). An 8-average water reference was acquired and used for both eddy current correction and as internal reference for absolute metabolite quantification.
Spectra from individual acquisitions and all 8 receivers were stored separately. Spectral processing was done in MATLAB with a customized software package (INSPECTOR). First, eddy current phase correction (34) and sensitivity-weighted summation of the receive channels were applied. Spectra were phase and frequency aligned individually using a least-squares fit and a cross-correlation algorithm, respectively. Finally, the phase- and frequency-aligned spectra from individual acquisitions were averaged. The achieved spectral quality was assessed as full width at half maximum (FWHM) of the NAA resonance at 2.01 ppm in the non-inverted JDE condition. With STEAM, FWHM of creatine at 3.03 ppm and NAA at 2.01 ppm were obtained.
Metabolite quantification was achieved with LCModel version 6.3-1K (35) and was done relative to unsuppressed water. Basis spectra were calculated in SpinWizard (36) using density matrix simulations based on the spectral characteristics summarized in Govindaraju et al (37). The STEAM basis set included simulated spectra of ascorbate, aspartate, creatine, GABA, glutamate, glutamine, GSH, myo-inositol, NAAG, NAA, phosphocholine, phosphocreatine, scyllo-inositol, and taurine. Simulated spectra of GABA, glutamate, glutamine, and NAA were needed for GABA JDE signal fitting. For the LCModel analysis of GSH JDE signals, metabolite basis functions of only GSH and NAA were used because except for GSH and co-edited NAA signals, all other peaks are subtracted out. The editing efficiencies of GABA and GSH were determined theoretically for the applied JDE sequence compared to a pulse-acquire experiment and were found to be 41.5% and 18.5% (at 10 Hz linewidth), respectively. Metabolite concentrations were corrected for tissue water and CSF contributions to the MRS voxel based on brain segmentation results. Tissue and CSF fractions were confirmed by a spectroscopic T2 measurement in the volume of interest. To this end, a series of fully relaxed MRS acquisitions at varying TE (10-250 ms) and long TR (15 s) was acquired to disentangle tissue water from CSF based on differences in T2. The T2 relaxation time of CSF had been measured (190 ms, data not shown) and was included in this calculation as prior knowledge. Water concentrations of 43300 mM for gray matter, 35880 mM for white matter, and 55556 mM for CSF were assumed (35). The water T2 relaxation time correction factor was set to 0.81, based on a TE of 10 ms and a T2 relaxation time of 47 ms for water (35,38). In addition, every JDE experiment was accompanied with an explicit efficiency measurement which was executed to correct the obtained GSH and GABA concentrations. The water signal with and without the MEGA editing pulse applied to the water position was used to confirm the performance of the editing RF pulse comprising both frequency and power adjustments.
Statistical Analysis
LCModel quantification accuracy was assessed through Cramer-Rao lower bounds (CRLB) (39). Metabolites quantified with a CRLB above 50% were considered not detected (35). Reproducibility of the metabolite measurements was evaluated based on coefficients of variation (CoV) calculated in each subject for each individual metabolite by dividing the standard deviation of the two measurements by their concentration mean.
Results
The primary target substances GSH, GABA, and glutamate as well as glutamine, choline, myo-inositol, NAA, NAAG, creatine, phosphocreatine, ascorbate, aspartate, scyllo-inositol, and taurine were detectable in all 10 sessions of this reproducibility study.
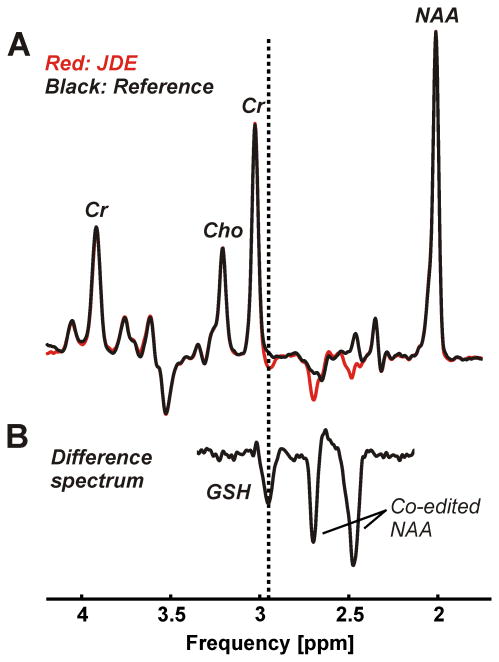
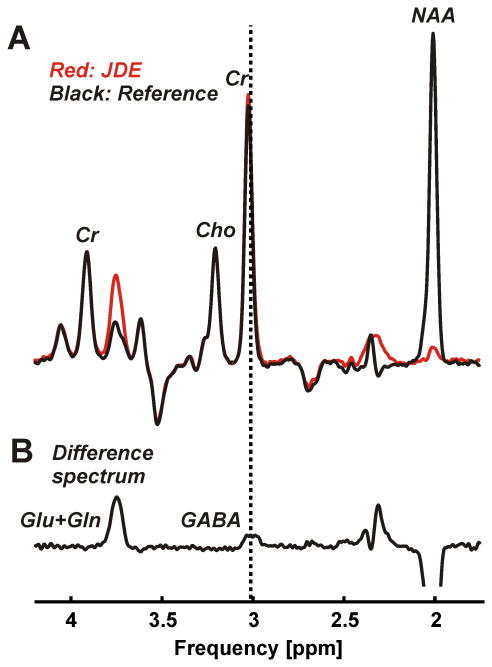
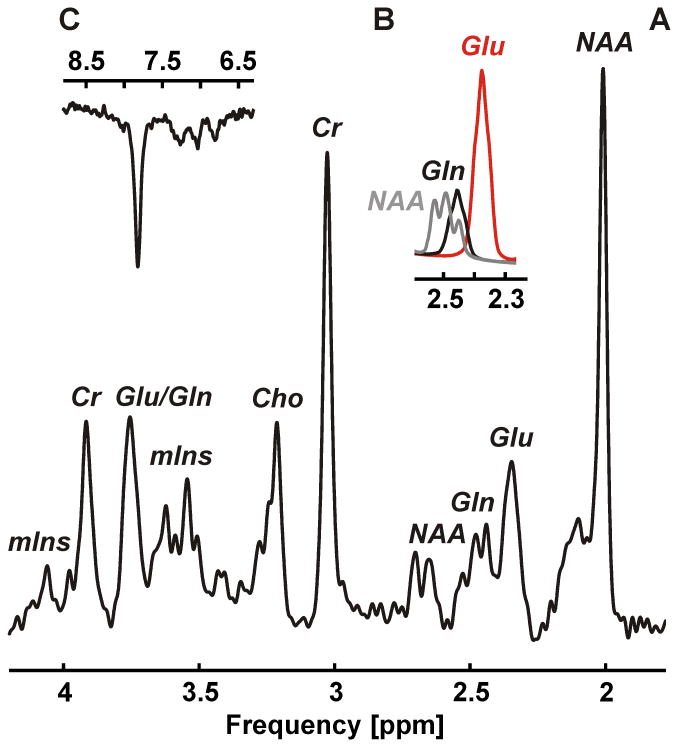
Neither baseline nor first order phase correction was necessary with any spectrum. Narrow spectral lines with an average width of 12.2±1.2 Hz were found for the 2.01 ppm NAA resonance of the non-inverted condition of the JDE measurement of GSH (Figure 2A) and 11.7±0.9 Hz for the non-inverted JDE condition of GABA (Figure 3A). JDE of GSH allowed the isolation of the CH2 signal from the cysteine moiety at 2.95 ppm (Figure 2B). With JDE of GABA, the metabolite content was accessible via its 3.01 ppm CH2 resonance (Figure 3B). With STEAM, average line widths of 11.8±1.5 Hz and 11.2±1.7 Hz were found for the CH3 protons of creatine at 3.03 ppm and NAA at 2.01 ppm, respectively (Figure 4A). Glutamate could be clearly separated from glutamine and NAA (Figure 4B).
Figure 2.
JDE of GSH consisting of an edited condition (A, red) and a non-inverted reference (A, black) was performed using a semi-LASER sequence (voxel size 3×3×3 cm3, TR 3 s, TE 72 ms, 64 averages per JDE condition, acquisition time 7 min). The difference spectrum (B, scaling factor 3.3) exhibits expected co-edited NAA at 2.49 and 2.67 ppm and allows the isolation of the GSH CH2 signal of the cysteine moiety at 2.95 ppm (dotted vertical line).
Figure 3.
JDE of GABA consisting of an edited condition (A, red) and a non-inverted reference (A, black) was performed using a semi-LASER sequence (voxel size 3×3×3 cm3, TR 3 s, TE 72 ms, 128 averages per JDE condition, acquisition time 13 min). The difference spectrum (B, scaling factor 1.1) exhibits expected co-edited glutamate and glutamine at 3.74 ppm and allows the isolation of the GABA 2CH2 signal at 3.01 ppm (dotted vertical line).
Figure 4.
1H MRS of target metabolites glutamate and glutamine along with additional metabolites choline, myo-inositol, NAA, creatine, ascorbate, aspartate, scyllo-inositol, and taurine measured with STEAM (A, voxel size 2×2×2 cm3, TR 3 s, TE 10 ms, mixing time 50 ms, 96 averages, acquisition time 5 min). The 4CH2 group of glutamate at 2.34/2.35 ppm could clearly be separated from both the 4CH2 group of glutamine at 2.43/2.46 ppm and the 3CH2 group of NAA at 2.49 ppm (B). The overall spectral quality supports the observation of down-field resonances, for instance, the phenylalanine peak at 7.37 ppm (C).
Metabolite quantification accuracy was high in both sessions of the 5 participants. LCModel fits resulted in minimal residuals and small quantification errors (Table 1, mean CRLB (%) per metabolite). More specifically, CRLB of 3% for GSH and ≤7% for GABA were obtained based on JDE measurements. STEAM spectra resulted in CRLB of ≤7% for GSH, ≤14% for GABA, ≤2% for glutamate, ≤4% for glutamine, and <10% for most additional metabolites (<24% in all cases).
Table 1. Metabolite concentrations (mM) measured twice in different sessions (#1 and #2) in 5 healthy subjects and mean quantification errors (CRLB, %) per metabolite.
| Subject 1 | Subject 2 | Subject 3 | Subject 4 | Subject 5 | CRLB | |||||||||
|---|---|---|---|---|---|---|---|---|---|---|---|---|---|---|
| #1 | #2 | #1 | #2 | #1 | #2 | #1 | #2 | #1 | #2 | Mean | ||||
| JDE | GSH | 2.32 | 2.08 | 2.09 | 1.97 | 1.99 | 2.17 | 2.41 | 2.02 | 2.36 | 2.09 | 3.0 | Target | |
| GABA | 1.08 | 1.14 | 1.62 | 1.68 | 1.60 | 1.30 | 1.26 | 1.11 | 1.09 | 1.41 | 4.3 | |||
| STEAM | GSH | 1.43 | 1.30 | 1.38 | 1.28 | 1.50 | 1.18 | 1.42 | 1.17 | 1.53 | 1.24 | 5.7 | ||
| GABA | 1.54 | 1.31 | 1.53 | 1.56 | 1.03 | 0.90 | 1.75 | 1.39 | 1.55 | 1.25 | 9.3 | |||
| Glu | 10.94 | 11.26 | 10.98 | 10.17 | 9.78 | 10.15 | 10.55 | 10.34 | 11.05 | 10.37 | 1.6 | |||
| Gln | 3.45 | 3.57 | 3.26 | 3.38 | 4.20 | 3.91 | 4.24 | 3.96 | 4.13 | 3.94 | 3.1 | |||
| Cho | 1.56 | 1.47 | 1.24 | 1.22 | 1.22 | 1.27 | 1.34 | 1.23 | 1.46 | 1.35 | 2.0 | Established | ||
| mIns | 8.77 | 8.28 | 7.70 | 7.48 | 7.32 | 7.31 | 6.56 | 6.40 | 7.93 | 7.23 | 1.7 | |||
| NAA | 11.84 | 10.92 | 12.40 | 12.17 | 10.68 | 10.85 | 11.10 | 10.85 | 12.74 | 11.62 | 1.0 | |||
| NAAG | 0.79 | 0.99 | 0.70 | 1.00 | 0.97 | 0.91 | 0.99 | 0.97 | 1.00 | 0.85 | 8.7 | |||
| tNAA | 12.64 | 11.91 | 13.10 | 13.17 | 11.65 | 11.75 | 12.09 | 11.82 | 13.73 | 12.46 | 1.0 | |||
| Cr | 5.73 | 5.74 | 6.13 | 5.78 | 5.40 | 5.71 | 5.19 | 5.83 | 6.06 | 5.68 | 3.0 | Additional | ||
| PCr | 4.19 | 4.01 | 4.11 | 4.02 | 3.45 | 3.35 | 4.01 | 3.46 | 4.13 | 3.77 | 4.1 | |||
| tCr | 9.92 | 9.75 | 10.24 | 9.80 | 8.85 | 9.06 | 9.20 | 9.29 | 10.19 | 9.46 | 1.0 | |||
| Asc | 2.52 | 2.02 | 1.92 | 1.96 | 1.92 | 1.81 | 1.93 | 2.29 | 2.24 | 2.32 | 7.7 | |||
| Asp | 2.49 | 2.30 | 1.10 | 1.89 | 0.97 | 0.95 | 1.94 | 1.14 | 2.19 | 1.62 | 14.6 | |||
| sIns | 0.30 | 0.31 | 0.26 | 0.19 | 0.16 | 0.19 | 0.25 | 0.28 | 0.31 | 0.22 | 12.7 | |||
| Tau | 2.32 | 2.02 | 1.99 | 1.52 | 1.93 | 1.77 | 2.37 | 2.42 | 2.94 | 2.09 | 4.8 | |||
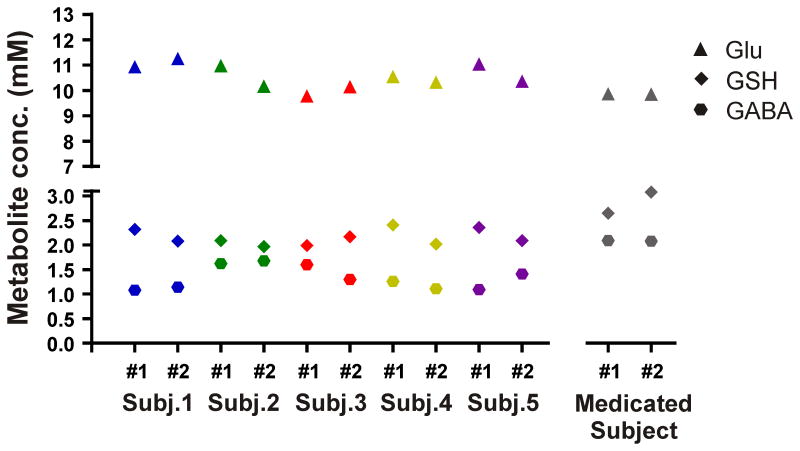
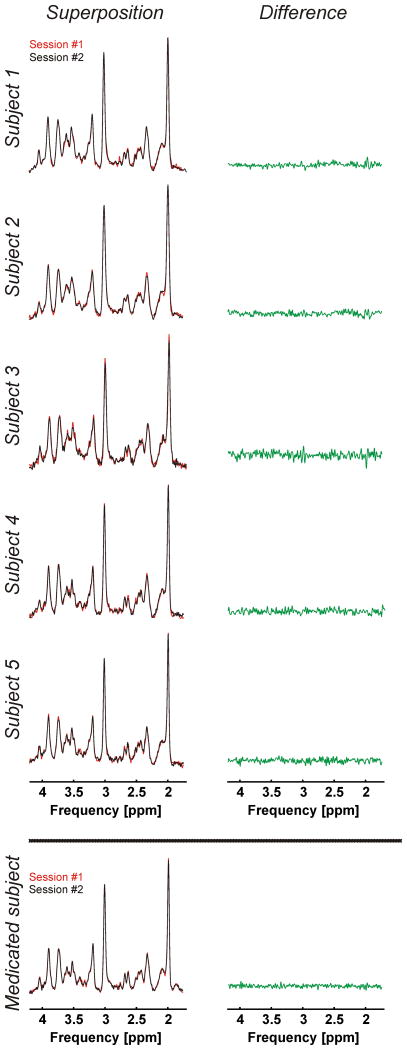
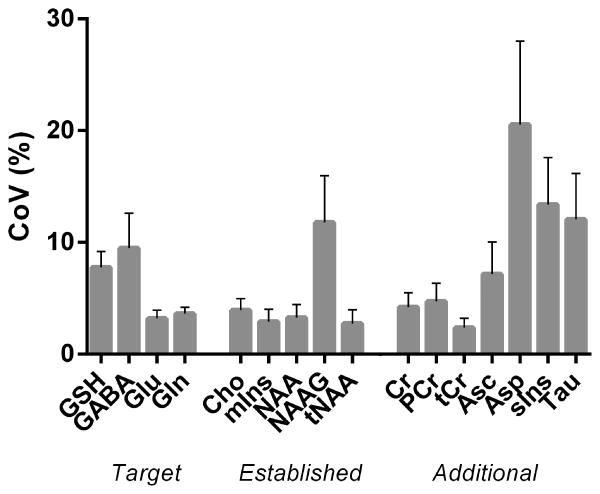
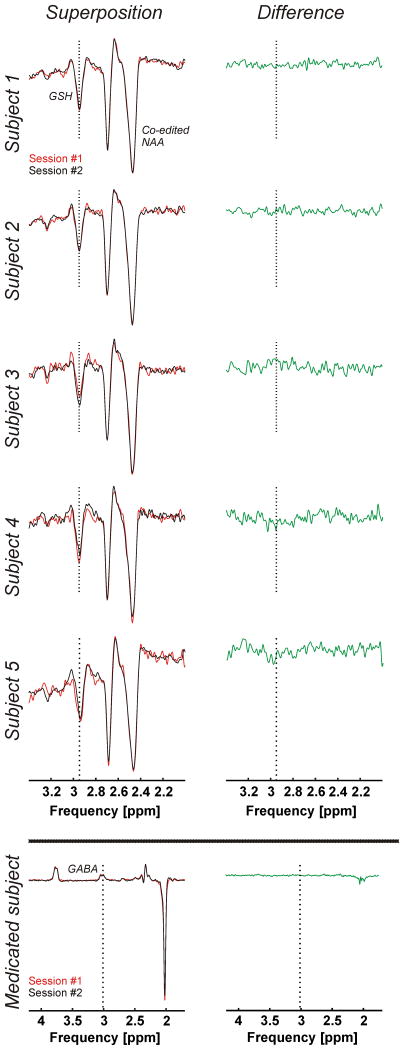
The mean GSH and GABA concentrations over all 10 measurements of this study were respectively 2.15±0.16 mM and 1.33±0.23 mM obtained through STEAM, and 1.34±0.13 mM and 1.38±0.26 mM obtained through editing. The average glutamate concentration was 10.56±0.48 mM. GSH, GABA, and glutamate concentrations per subject and for both sessions are presented in Table 1 and Figure 5 (GSH and GABA concentrations based on editing measurements). The test and re-test STEAM spectra from the same subject were highly reproducible (Figure 6, superposition) exhibited by the mean CoV of 3.2±1.7% for glutamate (Figure 7). The mean CoVs of GSH and GABA based on STEAM were 11.6±5.1% and 10.9±6.0%, respectively. The difference amplitudes of the test/re-test STEAM spectra were small and resembled the overall noise floor (Figure 6, difference), thereby demonstrating the level of reproducibility. The same holds true for the JDE measurements, as visible in the minimal difference between GSH and GABA difference spectra acquired during different sessions in the same subject (Figure 8). The high reproducibility of the JDE measurements is exhibited by mean CoVs of 7.8±3.2% and 9.5±7.0% for GSH and GABA, respectively (Figure 7). The average test/re-test concentration differences at this measurement reproducibility and quantification accuracy were smaller for GABA and glutamate than inter-subject variations in metabolite content with CoV ratios of 0.6 and 0.8, respectively. The obtained concentrations of glutamine, choline, myo-inositol, NAA, creatine, phosphocreatine, and ascorbate were highly reproducible between the first and second measurements (Table 1, Figure 7) with mean CoVs well below 10%. The average metabolite CoVs of NAAG, scyllo-inositol, and taurine were between 10 and 20%, and aspartate had a mean CoV of 21%.
Figure 5.
GSH, GABA, and glutamate concentrations (mM) in the occipital cortex of 5 healthy subjects studied twice in different sessions. Metabolite concentrations were also measured twice in a subject on medication known to impact GABA concentrations. GSH and GABA were measured using semi-LASER JDE, and STEAM was used to detect glutamate.
Figure 6.
Superposition of test-retest STEAM spectra (voxel size 2×2×2 cm3, TR 3 s, TE 10 ms, mixing time 50 ms, 96 averages, acquisition time 5 min) acquired during the two study sessions (#1 and #2, left) and their difference (right). Extra: Corresponding spectra of a subject on medication known to impact GABA concentrations.
Figure 7.
Mean CoV (%) of the target metabolites (GSH, GABA, glutamate and glutamine), the established MS biomarkers (choline, myo-inositol, N-acetylaspartate/ N-acetylaspartylglutamate), and additional metabolites (creatine, phosphocreatine, ascorbate, aspartate, scyllo-inositol, and taurine) quantified twice during different sessions in 5 healthy subjects. Error bars represent standard errors of the mean. GSH and GABA were measured using semi-LASER JDE, and STEAM was used to detect glutamate, glutamine, the established MS biomarkers, and additional metabolites.
Figure 8.
Superposition of test-retest difference spectra for JDE of GSH acquired using a semi-LASER sequence (voxel size 3×3×3 cm3, TR 3 s, TE 72 ms, 64 averages per JDE condition, acquisition time 7 min) during the two study sessions (#1 and #2, left) and their difference (right). Extra: Superposition of test-retest difference spectra for JDE of GABA acquired using a semi-LASER sequence (voxel size 3×3×3 cm3, TR 3 s, TE 72 ms, 128 averages per JDE condition, acquisition time 13 min) during the two study sessions (#1 and #2, left) and their difference (right) of a subject on medication known to impact GABA concentrations.
Note that Figures 5, 6, and 8 include the results of a sixth subject which have not been considered in the CoV analysis above. The measurements and metabolite quantification were also highly reproducible between the two sessions with CoVs of 5.4%, 0.1%, and 0.1% for GSH (JDE), GABA (JDE), and glutamate, respectively, but the results were not included in the overall CoV analysis as this subject was on a medication known to impact GABA concentrations.
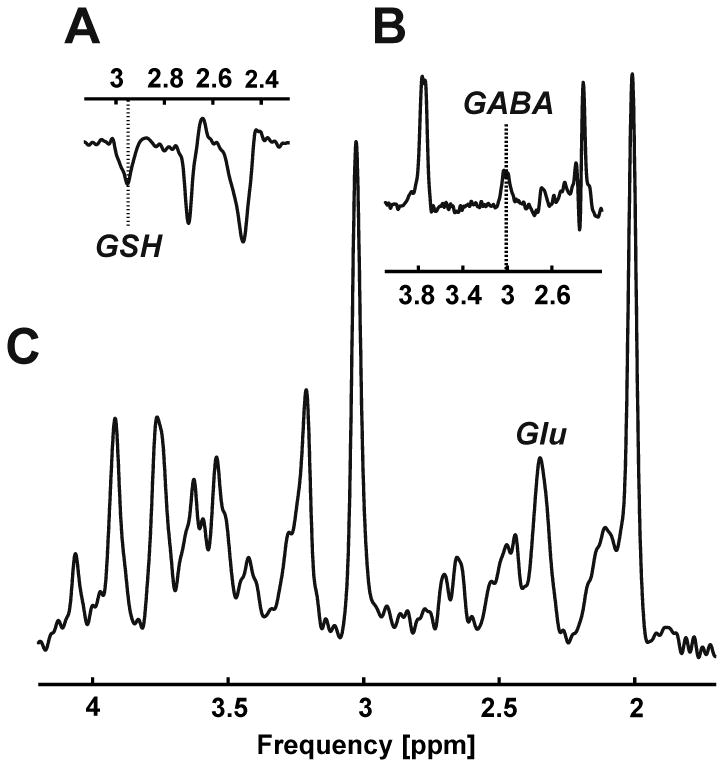
As proof of principle, GSH, GABA, and glutamate were detected along with the overall biochemical profile in the occipital cortex of an MS patient in a similar single, 1-hour session (Figure 9).
Figure 9.
Proof of principle: GSH (A), GABA (B), and glutamate (C, Glu) detection in an MS patient.
Discussion
Comprehensive single-voxel 1H MRS methods at 7 Tesla have been presented for the non-invasive, single-session measurement of GSH and other neurochemicals key to MS pathology. Single-voxel MRS was used as B0 and B1 conditions can be highly optimized and reasonably short individual acquisition times can be realized, allowing the execution of multiple scans in a single session. GSH, GABA, and glutamate were quantified along with the overall biochemical profile in the human brain with high accuracy and reproducibility in a single 1-hour session.
Previous JDE of GSH was based on the point resolved spectroscopy (PRESS) sequence (25). Here, a semi-LASER sequence was applied for GSH editing, which was not only advantageous with respect to signal formation (40) but also enabled excellent spatial definition of the MRS voxel. Note that the application of the editing scheme as proposed by Andreychenko et al (30) allowed 100% editing efficiency over the entire echo time. The functionality of the editing pulses themselves was confirmed experimentally in every subject by application of the MEGA scheme for water suppression (instead of JDE).
In contrast to GSH editing, JDE of GABA is vulnerable to MM co-editing. One way to handle potential MM contamination is by applying the editing pulse around the 1.7 ppm MM resonance in the two steps of the editing scheme (1.89 and 1.51 ppm) introduced by Henry et al. (41). This subtraction, however, results in complete elimination of the MM signal only under the assumption that both pulses are perfectly positioned and the 1.7 ppm MM resonance is fully symmetric. Potential system drifts therefore lead to suboptimal MM subtraction and a systematic over- or underestimation of GABA levels. Field variations due to the respiratory cycle pose a second stochastic challenge to the MM subtraction scheme. One way to avoid the co-edited MM signal is by applying an inversion-recovery preparation as used by Behar et al. (42). They demonstrated that MM signals can be fully suppressed by an inversion-recovery preparation if the delay between the inversion pulse and the MRS sequence itself is chosen to minimize (“null”) the specific MM at hand. Note that perfect signal elimination can be achieved for a single MM resonance with inversion preparation and that an experimentally determined optimal TI of 300 ms was applied here for the 3 ppm MM resonance. The resultant additional 50% reduction in GABA signal is substantial but has been accepted in this work to ensure reliable results.
MM signals are also a problem for short TE STEAM as they are known to cause a wavy baseline and to thereby substantially complicate metabolite quantification (42,43). The STEAM acquisition was therefore preceded by an inversion-recovery preparation to minimize MM contributions. This technique is, however, limited by the MM-specific spread of T1 relaxation times, precluding the perfect cancellation of all MM resonances. A TI of 320 ms optimized to minimize the majority of the MM signals was used here.
Dedicated measurements using highly optimized MRS methods were performed for each of the metabolites of primary interest in clinical MS research, namely, GSH, GABA, and glutamate. High-quality spectra characterized by a flat baseline, narrow spectral lines, excellent water suppression, and optimal MM suppression were obtained. With STEAM, a clear separation of the glutamate and glutamine (plus NAA) resonances at 2.35 ppm and 2.45 ppm, respectively, was achieved. While not the focus of this research, the overall spectral quality also supported the observation of down-field resonances (44).
CRLB were calculated to assess the quantification accuracy of the presented methods. The mean CRLB was low for the target metabolites GSH (JDE), GABA (JDE), and glutamate, indicating high quantification accuracy. Superposition of the spectra acquired in the same subject in different sessions showed virtually perfect overlap, which is a direct measure of high reproducibility. The reproducibility of the methods was confirmed by low mean CoV values for GSH (JDE), GABA (JDE), and for glutamate. The consistently elevated GABA levels obtained from the medicated subject underline the reproducibility of the measurements and the sensitivity of the methods to detect abnormal metabolite levels. As proof of principle, GSH, GABA, and glutamate were also detected in an MS patient. The presented study design allowed the reliable quantification of the primary target metabolites, other established biomarkers of MS including choline, myo-inositol, and NAA, and additional metabolites of the biochemical profile including creatine, phosphocreatine, and ascorbate were obtained in a single 1-hour session.
Comparison of GSH concentrations, quantification accuracy, and reproducibility between STEAM and JDE measurements in the current study suggests the advantages of an editing over a non-editing technique. STEAM spectra at short TE suffer from significant spectral overlap with MM signals, which limits the achievable quantification analysis and accuracy. In addition, the GSH signal can accidentally be confounded with other, overlapping resonances like creatine or GABA, leading to an over- or underestimation of the GSH concentration. JDE of GSH reduces the number of spectral components to GSH and NAA only and simplifies the quantification due to the absence of spectral overlap. In the present study the average GSH concentration obtained through STEAM was lower than that obtained through JDE. The mean CRLB of GSH quantified based on editing was lower than that based on STEAM; the mean CoV was also lower. Additionally, the mean CRLB and CoV were lower for JDE of GABA than for GABA obtained through STEAM. These results advocate for the measurement of GSH and GABA individually using JDE instead of as part of, for example, a STEAM acquisition.
Reported GSH concentrations determined in the human occipital cortex at 7 Tesla range from 0.5-2.3 mM (e.g. (38,45-47)). The GSH concentration obtained through JDE presented in the current study falls into the upper end of this range. The reproducibility of GSH quantification at 7 Tesla by means of CoV values has been reported previously in different areas of the human brain (48-51). These studies reported mean CoVs ranging from 5 to 14.4%. The mean CoV for JDE of GSH in the present study was slightly higher than the 5% reported by Deelchand et al., who used a short TE STEAM sequence in the posterior cingulate cortex.
Multiple studies presented GABA concentrations measured in the human occipital cortex at 7 Tesla previously with a concentration range of 0.2 to ∼2 mM (e.g. (30,46,50,52,53)). The GABA concentration obtained through JDE reported in the present study is within this range. The reproducibility of GABA quantification in different areas of the human brain at 7 Tesla by means of CoV values has been assessed previously (50,51,54,55). The reproducibility of the GABA JDE measurement in the current study was better than in the studies of Terpstra et al. (50), van de Bank et al. (51), and Stephenson et al. (54) (mean CoV range of 16-22%), which used a STEAM or semi-LASER sequence. In the study by Wijtenburg et al. (55), the reproducibility of GABA quantification was addressed in the anterior cingulate (AC) and dorsolateral prefrontal cortex (DLPFC) for both short TE STEAM and Mescher-Garwood PRESS (MEGA-PRESS) editing. In the editing experiment, MM minimization was achieved by applying the editing pulse around the 1.7 ppm MM resonance. The mean CoV for GABA was lower in the present study than that reported by Wijtenburg et al. using the editing technique (13.6% in the AC and 13.4% in the DLPFC) and using STEAM in the DLPFC (16.2%), but it was higher than the mean CoV using STEAM in the AC (3.5%). The GABA quantification accuracy expressed as CRLB was, however, better in the current study compared to that of the STEAM experiments in the study by Wijtenburg et al. (CRLB 10.5-11.0% in the DLPFC and 8.3-9.3% in the AC). Wijtenburg et al. quantified GABA by peak integration, and no quantification errors were reported.
Different sequences, including STEAM, PRESS, (semi-)LASER and SPECIAL (56), have been used to detect glutamate in the human occipital cortex at 7 Tesla. The concentration of glutamate reported in the present study is within the concentration range as reported in these studies (8.6-11.3 mM, e.g. (38,46,57,58)). The reproducibility of glutamate quantification at 7 Tesla by means of CoV values has been explored previously in different areas of the human brain (49-51,54). The reproducibility of the glutamate measurement is better in the present study than that of Stephenson et al. (mean CoV of 8% in both the anterior cingulate cortex and the insula), who also used a STEAM sequence. The mean CoV for glutamate is also lower in the current study than in the study of Lally et al. (6.5-8.0% in the prefrontal cortex), who used a TE optimized PRESS sequence in combination with a J-suppression pulse to attenuate NAA at 2.49 ppm. The study of van de Bank et al., which used a semi-LASER sequence, and the present study show comparable reproducibility of glutamate quantification (mean CoV 3.1% in the posterior cingulate cortex and 3.4% in the corona radiata). The reproducibility of the glutamate in the study of Terpstra et al., also using a semi-LASER sequence, is even better, with a mean CoV in the posterior cingulate of ∼2.5% (presented as bar graphs) and ∼3% in the cerebellum.
CRLB describe the lowest possible standard deviation of the spectral decomposition; in other words, it is a measure of maximum confidence in the numerical procedure at hand. The CoV summarizes the reproducibility of metabolite concentrations irrespective of the way they were derived. Both parameters provide means for the identification of limited data quality if CRLB and CoV are large. They do not represent unique measures of data quality and metabolite quantification, however, as they are lacking the sensitivity to detect systematic but reproducible errors. Such errors do not only include extreme scenarios like erroneous voxel location (e.g. left versus right coordinate inversion), but also more subtle effects like co-edited MM signals in GABA JDE experiments or the misinterpretation of spectral signals in the quantification process e.g. in case of short-TE STEAM, where GSH and GABA are largely overlapping with much stronger signals from creatine and MM). MM concentrations are potentially elevated in MS (59) and thus the risk of erroneous metabolite quantification is further enhanced for GABA JDE and STEAM investigations of MS pathology. There is arguably no ground truth available for in vivo MRS, and the positive proof of accurate metabolite quantification remains inherently impossible. We therefore applied the best available MRS methods to detect the key metabolites of MS pathology and optimized them to minimize the risk of systematic errors. The use of inversion-recovery preparation for the minimization of MM signals came at the cost of a substantial signal-to-noise ratio reduction. This choice was considered justified in this study, however, to achieve the most reliable metabolite quantification and to thereby set the stage for future clinical MS research.
Next to GSH, GABA, and glutamate, the concentrations of glutamine, choline, myo-inositol, NAA, NAAG, creatine, phosphocreatine, aspartate, scyllo-inositol, and taurine were within previously reported ranges (22). The concentration of ascorbate was slightly higher in the present study compared to literature values (0.5-1.5 mM (22)). Differences in metabolite concentrations between the current study and previous reports could be the result of variation of TE or the application of T2 correction schemes.
The study involved five healthy volunteers and one MS patient to demonstrate the feasibility of neurochemical profiling in a 1-hour experiment and to assess the achievable reproducibility. Neither did the study aim to compare metabolite concentrations between healthy subjects and MS patients, nor were the group sizes suitable for such analysis. Voxel repositioning between test/retest sessions was achieved at an estimated error of less than 1 mm in all three directions. While a minute impact on the apparent metabolite content cannot be excluded, these imperfections are considered small. Another reason for potential test/retest variation might have been subject movement, including both breathing and voluntary movements, throughout either the test and/or the retest session. In addition, physiological variations like circadian rhythm, exercise level, or food intake cannot be excluded. The high level of reproducibility achieved in this study suggests, however, that the cumulative impact of the above effects has been small.
In conclusion, this study shows that GSH, GABA, glutamate, and other MS-related metabolites can be quantified at 7 Tesla with high accuracy and reproducibility in a single 1-hour session. This brain metabolomics-type approach allows the comprehensive characterization of specific metabolites in vivo, and metabolic partners, implicated in MS pathogenesis. The methodology is expected to serve as a clinical research tool to target the biochemistry of oxidative stress, tissue injury, and repair in neurodegenerative diseases such as MS.
Acknowledgments
We thank all the subjects who participated in this study.
Grant Support: This research was supported by the National Multiple Sclerosis Society (RG 4319 and PP 3356), the Nancy Davis Foundation, and NIH (UL1 TR000142, R01 NS062885, and P30 NS052519).
References
- 1.Goldenberg MM. Multiple sclerosis review. P T. 2012;37:175–184. [PMC free article] [PubMed] [Google Scholar]
- 2.Lublin FD, Reingold SC, Cohen JA, et al. Defining the clinical course of multiple sclerosis: the 2013 revisions. Neurology. 2014;83:278–286. doi: 10.1212/WNL.0000000000000560. [DOI] [PMC free article] [PubMed] [Google Scholar]
- 3.De Stefano N, Filippi M. MR spectroscopy in multiple sclerosis. J Neuroimaging. 2007;17(Suppl 1):31S–35S. doi: 10.1111/j.1552-6569.2007.00134.x. [DOI] [PubMed] [Google Scholar]
- 4.Arnold DL, Matthews PM, Francis G, Antel J. Proton magnetic resonance spectroscopy of human brain in vivo in the evaluation of multiple sclerosis: assessment of the load of disease. Magn Reson Med. 1990;14:154–159. doi: 10.1002/mrm.1910140115. [DOI] [PubMed] [Google Scholar]
- 5.Davie CA, Hawkins CP, Barker GJ, et al. Serial proton magnetic resonance spectroscopy in acute multiple sclerosis lesions. Brain. 1994;117(Pt 1):49–58. doi: 10.1093/brain/117.1.49. [DOI] [PubMed] [Google Scholar]
- 6.Helms G, Stawiarz L, Kivisakk P, Link H. Regression analysis of metabolite concentrations estimated from localized proton MR spectra of active and chronic multiple sclerosis lesions. Magn Reson Med. 2000;43:102–110. doi: 10.1002/(sici)1522-2594(200001)43:1<102::aid-mrm12>3.0.co;2-i. [DOI] [PubMed] [Google Scholar]
- 7.Paling D, Golay X, Wheeler-Kingshott C, Kapoor R, Miller D. Energy failure in multiple sclerosis and its investigation using MR techniques. J Neurol. 2011;258:2113–2127. doi: 10.1007/s00415-011-6117-7. [DOI] [PubMed] [Google Scholar]
- 8.Lu SC. Glutathione synthesis. Biochim Biophys Acta. 2013;1830:3143–3153. doi: 10.1016/j.bbagen.2012.09.008. [DOI] [PMC free article] [PubMed] [Google Scholar]
- 9.Calabrese V, Raffaele R, Cosentino E, Rizza V. Changes in cerebrospinal fluid levels of malondialdehyde and glutathione reductase activity in multiple sclerosis. Int J Clin Pharmacol Res. 1994;14:119–123. [PubMed] [Google Scholar]
- 10.Ljubisavljevic S, Stojanovic I, Pavlovic D, Sokolovic D, Stevanovic I. Aminoguanidine and N-acetyl-cysteine supress oxidative and nitrosative stress in EAE rat brains. Redox Rep. 2011;16:166–172. doi: 10.1179/1351000211Y.0000000007. [DOI] [PMC free article] [PubMed] [Google Scholar]
- 11.Mohamed A, Shoker A, Bendjelloul F, et al. Improvement of experimental allergic encephalomyelitis (EAE) by thymoquinone; an oxidative stress inhibitor. Biomed Sci Instrum. 2003;39:440–445. [PubMed] [Google Scholar]
- 12.Hayes JD, Strange RC. Potential contribution of the glutathione S-transferase supergene family to resistance to oxidative stress. Free Radic Res. 1995;22:193–207. doi: 10.3109/10715769509147539. [DOI] [PubMed] [Google Scholar]
- 13.Mann CL, Davies MB, Boggild MD, et al. Glutathione S-transferase polymorphisms in MS: their relationship to disability. Neurology. 2000;54:552–557. doi: 10.1212/wnl.54.3.552. [DOI] [PubMed] [Google Scholar]
- 14.Frade J, Pope S, Schmidt M, et al. Glutamate induces release of glutathione from cultured rat astrocytes--a possible neuroprotective mechanism? J Neurochem. 2008;105:1144–1152. doi: 10.1111/j.1471-4159.2008.05216.x. [DOI] [PubMed] [Google Scholar]
- 15.Erecinska M, Silver IA. Metabolism and role of glutamate in mammalian brain. Prog Neurobiol. 1990;35:245–296. doi: 10.1016/0301-0082(90)90013-7. [DOI] [PubMed] [Google Scholar]
- 16.Rothman DL, De Feyter HM, de Graaf RA, Mason GF, Behar KL. 13C MRS studies of neuroenergetics and neurotransmitter cycling in humans. NMR Biomed. 2011;24:943–957. doi: 10.1002/nbm.1772. [DOI] [PMC free article] [PubMed] [Google Scholar]
- 17.Pitt D, Nagelmeier IE, Wilson HC, Raine CS. Glutamate uptake by oligodendrocytes: Implications for excitotoxicity in multiple sclerosis. Neurology. 2003;61:1113–1120. doi: 10.1212/01.wnl.0000090564.88719.37. [DOI] [PubMed] [Google Scholar]
- 18.Baranzini SE, Srinivasan R, Khankhanian P, et al. Genetic variation influences glutamate concentrations in brains of patients with multiple sclerosis. Brain. 2010;133:2603–2611. doi: 10.1093/brain/awq192. [DOI] [PMC free article] [PubMed] [Google Scholar]
- 19.Bhat R, Axtell R, Mitra A, et al. Inhibitory role for GABA in autoimmune inflammation. Proc Natl Acad Sci U S A. 2010;107:2580–2585. doi: 10.1073/pnas.0915139107. [DOI] [PMC free article] [PubMed] [Google Scholar]
- 20.Choi IY, Lee P. Doubly selective multiple quantum chemical shift imaging and T(1) relaxation time measurement of glutathione (GSH) in the human brain in vivo. NMR Biomed. 2013;26:28–34. doi: 10.1002/nbm.2815. [DOI] [PMC free article] [PubMed] [Google Scholar]
- 21.Srinivasan R, Ratiney H, Hammond Rosenbluth K, Pelletier D, Nelson S. MR spectroscopic imaging of glutathione in the white and gray matter at 7 T with an application to multiple sclerosis. Magnetic resonance imaging. 2010;28:163–170. doi: 10.1016/j.mri.2009.06.008. [DOI] [PubMed] [Google Scholar]
- 22.de Graaf RA. Vivo NMR Spectroscopy: Principles and Techniques. London: John Wiley and Sons; 2008. [Google Scholar]
- 23.Rothman DL, Petroff OA, Behar KL, Mattson RH. Localized 1H NMR measurements of gamma-aminobutyric acid in human brain in vivo. Proc Natl Acad Sci U S A. 1993;90:5662–5666. doi: 10.1073/pnas.90.12.5662. [DOI] [PMC free article] [PubMed] [Google Scholar]
- 24.Tkac I, Andersen P, Adriany G, Merkle H, Ugurbil K, Gruetter R. In vivo 1H NMR spectroscopy of the human brain at 7 T. Magn Reson Med. 2001;46:451–456. doi: 10.1002/mrm.1213. [DOI] [PubMed] [Google Scholar]
- 25.Bottomley PA. Selective volume method for performing localized NMR spectroscopy. US Patent 4 1984:480/228 [Google Scholar]
- 26.Scheenen TW, Klomp DW, Wijnen JP, Heerschap A. Short echo time 1H-MRSI of the human brain at 3T with minimal chemical shift displacement errors using adiabatic refocusing pulses. Magn Reson Med. 2008;59:1–6. doi: 10.1002/mrm.21302. [DOI] [PubMed] [Google Scholar]
- 27.Smith SM. Fast robust automated brain extraction. Hum Brain Mapp. 2002;17:143–155. doi: 10.1002/hbm.10062. [DOI] [PMC free article] [PubMed] [Google Scholar]
- 28.Zhang Y, Brady M, Smith S. Segmentation of brain MR images through a hidden Markov random field model and the expectation-maximization algorithm. IEEE Trans Med Imaging. 2001;20:45–57. doi: 10.1109/42.906424. [DOI] [PubMed] [Google Scholar]
- 29.Juchem C, Umesh Rudrapatna S, Nixon TW, de Graaf RA. Dynamic multi-coil technique (DYNAMITE) shimming for echo-planar imaging of the human brain at 7 Tesla. Neuroimage. 2015;105:462–472. doi: 10.1016/j.neuroimage.2014.11.011. [DOI] [PMC free article] [PubMed] [Google Scholar]
- 30.Andreychenko A, Boer VO, Arteaga de Castro CS, Luijten PR, Klomp DW. Efficient spectral editing at 7 T: GABA detection with MEGA-sLASER. Magn Reson Med. 2012;68:1018–1025. doi: 10.1002/mrm.24131. [DOI] [PubMed] [Google Scholar]
- 31.Haase A, Frahm J, Hanicke W, Matthaei D. 1H NMR chemical shift selective (CHESS) imaging. Phys Med Biol. 1985;30:341–344. doi: 10.1088/0031-9155/30/4/008. [DOI] [PubMed] [Google Scholar]
- 32.Frahm J, Bruhn H, Gyngell ML, Merboldt KD, Hanicke W, Sauter R. Localized high-resolution proton NMR spectroscopy using stimulated echoes: initial applications to human brain in vivo. Magn Reson Med. 1989;9:79–93. doi: 10.1002/mrm.1910090110. [DOI] [PubMed] [Google Scholar]
- 33.Juchem C, Logothetis NK, Pfeuffer J. 1H-MRS of the macaque monkey primary visual cortex at 7 T: strategies and pitfalls of shimming at the brain surface. Magn Reson Imaging. 2007;25:902–912. doi: 10.1016/j.mri.2007.03.008. [DOI] [PubMed] [Google Scholar]
- 34.Klose U. In vivo proton spectroscopy in presence of eddy currents. Magn Reson Med. 1990;14:26–30. doi: 10.1002/mrm.1910140104. [DOI] [PubMed] [Google Scholar]
- 35.Provencher SW. Estimation of metabolite concentrations from localized in vivo proton NMR spectra. Magn Reson Med. 1993;30:672–679. doi: 10.1002/mrm.1910300604. [DOI] [PubMed] [Google Scholar]
- 36.de Graaf RA, Prinsen H, Giannini C, Caprio S, Herzog RI. Quantification of H NMR Spectra from Human Plasma. Metabolomics. 2015;11:1702–1707. doi: 10.1007/-s11306-015-0828-1. [DOI] [PMC free article] [PubMed] [Google Scholar]
- 37.Govindaraju V, Young K, Maudsley AA. Proton NMR chemical shifts and coupling constants for brain metabolites. NMR Biomed. 2000;13:129–153. doi: 10.1002/1099-1492(200005)13:3<129::aid-nbm619>3.0.co;2-v. [DOI] [PubMed] [Google Scholar]
- 38.Marjanska M, Auerbach EJ, Valabregue R, Van de Moortele PF, Adriany G, Garwood M. Localized 1H NMR spectroscopy in different regions of human brain in vivo at 7 T: T2 relaxation times and concentrations of cerebral metabolites. NMR Biomed. 2012;25:332–339. doi: 10.1002/nbm.1754. [DOI] [PMC free article] [PubMed] [Google Scholar]
- 39.Cavassila S, Deval S, Huegen C, van Ormondt D, Graveron-Demilly D. Cramer-Rao bound expressions for parametric estimation of overlapping peaks: influence of prior knowledge. J Magn Reson. 2000;143:311–320. doi: 10.1006/jmre.1999.2002. [DOI] [PubMed] [Google Scholar]
- 40.Kaiser LG, Young K, Matson GB. Numerical simulations of localized high field 1H MR spectroscopy. J Magn Reson. 2008;195:67–75. doi: 10.1016/j.jmr.2008.08.010. [DOI] [PMC free article] [PubMed] [Google Scholar]
- 41.Henry PG, Dautry C, Hantraye P, Bloch G. Brain GABA editing without macromolecule contamination. Magn Reson Med. 2001;45:517–520. doi: 10.1002/1522-2594(200103)45:3<517::aid-mrm1068>3.0.co;2-6. [DOI] [PubMed] [Google Scholar]
- 42.Behar KL, Rothman DL, Spencer DD, Petroff OA. Analysis of macromolecule resonances in 1H NMR spectra of human brain. Magn Reson Med. 1994;32:294–302. doi: 10.1002/mrm.1910320304. [DOI] [PubMed] [Google Scholar]
- 43.de Graaf RA, Brown PB, McIntyre S, Nixon TW, Behar KL, Rothman DL. High magnetic field water and metabolite proton T1 and T2 relaxation in rat brain in vivo. Magn Reson Med. 2006;56:386–394. doi: 10.1002/mrm.20946. [DOI] [PubMed] [Google Scholar]
- 44.Kreis R, Pietz J, Penzien J, Herschkowitz N, Boesch C. Identification and quantitation of phenylalanine in the brain of patients with phenylketonuria by means of localized in vivo 1H magnetic-resonance spectroscopy. J Magn Reson B. 1995;107:242–251. doi: 10.1006/jmrb.1995.1084. [DOI] [PubMed] [Google Scholar]
- 45.Emir UE, Auerbach EJ, Van De Moortele PF, et al. Regional neurochemical profiles in the human brain measured by (1)H MRS at 7 T using local B(1) shimming. NMR Biomed. 2012;25:152–160. doi: 10.1002/nbm.1727. [DOI] [PMC free article] [PubMed] [Google Scholar]
- 46.Lin Y, Stephenson MC, Xin L, Napolitano A, Morris PG. Investigating the metabolic changes due to visual stimulation using functional proton magnetic resonance spectroscopy at 7 T. J Cereb Blood Flow Metab. 2012;32:1484–1495. doi: 10.1038/jcbfm.2012.33. [DOI] [PMC free article] [PubMed] [Google Scholar]
- 47.Terpstra M, Ugurbil K, Tkac I. Noninvasive quantification of human brain ascorbate concentration using 1H NMR spectroscopy at 7 T. NMR Biomed. 2010;23:227–232. doi: 10.1002/nbm.1423. [DOI] [PMC free article] [PubMed] [Google Scholar]
- 48.Deelchand DK, Marjanska M, Hodges JS, Terpstra M. Sensitivity and specificity of human brain glutathione concentrations measured using short-TE H MRS at 7 T. NMR Biomed. 2016 doi: 10.1002/nbm.3507. [DOI] [PMC free article] [PubMed] [Google Scholar]
- 49.Lally N, An L, Banerjee D, et al. Reliability of 7T (1) H-MRS measured human prefrontal cortex glutamate, glutamine, and glutathione signals using an adapted echo time optimized PRESS sequence: A between- and within-sessions investigation. J Magn Reson Imaging. 2016;43:88–98. doi: 10.1002/jmri.24970. [DOI] [PMC free article] [PubMed] [Google Scholar]
- 50.Terpstra M, Cheong I, Lyu T, et al. Test-retest reproducibility of neurochemical profiles with short-echo, single-voxel MR spectroscopy at 3T and 7T. Magn Reson Med. 2015 doi: 10.1002/mrm.26022. [DOI] [PMC free article] [PubMed] [Google Scholar]
- 51.van de Bank BL, Emir UE, Boer VO, et al. Multi-center reproducibility of neurochemical profiles in the human brain at 7 T. NMR Biomed. 2015;28:306–316. doi: 10.1002/nbm.3252. [DOI] [PMC free article] [PubMed] [Google Scholar]
- 52.Marsman A, Mandl RC, Klomp DW, et al. GABA and glutamate in schizophrenia: a 7 T (1)H-MRS study. Neuroimage Clin. 2014;6:398–407. doi: 10.1016/j.nicl.2014.10.005. [DOI] [PMC free article] [PubMed] [Google Scholar]
- 53.Schaller B, Mekle R, Xin L, Kunz N, Gruetter R. Net increase of lactate and glutamate concentration in activated human visual cortex detected with magnetic resonance spectroscopy at 7 tesla. J Neurosci Res. 2013;91:1076–1083. doi: 10.1002/jnr.23194. [DOI] [PubMed] [Google Scholar]
- 54.Stephenson MC, Gunner F, Napolitano A, et al. Applications of multi-nuclear magnetic resonance spectroscopy at 7T. World J Radiol. 2011;3:105–113. doi: 10.4329/wjr.v3.i4.105. [DOI] [PMC free article] [PubMed] [Google Scholar]
- 55.Wijtenburg SA, Rowland LM, Edden RA, Barker PB. Reproducibility of brain spectroscopy at 7T using conventional localization and spectral editing techniques. J Magn Reson Imaging. 2013;38:460–467. doi: 10.1002/jmri.23997. [DOI] [PMC free article] [PubMed] [Google Scholar]
- 56.Mlynarik V, Gambarota G, Frenkel H, Gruetter R. Localized short-echo-time proton MR spectroscopy with full signal-intensity acquisition. Magn Reson Med. 2006;56:965–970. doi: 10.1002/mrm.21043. [DOI] [PubMed] [Google Scholar]
- 57.Bednarik P, Tkac I, Giove F, et al. Neurochemical and BOLD responses during neuronal activation measured in the human visual cortex at 7 Tesla. J Cereb Blood Flow Metab. 2015;35:601–610. doi: 10.1038/jcbfm.2014.233. [DOI] [PMC free article] [PubMed] [Google Scholar]
- 58.Mekle R, Mlynarik V, Gambarota G, Hergt M, Krueger G, Gruetter R. MR spectroscopy of the human brain with enhanced signal intensity at ultrashort echo times on a clinical platform at 3T and 7T. Magn Reson Med. 2009;61:1279–1285. doi: 10.1002/mrm.21961. [DOI] [PubMed] [Google Scholar]
- 59.Mader I, Seeger U, Weissert R, et al. Proton MR spectroscopy with metabolite-nulling reveals elevated macromolecules in acute multiple sclerosis. Brain. 2001;124:953–961. doi: 10.1093/brain/124.5.953. [DOI] [PubMed] [Google Scholar]


