

Abstract
Objectives
Famine exposure in utero can ‘programme’ an individual towards type 2 diabetes and obesity in later life. We sought to identify, (1) whether Bangladeshis exposed to famine during developmental life are programmed towards diabetes and obesity, (2) whether this programming was specific to gestational or postnatal exposure windows and (3) whether epigenetic differences were associated with famine exposure.
Design
A historical cohort study was performed as part of a wider cross-sectional survey. Exposure to famine was defined through birth date and historical records and participants were selected according to: (A) exposure to famine in postnatal life, (B) exposure to famine during gestation and (C) unexposed.
Setting
Matlab, a rural area in the Chittagong division of Bangladesh.
Participants
Young adult men and women (n=190) recruited to a historical cohort study with a randomised subsample included in an epigenetic study (n=143).
Outcome measures
Primary outcome measures of weight, body mass index and oral glucose tolerance tests (0 and 120 min glucose). Secondary outcome measures included DNA methylation using genome-wide and targeted analysis of metastable epialleles sensitive to maternal nutrition.
Results
More young adults exposed to famine in gestation were underweight than those postnatally exposed or unexposed. In contrast, more young adults exposed to famine postnatally were overweight compared to those gestationally exposed or unexposed. Underweight adults exposed to famine in gestation in utero were hyperglycaemic following a glucose tolerance test, and those exposed postnatally had elevated fasting glucose, compared to those unexposed. Significant differences in DNA methylation at seven metastable epialleles (VTRNA2-1, PAX8, PRDM-9, near ZFP57, near BOLA, EXD3) known to vary with gestational famine exposure were identified.
Conclusions
Famine exposure in developmental life programmed Bangladeshi offspring towards diabetes and obesity in adulthood but gestational and postnatal windows of exposure had variable effects on phenotype. DNA methylation differences were replicated at previously identified metastable epialleles sensitive to periconceptual famine exposure.
Keywords: Fetal programming, Developmental origins of health and disease, Epigenetics, Bangladesh, Malnutrition, South Asia
Strengths and limitations of this study.
This study uses both clinical and molecular tools to investigate the developmental programming hypothesis in a Bangladeshi population at high background risk of type 2 diabetes.
A historical cohort study has allowed detailed analysis of the effects of famine exposure windows during gestation and postnatal life.
We provide important evidence that DNA methylation differences at metastable epialleles sensitive to periconceptual nutritional availability can be replicated in a different setting and ethnic group.
Our genome-wide analysis of epigenetic differences associated with famine exposure in early life was not able to detect DNA methylation differences according to the developmental windows studied, due to the insufficient sample size to overcome the potential multiple hypothesis testing bias.
Future studies should expand on this study design and scaled-up longitudinal resampling of this population for phenotypic and molecular studies will provide an important setting with which to investigate the causative role of early life famine exposure in the programming of future type 2 diabetes.
Introduction
The global prevalence of type 2 diabetes and obesity is increasing rapidly and their associated vascular complications bring high morbidity and mortality.1 Bangladesh is a South Asian country undergoing demographic transition and with rapidly rising type 2 diabetes prevalence, increasing from 4% in 1990 to 10% in 2010 and projected to have over 10 million people with type 2 diabetes by 2030. Since the observation that low birth weight was associated with increased risk of type 2 diabetes in later life,2 the concept of developmental programming has been considered a possible contributor to this rising prevalence and its ‘missing heritability’, that is, the risk not explained by polygenic or environmental influence alone.3 Exposure to severe nutritional deprivation in early life development has been associated with future risk of type 2 diabetes and obesity in several human and animal models.4–9 South Asian populations are at high risk of type 2 diabetes and obesity1 and the contribution of fetal programming to this is poorly understood. It is hypothesised that the rapid increase in diabetes risk in South Asians may reflect a mismatch between the development of a fetus in an environment of ‘thrift’ and transition in later life into an environment of nutritional excess, reduced energy expenditure due to changing behaviour patterns, migration (rural to urban, or between countries) and sociodemographic changes.10 11 These concepts may also be important to understand the varied characteristics of diabetes and obesity, including the observation that visceral adiposity despite a relatively low body mass index (BMI) is associated with poorer metabolic health in people of South Asian origin (the so-called ‘thin-fat’ phenotype12), that severe famine can lead to diabetes in underweight individuals,13 and the existence of a dual burden of overnutrition and undernutrition in transitional populations.14
The aetiology of developmental programming is poorly understood; however, recent epigenetic studies have shown differences in DNA methylation (an epigenetic mark) in association with periconceptual exposure to undernutrition15 and such processes may underlie the gene-environment interactions in the pathogenesis of complex disease16 and developmental programming.17 18 Most early epigenetic studies applied to developmental programming have been limited by lack of replication and/or the use of a candidate gene approach.17 More recent studies designed to identify metastable epialleles (MEs) or that use an epigenome-wide association study approach have been informative and identify methylation differences according to early gestation/periconceptual exposures.15 19–23 The next important step for these data is to replicate across studies in different populations, to identify whether they have a causal role with known programmed phenotypic outcomes such as diabetes and obesity, and whether they contribute to the high burden of these chronic diseases in South Asian populations.
Until now, most studies of developmental programming in South Asians are limited to single micronutrient deficiencies associated with specific dietary behaviours, limiting their wider application to other populations.24 Furthermore, there are no published studies that show programmed phenotypic outcomes in association with molecular aetiology, such as epigenetic differences, in South Asian populations. Developmental programming studies in The Gambia have identified multiple robust regions of epigenetic (DNA methylation) variation in children that are associated with differences in periconceptual nutrient availability, but until now have not found an association with a programmed phenotype. These so-called ‘metastable epialleles’ occur at regions of the epigenome established stochastically in the early embryo, maintained across different cell lineages, and show intraindividual and intertissue stability,19 25 and therefore any inter-individual variation detected at these loci could have significant biological and functional relevance, such as the risk of complex disease in later life. While other studies looking at methylation variants in fetal programming exist, we chose to investigate these MEs due to the robust nature in which they were first identified and characterisation in a contrasting ethnic population, meaning that replication in our cohort would be of potential significance.
With these background data, and their limitations in mind, we performed a historical cohort study of young adults exposed to famine in early life in Matlab, a rural area in the Chittagong division of Bangladesh, using both clinical and epigenetic outcomes. A severe monsoon in 1974 destroyed the majority of the annual rice crop and, in combination with inadequacies in the food distribution system, unemployment and lower purchasing power, a severe famine ensued.26 In Matlab, this famine was defined as occurring between July 1974 and June 1975, and its severity implicated deficiencies of multiple macronutrients and micronutrients in the diet of the local population during that time.27 Increased mortality of the general population in Matlab during and immediately after the famine was noted, as was neonatal and infant mortality.26 We hypothesised that young adults exposed to famine in developmental life would show evidence of programming towards diabetes and obesity, and that there may be varied effects according to timing of exposure, that is, gestational or postnatal exposure. Furthermore, we hypothesised that gestational famine exposure would be accompanied by epigenetic differences at specific metastable epialleles, previously identified to be sensitive to periconceptual nutrition availability in Gambian children.15
Methods
Participants were recruited across the Matlab area as part of a wider cross-sectional unselected pilot survey of men and women aged 25–64 years.28 Famine exposure windows were determined from birth records and using the famine start and end dates previously described. All individuals included in the survey were grouped according to exposure window resulting in the following: group A (n=81): postnatal famine exposure (born 1–2 years before the start of famine); group B (n=40): famine exposure in gestation (including at least 7 months of famine exposure during gestation) and group C (n=70): unexposed (conceived 6 months to 2 years after famine). Group (D) was also defined (n=112), incorporating older offspring exposed after 16 years of age for comparison to a background population. A randomised subsample of individuals from within groups A, B and C was included in the epigenetic study.
Clinical phenotyping was performed during a single study visit, incorporating measurement of BMI, anthropometry, 75 g WHO standard oral glucose tolerance tests (OGTT) and fasting lipids. Standard criteria were used to define diagnoses of metabolic syndrome,29 impaired fasting glycaemia, impaired glucose tolerance and type 2 diabetes,30 and abnormalities of BMI,31 using sex-specific and ethnicity-specific cut-offs where relevant. Standardised questionnaires were used to capture health status and sociodemographic factors. Phenotypic differences relevant to type 2 diabetes and obesity were compared between groups A, B and C were examined using three-way analysis of variance (ANOVA) tests for continuous variables and χ2 tests for categorical data.
A randomised subset of participants from groups A, B and C (n=148) were selected for the epigenetic study. Whole blood samples from these participants were stored at −80° until genomic DNA extraction was performed, using standard kits (Qiagen, UK). Randomly selected DNA aliquots from groups A, B and C were transported to the UK under a Material Transfer Agreement that involved training Bangladeshi scientists at the receiving UK institution. Genomic DNA samples with a nanodrop 260/280 ratio <1.75 and a 260/230 ratio <1.8 were discarded from further analysis. DNA was bisulfite-converted using the EZ-methylation kit (Zymo) and efficiency assessed in bioinformatics quality control checks.
The Illumina HumanMethylation 450BeadChip (Illumina, California, USA) was used to assay DNA methylation at CpG dinucleotides on a genome-wide scale, incorporating all designable RefSeq genes and enriched for CpG islands and regulatory regions. The experimental methods used have been previously described32 and use bisulfite conversion and Infinium bead chemistry33 to quantify methylation at CpG dinucleotides. Normalised, filtered and quality-checked quantitative methylation data were computed; β values (0–100% methylation) were derived from the analysis and data were analysed on a genome-wide scale using F-tests between groups A,B and C using Limma34 and a Benjamini and Hochberg false discovery rate control.35 We interrogated probe β values at probes within 16 MEs (VTRNA2-1, PAX8, PRDM9, HLA-DQB2, PLD6, near ZFP57, AKAP12, ATP5B, LRRC14B, SPG20, near BOLA, RBM46, ZFYVE28, EXD3, PARD6G, ZNF678 and ZFYVE28), ‘metastable epialleles’ that showed methylation variation in Gambian children according to nutritional conditions at conception.15 19 20 We also interrogated our data at sites of methylation variation identified in other genome-wide developmental programming studies using a non-MEs approach in the Dutch Winter Hunger and Barbados famine studies.21–23
Targeted bisulfite pyrosequencing was performed as validation in all experimental samples at the PAX8 metastable epialleles.15 Samples were assayed in duplicate and mean β values used. Primer sequences are available on request. Genomic DNA was converted using a Zymo EZ DNA Methylation kit (kit number D5001) according to the manufacturer's protocol. Bisulfite-converted DNA was recovered in 20 μL of elution buffer. Forward and reverse primers (one of them being biotinylated) flanking the region of interest were designed using the Pyromark Assay Design v2.0.1.15 software and used with Platinum Taq DNA Polymerase to amplify 20 ng of BS-converted DNA. Quantitative short read sequencing of amplified BS-DNA was performed on the pyrosequencer PSQ96MD system using the PyroGold SQA Reagent Kit and analysed with Q-CpG software (V.1.0.9, Pyrosequencing AB). β values from both targeted bisulfite pyrosequencing and array probe interrogation were compared using three-way ANOVAs and across relevant genomic features (eg, a gene's promoter) annotated by a gene browser (http://www.ensembl.org).
Results
Clinical data
Clinical data of the participants, including sex, wealth index, marital status, occupation, educational status, smoking and phenotypic measures, are presented in online Supplementary file 1, table 1. BMI was categorised into underweight (BMI <18.5 kg/m2), normal weight (BMI 18.5–22.9 kg/m2) and overweight and obese (BMI ≥23 kg/m2) using the WHO reference criteria for Asian populations.31 Age differences were present between groups due to the study design. Ordinal regression analysis showed that BMI categorisation was not affected by putative confounding variables (age at follow-up, sex, wealth status, marital status, occupation, educational attainment, smoking or arsenic exposure) (pseudo R2 0.053, p=0.34). Significant differences (Proportional odds model, p=0.039) were identified between exposure groups according to weight category: an excess of underweight individuals was identified in those exposed during gestation (group B) (48%) compared to postnatal exposed (group A) (32%) and unexposed (group C) (30%); greater numbers of overweight offspring (26%) were identified in the postnatal exposed group compared to gestational exposed (8%) or unexposed (14%) (see table 1). Comparison of these data with the ‘older’ group of individuals (mean age 48 years, exposed to famine after age 16 years) suggests that both findings are disproportionate to the prevalence of underweight and overweight in the background (and older) population. Data from this older population also highlight the burden of hyperglycaemic disorders (type 2 diabetes, impaired glucose tolerance and impaired fasting glycaemia) which has a 31% prevalence in this older group (mean age of 48 years) and presents a useful comparison to the younger individuals in groups A, B and C. There were no differences in fasting lipid measures between groups (data not shown).
Table 1.
Age, body mass, weight circumference and glucose parameters from offspring exposed postnatally, in utero and unexposed to famine, and statistical comparisons of groups A, B and C (proportional odds model for weight as an ordered categorical variable, and ANOVA for continuous variables)
| Group | Group A | Group B | Group C | Group D | ||
|---|---|---|---|---|---|---|
| Exposure | Postnatal exposed | In utero exposed | Unexposed | Older | ||
| n | 81 | 68 | 70 | Statistical tests (groups A,B,C) | 112 | |
| Age (years) | Mean | 31 | 30 | 28 | ANOVA p<0.0001 | 48 |
| SD | 0.4 | 0.3 | 0.3 | 0.7 | ||
| BMI (kg/m2) | Mean | 20.3 | 19.4 | 20.0 | ns | 20.6 |
| SD | 3.1 | 2.9 | 2.6 | 3.3 | ||
| BMI category | Underweight n (%) | 26 (32) | 33 (49) | 21 (30) | Proportional odds model df=2, deviance ratio=3.25, p=0.039 | 34 (30) |
| Normal weight n (%) | 34 (42) | 26 (38) | 39 (56) | 45 (40) | ||
| Overweight n (%) | 21 (26) | 9 (13) | 10 (14) | 33 (30) | ||
| Waist circumference | Normal | 71 (88) | 63 (93) | 65 (93) | ns | 89 (79) |
| High (M≥90 cm; F≥80 cm) | 10 (12) | 5 (7) | 5 (7) | 23 (21) | ||
| 0 min glucose (mmol/l) | Mean | 4.8 | 4.8 | 4.7 | ns | 5.3 |
| SD | 0.5 | 0.5 | 0.6 | 1.9 | ||
| 120 min glucose (mmol/l) | Mean | 5.2 | 5.8 | 5.6 | ns | 6.4 |
| SD | 1.4 | 1.6 | 2.0 | 3.7 | ||
| IFG/IGT/T2D n (%) | 0=no | 74 (81) | 59 (87) | 60 (86) | ns | 77 (69) |
| 1=yes | 7 (9) | 9 (13) | 10 (14) | 35 (31) |
Non-significant statistical comparisons (p≥0.05) are marked ‘ns’. Data on older offspring exposed to famine after the age of 16 years are presented (in italics) for reference but are not included in statistical testing.
ANOVA, analysis of variance; BMI, body mass index; IFG, impaired fasting glucose IGT, impaired glucose tolerance; T2D, type 2 diabetes.
There were no significant differences in mean blood glucose (0 min and 120 min post-OGTT) or rates of hyperglycaemic disorders (type 2 diabetes, impaired fasting glucose, impaired glucose tolerance) according to the three famine exposure groups overall (table 1). However, after stratification of each exposure group by BMI category, those exposed in gestation who were underweight at the time of sampling had a significantly higher mean 120 min glucose (5.9 mmol/L) compared to underweight individuals exposed postnatally (4.8 mmol/L) or unexposed (4.8 mmol) (ANOVA p<0.03) (see table 2 and figure 1). There were no significant differences in mean 120 min glucose between exposure groups in normal or overweight individuals (table 3).
Table 2.
0 min glucose (as part of an oral glucose tolerance test) according to exposure category and stratified by body weight category
| 0 min glucose (mmol/L) |
|||||
|---|---|---|---|---|---|
| Group A | Group B | Group C | Group D | ||
| Postnatal exposed | Gestational exposed | Unexposed | Statistical tests | Older | |
| Underweight | 4.9 (n=26) | 4.7 (n=33) | 4.6 (n=21) | ns | 4.8 (n=34) |
| Normal weight | 4.7 (n=34) | 4.9 (n=26) | 4.7 (n=39) | ns | 5.3 (n=56) |
| Overweight | 4.7 (n=21) | 4.8 (n=9) | 4.8 (n=10) | ns | 6.1 (n=22) |
Sample size per subcategory is noted (n=). Statistical testing performed on groups A, B and C only. Group D is shown for comparison only.
ns, non-significant.
Figure 1.
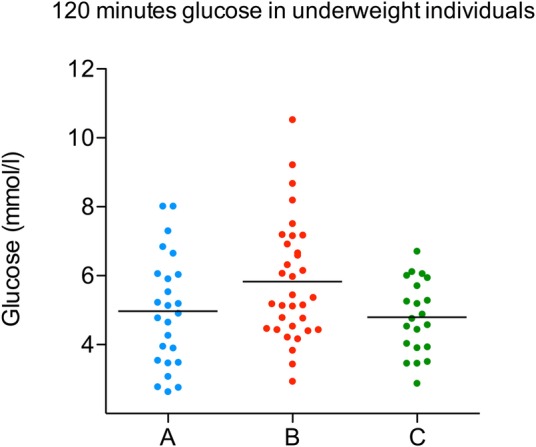
Distribution of 120 min glucose values in underweight individuals in groups A (postnatal exposed), B (gestational exposed) and C (unexposed).
Table 3.
120 min glucose (as part of an oral glucose tolerance test) according to exposure category and stratified by body weight category
| 120 min glucose (mmol/L) |
|||||
|---|---|---|---|---|---|
| Group A | Group B | Group C | Group D | ||
| Postnatal exposed | In utero exposed | Unexposed | Statistical tests | Older | |
| Underweight | 4.8 (n=26) | 5.8 (n=31) | 4.8 (n=21) | ANOVA p<0.02 | 4.9 (n=34) |
| Normal weight | 5.3 (n=34) | 5.6 (n=26) | 5.9 (n=39) | ns | 6.4 (n=56) |
| Overweight | 5.5 (n=21) | 5.9 (n=9) | 5.8 (n=10) | ns | 7.9 (n=22) |
Sample size per subcategory is noted (n=). Statistical testing performed on groups A, B and C only. Group D is shown for comparison only.
ANOVA, analysis of variance; ns, non-significant.
Genome-wide DNA methylation analysis
We generated high quality single CpG resolution methylation values from 428 382 probes on the Illumina HumanMethylation450 beadchip array (‘450k array’) for 148 samples from groups A, B and C. After removing samples (n=5) that had failed quality control checks, we analysed filtered and normalised β values from groups A (n=49), B (n=40) and C (n=54) in a three-way comparison and two-way analysis (combining groups A+C as a ‘control’ group to the gestationally exposed group B) using F-tests. Neither analysis nor application of a latent variable approach yielded methylation differences that held up to correction for multiple testing using a false discovery rate (adjusted p<0.05), and we therefore did not proceed with further genome-wide analysis. Randomisation eliminated any groupwise bias in the bisulfite conversion efficiency or array batch. A standard reference-free correction for cellular differences in whole blood was performed36 and showed no strong effects driven by cell composition between the three groups.
Targeted DNA methylation analysis
We used our 450k array data set to assess quantitative DNA methylation as β values (0–1, unmethylated to fully methylated) at probes overlying the MEs previously described. All other array probes within these genes were interrogated to assess regional patterns of methylation. We performed comparative analysis of mean methylation across samples from groups A (n=30), B (n=13) and C (n=18) using samples in which bisulfite conversion efficiency >95% had been achieved. Methylation differences were identified at 6 of the 16 previously reported MEs (see figure 2), a result significantly greater than would be expected by chance (p<0.05). At these metastable epialleles, the predominant methylation difference was driven by group B (gestationally exposed) compared to either unexposed and/or postnatally exposed. Comparison using non-parametric testing and with/without the inclusion of single nucleotide polymorphism probes did not affect the results. Furthermore, analysis using z-scores of mean methylation across all 16 MEs (to reduce the interepiallele variance in methylation) showed significant and relative hypomethylation in group B (mean z-score −0.24), compared to groups A and C (mean z-scores −0.14 and −0.15, respectively) (3-way ANOVA p value 0.0003, Bonferroni multiple comparison test significant between groups A vs B and B vs C). These findings are consistent with the findings of Dominguez-Salasz et al,19 and Silver et al,20 who showed hypomethylation in Gambian offspring conceived during the rainy season (ie, during nutritional depletion) and hypothesise that this is due to reduced methyl donor availability. Interestingly, PAX8 showed relative hypermethylation in group B compared to groups A and C, but this did not affect the pattern of mean hypomethylation across all epialleles. Methylation data and probe coordinates from all 16 MEs are presented in online supplementary file 1, tables 2 and 3. There was no significant replication of the methylation differences identified in the recent genome-wide Dutch Winter Hunger or Barbados famine studies (see online supplementary file 2).
Figure 2.

Box and whisker plots showing β values at 450k probes located at/near metastable epialleles. Boxes (median, 25th and 75th quartiles) show β values from groups A (blue), B (red) and C (green). Probe labels along the X axis in bold denote those probes overlying, or within 100 bp, of the target metastable epialleles (MEs) (Dominguez-Salazs, 2014; Silver, 2015). Three-way group comparisons (ANOVA) showing differences reaching statistical significance (*p<0.05, **p<0.005, ***p<0.001, ****p<0.0001). Mean methylation z-scores across each MEs in the ‘all MEs’ plot are combined to reduce interepiallele variance. ANOVA, analysis of variance; MEs, metastable epialleles.
bmjopen-2016-011768supp_1.pdf (320.8KB, pdf)
bmjopen-2016-011768supp_2.pdf (290.4KB, pdf)
Quantitative methylation values derived from the 450k array at PAX8 were validated against a BS-pyrosequencing amplicon targeted to 8 CpG sites overlying and adjacent to the metastable epiallele. BS-pyrosequencing was performed across a wider sample number (due to the higher quality bisulfite conversion) and was highly correlated (R2=0.92).
Discussion
In this cross-sectional study of a rural Bangladeshi population, we have identified diabetes-related phenotypes in young adults exposed to famine in early developmental life. These phenotypes were evident only in those individuals remaining underweight (BMI <18.5 kg/m2) at the time of this follow-up study, when aged 29–31 years. These data add to existing studies suggesting that early life nutritional deficits ‘programme’ offspring towards metabolic disease in later life.4 5 24 Our study adds to existing studies by a clear definition of exposure windows, including gestational exposure, as well as a window of postnatal famine exposure starting at <2 years of age. This study is the first that follows up famine-exposed individuals in a South Asian population and that incorporates the study of potential epigenetic mechanisms underlying the double burden of disease.14
We identified a 30–32% prevalence of underweight across postnatal exposed, unexposed and older experimental groups, suggesting a non-age-dependent background prevalence. In contrast, we observe an excess prevalence of underweight (49%) in young adults exposed to famine in utero, and this appears to be independent of confounding sociodemographic factors. Those adults exposed to famine during both conception and gestation who remain underweight have a higher mean glucose at 120 min postoral glucose challenge, compared to those postnatally exposed or unexposed. The finding of impaired glucose tolerance in the underweight exposed in gestation will benefit from replication in future studies and may suggest a programmed insulin resistance phenotype previously described by others in similar models,2 4 and supports the concept of malnutrition-related diabetes and the ‘thin-fat phenotype’.12 37 We also observed that overweight and obesity were twice as common in young adults who had been exposed to famine during postnatal life (<2 years old), compared to those exposed in utero or unexposed. The varied body weight phenotype associated with the in utero and postnatal exposure windows suggests a variable influence on developing organ systems and behavioural systems, and supports our inclusion of a distinct postnatal exposure group to investigate the effects of postnatal programming on appetite mechanisms.38 Other studies include postnatally exposed individuals as ‘unexposed’ controls,17 18 but our data suggest the importance of considering this exposure window as a separate experimental group with that could be susceptible to different epigenetic and phenotypic variation, compared to in utero exposure. Animal and human studies that focus on postnatal life suggest that ‘catch-up growth’ in the first 2 years of life following in utero growth restriction is associated with childhood obesity.39 It is important to note that famine exposure at any age is likely to be followed by a period of rapid growth acceleration due to sudden nutritional repletion as famine conditions were reversed. It is not possible to tell from this, or other studies, whether it is the growth restriction, acceleration or timing of either that is the determinant of future metabolic disease programming.
Despite strong clinical and epidemiological evidence for fetal programming, there is little understanding of its molecular basis. Current epigenetic studies in this context are limited by methodological issues, lack of replication and validation, use of surrogate tissues and inability to prove functional or causal effects on phenotype. We sought to improve on these limitations with a carefully designed study during different exposure windows and by replicating and validating our data across technological platforms. Our genome-wide, discovery-based approach was limited by a small sample size. We were unable to control for false discovery in the context of multiple hypothesis testing and were therefore unable to produce robust findings with this approach. However, we investigated whether the MEs identified from rigorous epigenetic studies applied to Gambian children exposed to periconceptual nutritional deficiency15 were also differentially methylated in Bangladeshi adults. We studied the 16 previously identified MEs using data from our 450k arrays and identified methylation differences at 6 of them. These MEs showed relative hypomethylation in association with gestational famine exposure, consistent with the observation of hypomethylation at these regions in periconceptually exposed Gambian children. Interestingly, the MEs at PAX8 and near BOLA showed relative hypermethylation in those exposed during gestation and future studies will need to define more precise exposure windows to elucidate whether there are variable effects according to more detailed windows of exposure or the frequency and characteristics of the famine itself. We note that all historical cohort and epidemiological studies of famine conditions have the potential to be limited by variable exposure and susceptibility to the conditions of famine on an individual level and this could alter the molecular read-out. We validated our 450k methylation data at PAX8 using a bisulfite-pyrosequencing assay and found both platforms to correlate strongly. The design of the 450k array, with probes designed to multiple CpG sites in most genes, allowed us to interrogate regional methylation and we showed spreading patterns of methylation variation around the metastable epialleles. PAX8 is a widely expressed transcription factor that is known to have multiple roles in thyroid cell differentiation and function via transcriptional regulation of a wide gene network.40 In providing evidence of methylation variation at six MEs in Matlab offspring, we are confident that these epigenetic marks of exposure are unaffected by age at sampling, ethnicity or geographical setting. These findings lend support to the use of whole blood as a means of detecting functionally relevant, robustly identified epigenetic variants, such as metastable epialleles, that might have been set down in early development prior to separation of the three germ layers, or that are stable across tissues. Our lack of replication of the top hits identified in the Dutch Hunger Winter and Barbados famine studies may be due to differences in study design, ethnicity or lack of power, and highlight the challenges of replicating small methylation variants from association-based studies.
There are limitations of our historical cohort study. First, the retrospective analysis of cohort data is unable to elucidate causation and, despite high participation rates in the study, there may be selection bias, for example, favouring a ‘survivor effect’. Second, our study includes only small numbers of individuals and validation of both phenotypic and epigenetic outcomes in larger numbers are now planned to allow multivariate analysis and sex-specificity of outcomes. The sample size also limited our ability to detect epigenome-wide differences in DNA methylation that withheld correction for multiple testing. Despite these limitations, our study provides additional important proof-of-concept in support of fetal programming hypotheses, adds to the current literature which relates either to specific micronutrient deficiencies, or, in the case of other famine-based studies, does not show association of both phenotypic and epigenetic outcomes. Finally, we add important insight into the populations at high risk of diabetes and obesity and the notion of the ‘thin-fat’ phenotype in this Bangladeshi group that have been developmentally programmed and are at high risk of diabetes even if underweight.
In conclusion, we have found clinical evidence of developmental programming towards hyperglycaemia in a cohort of underweight young adult Bangladeshis exposed to famine during gestation and postnatal life. We have replicated DNA methylation differences at MEs described in an independent study in those offspring exposed to famine during gestation. Furthermore, we suggest that postnatal exposure to famine may be an important window of exposure to include in this type of study. Our epigenomic study was underpowered to identify new methylation variants using a hypothesis-free approach. Our study has overcome some of the concerns raised by many epigenetic studies, namely lack of reproducibility and external replication. However, larger studies are required to overcome false discovery in epigenomic studies and technical variation between platforms and this data set provides important proof-of-principle and a source of data for future meta-analysis or replication studies. Our findings also highlight the importance of studying the varied clinical characteristics of people at risk of diabetes, and the contribution of different aetiological factors, such as developmental origins, ethnicity and sociodemographic factors, is crucial to understanding the complex basis of the disease and its increasing global burden. Future studies should also incorporate longitudinal sampling to examine the progression of phenotypes with age, elucidate the stability of the MEs and to add insight into whether they have an associative or causative role. The identification of MEs associated with developmental programming may offer a useful molecular signature of early life influences associated with an increased risk of diabetes. Future studies should investigate whether the findings of developmental programming, via an extreme early life exposure such as famine, can be generalised to a wider population at risk of diabetes, for example, across generations or via less extreme insults. A combined approach of detailed clinical and molecular studies may help to improve diabetes risk prediction in populations undergoing transition, and could help define windows of susceptibility and/or reversibility with which to focus and tailor intervention.
Acknowledgments
The authors are grateful to the population of Matlab and its villages for their participation and assistance in this study. The authors also acknowledge the input of the Barts and the London Genome Centre in performing array hybridisation and pyrosequencing. Brian Shine and Stephen Senn gave valuable contributions to statistical analysis. The authors would like to thank the reviewers of this manuscript for their detailed and constructive contributions.
Footnotes
Twitter: Follow Sarah Finer at @Sarah_Finer
Contributors: DA, GAH and SF conceived and designed the study. SP and DA recruited to and implemented the clinical study. SF and SI transferred samples from ICDDR,B to London, UK and performed DNA extraction and quality control checks. SF, SI, BWO and MS processed DNA for 450k analysis and bisulfite processing. SF analysed the clinical data with help from DA and GAH. RL and CM performed bioinformatics analysis with input from SF, VR and GAH. The manuscript was written by SF with help from BWO, GAH, SI, RL and DA.
Funding: Medical Research Council (Clinical Research Training Fellowship; reference number G0800441) and ICDDR,B.
Competing interests: None declared.
Ethics approval: Ethical approval was obtained via standard institutional procedure (ICDDR,B) ethics review board, and peer review of study protocol at QMUL.
Provenance and peer review: Not commissioned; externally peer reviewed.
Data sharing statement: Extra data can be accessed via the Dryad data repository at http://datadryad.org/ with the doi:10.5061/dryad.k67kf.
References
- 1.Lozano R, Naghavi M, Foreman K et al. Global and regional mortality from 235 causes of death for 20 age groups in 1990 and 2010: a systematic analysis for the Global Burden of Disease Study 2010. Lancet 2013;380:2095–128. 10.1016/S0140-6736(12)61728-0 [DOI] [PMC free article] [PubMed] [Google Scholar]
- 2.Hales CN, Barker DJ, Clark PM et al. Fetal and infant growth and impaired glucose tolerance at age 64. BMJ 1991;303:1019–22. 10.1136/bmj.303.6809.1019 [DOI] [PMC free article] [PubMed] [Google Scholar]
- 3.Manolio TA, Collins FS, Cox NJ et al. Finding the missing heritability of complex diseases. Nature 2009;461:747–53. 10.1038/nature08494 [DOI] [PMC free article] [PubMed] [Google Scholar]
- 4.Ravelli AC, van der Meulen JH, Michels RP et al. Glucose tolerance in adults after prenatal exposure to famine. Lancet 1998;351:173–7. 10.1016/S0140-6736(97)07244-9 [DOI] [PubMed] [Google Scholar]
- 5.Li Y, He Y, Qi L et al. Exposure to the Chinese famine in early life and the risk of hyperglycemia and type 2 diabetes in adulthood. Diabetes 2010;59:2400–6. 10.2337/db10-0385 [DOI] [PMC free article] [PubMed] [Google Scholar]
- 6.Hult M, Tornhammar P, Ueda P et al. Hypertension, diabetes and overweight: looming legacies of the Biafran famine. PLoS ONE 2010;5:e13582 10.1371/journal.pone.0013582 [DOI] [PMC free article] [PubMed] [Google Scholar]
- 7.Thurner S, Klimek P, Szell M et al. Quantification of excess risk for diabetes for those born in times of hunger, in an entire population of a nation, across a century. Proc Natl Acad Sci USA 2013;110:4703–7. 10.1073/pnas.1215626110 [DOI] [PMC free article] [PubMed] [Google Scholar]
- 8.Martin-Gronert MS, Ozanne SE. Mechanisms linking suboptimal early nutrition and increased risk of type 2 diabetes and obesity. J Nutr 2010;140:662–6. 10.3945/jn.109.111237 [DOI] [PubMed] [Google Scholar]
- 9.Wang N, Wang X, Li Q et al. The famine exposure in early life and metabolic syndrome in adulthood. Clin Nutr. In press. 10.1016/j.clnu.2015.11.010 10.1016/j.clnu.2015.11.010 [DOI] [PubMed] [Google Scholar]
- 10.Neel JV. Diabetes mellitus: a “thrifty” genotype rendered detrimental by “progress”? Am J Hum Genet 1962;14:353–62. [PMC free article] [PubMed] [Google Scholar]
- 11.Hales CN, Barker DJ. Type 2 (non-insulin-dependent) diabetes mellitus: the thrifty phenotype hypothesis. Diabetologia 1992;35:595–601. 10.1007/BF00400248 [DOI] [PubMed] [Google Scholar]
- 12.Yajnik CS, Fall CHD, Coyaji KJ et al. Neonatal anthropometry: the thin-fat Indian baby. The Pune Maternal Nutrition Study. Int J Obes Relat Metab Disord 2003;27:173–80. 10.1038/sj.ijo.802219 [DOI] [PubMed] [Google Scholar]
- 13.Abu-Bakare A, Taylor R, Gill GV et al. Tropical or malnutrition-related diabetes: a real syndrome? Lancet 1986;1:1135–8. 10.1016/S0140-6736(86)91846-5 [DOI] [PubMed] [Google Scholar]
- 14.Doak CM, Adair LS, Bentley M et al. The dual burden household and the nutrition transition paradox. Int J Obes 2005;29:129–36. 10.1038/sj.ijo.0802824 [DOI] [PubMed] [Google Scholar]
- 15.Waterland RA, Kellermayer R, Laritsky E et al. Season of conception in rural Gambia affects DNA methylation at putative human metastable epialleles. PLoS Genet 2010;6:e1001252 10.1371/journal.pgen.1001252 [DOI] [PMC free article] [PubMed] [Google Scholar]
- 16.Dick KJ, Nelson CP, Tsaprouni L et al. DNA methylation and body-mass index: a genome-wide analysis. Lancet 2014;383:1990–8. 10.1016/S0140-6736(13)62674-4 [DOI] [PubMed] [Google Scholar]
- 17.Heijmans BT, Tobi EW, Stein AD et al. Persistent epigenetic differences associated with prenatal exposure to famine in humans. Proc Natl Acad Sci USA 2008;105:17046–9. 10.1073/pnas.0806560105 [DOI] [PMC free article] [PubMed] [Google Scholar]
- 18.Tobi EW, Lumey LH, Talens RP et al. DNA methylation differences after exposure to prenatal famine are common and timing- and sex-specific. Hum Mol Genet 2009;18:4046–53. 10.1093/hmg/ddp353 [DOI] [PMC free article] [PubMed] [Google Scholar]
- 19.Dominguez-Salas P, Moore SE, Baker MS et al. Maternal nutrition at conception modulates DNA methylation of human metastable epialleles. Nat Commun 2014;5:3746 10.1038/ncomms4746 [DOI] [PMC free article] [PubMed] [Google Scholar]
- 20.Silver MJ, Kessler NJ, Hennig BJ et al. Independent genomewide screens identify the tumor suppressor VTRNA2-1 as a human epiallele responsive to periconceptional environment. Genome Biol 2015;16:118 10.1186/s13059-015-0660-y [DOI] [PMC free article] [PubMed] [Google Scholar]
- 21.Tobi EW, Goeman JJ, Monajemi R et al. DNA methylation signatures link prenatal famine exposure to growth and metabolism. Nat Commun 2014;5:5592 10.1038/ncomms6592 [DOI] [PMC free article] [PubMed] [Google Scholar]
- 22.Tobi EW, Slieker RC, Stein AD et al. Early gestation as the critical time-window for changes in the prenatal environment to affect the adult human blood methylome. Int J Epidemiol 2015;44:1211–23. 10.1093/ije/dyv043 [DOI] [PMC free article] [PubMed] [Google Scholar]
- 23.Peter CJ, Fischer LK, Kundakovic M et al. DNA methylation signatures of early childhood malnutrition associated with impairments in attention and cognition. Biol Psychiatry 2016;80:765–774. 10.1016/j.biopsych.2016.03.2100 [DOI] [PMC free article] [PubMed] [Google Scholar]
- 24.Yajnik CS, Deshpande SS, Jackson AA et al. Vitamin B12 and folate concentrations during pregnancy and insulin resistance in the offspring: the Pune Maternal Nutrition Study. Diabetologia 2008;51:29–38. 10.1007/s00125-007-0793-y [DOI] [PMC free article] [PubMed] [Google Scholar]
- 25.Finer S, Holland ML, Nanty L et al. The hunt for the epiallele. Environ Mol Mutagen 2011;52:1–11. 10.1002/em.20590 [DOI] [PubMed] [Google Scholar]
- 26.Razzaque A, Alam N, Wai L et al. Sustained effects of the 1974–5 famine on infant and child mortality in a rural area of Bangladesh. Popul. Stud. 1990;44:145–54. 10.1080/0032472031000144426 [DOI] [PubMed] [Google Scholar]
- 27.Alamgir M. Famine in South Asia: political economy of mass starvation. Cambridge MA, USA: Oelgeschlager, Gunn & Hain, 1980. [Google Scholar]
- 28.Razzaque A, Nahar L, Abu Haider Mohammad Golam Mustafa et al. Sociodemographic differentials of selected noncommunicable diseases risk factors among adults in Matlab, Bangladesh: findings from a WHO STEPS survey. Asia Pac J Public Health 2011;23:183–91. 10.1177/1010539510392743 [DOI] [PubMed] [Google Scholar]
- 29.Alberti KGMM, Eckel RH, Grundy SM et al. Harmonizing the metabolic syndrome: a joint interim statement of the International Diabetes Federation Task Force on Epidemiology and Prevention; National Heart, Lung, and Blood Institute; American Heart Association; World Heart Federation; International Atherosclerosis Society; and International Association for the Study of Obesity. Circulation 2009;120:1640–5. 10.1161/CIRCULATIONAHA.109.192644 [DOI] [PubMed] [Google Scholar]
- 30.The Expert Committee on the Diagnosis and Classification of Diabetes Mellitus*. Follow-up Report on the Diagnosis of Diabetes Mellitus. Diabetes Care 2003;26:3160–7. 10.2337/diacare.26.11.3160 [DOI] [PubMed] [Google Scholar]
- 31.WHO Expert Consultation. Appropriate body-mass index for Asian populations and its implications for policy and intervention strategies. Lancet 2004;363:157–63. 10.1016/S0140-6736(03)15268-3 [DOI] [PubMed] [Google Scholar]
- 32.Finer S, Mathews C, Lowe R et al. Maternal gestational diabetes is associated with genome-wide DNA methylation variation in placenta and cord blood of exposed offspring. Hum Mol Genet 2015;24:3021–9. 10.1093/hmg/ddv013 [DOI] [PubMed] [Google Scholar]
- 33.Bibikova M, Barnes B, Tsan C et al. High density DNA methylation array with single CpG site resolution. Genomics 2011;98:288–95. 10.1016/j.ygeno.2011.07.007 [DOI] [PubMed] [Google Scholar]
- 34.Smyth G. Limma: linear models for microarray data. In Bioinformatics and computational biology solutions using R and bioconductor. New York: Springer, 2005:397–420. [Google Scholar]
- 35.Benjamini Y, Drai D, Elmer G et al. Controlling the false discovery rate in behavior genetics research. Behav Brain Res 2001;125:279–84. 10.1016/S0166-4328(01)00297-2 [DOI] [PubMed] [Google Scholar]
- 36.Houseman EA, Accomando WP, Koestler DC et al. DNA methylation arrays as surrogate measures of cell mixture distribution. BMC Bioinformatics 2012;13:86 10.1186/1471-2105-13-86 [DOI] [PMC free article] [PubMed] [Google Scholar]
- 37.Rao RH. Is tropical pancreatic diabetes malnutrition related? Diabetes Care 1993;16:941–5. 10.2337/diacare.16.6.941 [DOI] [PubMed] [Google Scholar]
- 38.Bouret S, Levin BE, Ozanne SE. Gene-environment interactions controlling energy and glucose homeostasis and the developmental origins of obesity. Physiol Rev 2015;95:47–82. 10.1152/physrev.00007.2014 [DOI] [PMC free article] [PubMed] [Google Scholar]
- 39.Ong KK, Ahmed ML, Emmett PM et al. Association between postnatal catch-up growth and obesity in childhood: prospective cohort study. BMJ 2000;320:967–71. 10.1136/bmj.320.7240.967 [DOI] [PMC free article] [PubMed] [Google Scholar]
- 40.Ruiz-Llorente S, Carrillo Santa de Pau E, Sastre-Perona A et al. Genome-wide analysis of Pax8 binding provides new insights into thyroid functions. BMC Genomics 2012;13:147 10.1186/1471-2164-13-147 [DOI] [PMC free article] [PubMed] [Google Scholar]
Associated Data
This section collects any data citations, data availability statements, or supplementary materials included in this article.
Supplementary Materials
bmjopen-2016-011768supp_1.pdf (320.8KB, pdf)
bmjopen-2016-011768supp_2.pdf (290.4KB, pdf)