Summary
Medulloblastoma is a highly malignant paediatric brain tumour, often inflicting devastating consequences on the developing child. Genomic studies have revealed four distinct molecular subgroups with divergent biology and clinical behaviour. An understanding of the regulatory circuitry governing the transcriptional landscapes of medulloblastoma subgroups, and how this relates to their respective developmental origins, is lacking. Using H3K27ac and BRD4 ChIP-Seq, coupled with tissue-matched DNA methylation and transcriptome data, we describe the active cis-regulatory landscape across 28 primary medulloblastoma specimens. Analysis of differentially regulated enhancers and super-enhancers reinforced inter-subgroup heterogeneity and revealed novel, clinically relevant insights into medulloblastoma biology. Computational reconstruction of core regulatory circuitry identified a master set of transcription factors, validated by ChIP-Seq, that are responsible for subgroup divergence and implicate candidate cells-of-origin for Group 4. Our integrated analysis of enhancer elements in a large series of primary tumour samples reveals insights into cis-regulatory architecture, unrecognized dependencies, and cellular origins.
Introduction
Medulloblastoma is a highly malignant paediatric brain tumour classified into four biologically and clinically distinct molecular subgroups1. The present clinical approach to medulloblastoma involves maximal safe surgical resection, cytotoxic chemotherapy, and cranio-spinal radiation, which together are associated with profound morbidity in the developing child, underscoring the need for new subgroup-specific therapeutic insights.
Transcriptional diversity amongst WNT, SHH, Group 3, and Group 4 subgroup medulloblastomas is partially explained by active and discriminatory signaling pathways, such as the Wingless/WNT and Sonic hedgehog/SHH developmental cascades inherent to WNT and SHH medulloblastomas, respectively. Somatically altered driver genes including MYC (Group 3), KDM6A (Group 4), GFI1/GFI1B (Group 3 and Group 4), and others contribute further to subgroup divergence2–4. Recurrent targeting of genes involved in chromatin modification has been the most consistent theme to emerge from recent next-generation sequencing (NGS) studies5, strongly suggesting deregulation of the epigenome as a critical step during medulloblastoma pathogenesis. However, this hypothesis has yet to be experimentally substantiated and knowledge pertaining to how the medulloblastoma epigenome influences subgroup-specific transcriptional programs remains in its infancy6.
Enhancers are cis-acting regulatory elements that recruit transcription factors (TFs) and chromatin-associated regulatory complexes, which together signal to RNA polymerase to regulate target gene expression7. Consortia such as ENCODE8,9 and Roadmap10 have extensively mapped enhancers, advancing our understanding of enhancer/gene regulation across a comprehensive spectrum of cell lines and tissues. These resources empower our understanding of the complex cartography of the human regulatory landscape, provide testable hypotheses regarding disease-risk association, contribute evolutionary inferences, and establish robust analytical techniques. To deeply characterize the active cis-regulatory circuitry of a single disease entity, here medulloblastoma, we performed high-resolution chromatin immunoprecipitation with sequencing (ChIP-Seq) for active enhancers (H3K27ac) in 28 primary tumour specimens and three established cell lines. Our approach to studying enhancers genome-wide in a large set of primary tissue samples led to a regulatory explanation for subgroup transcriptional diversity, previously unrecognized subgroup-specific dependencies, and firm insights into medulloblastoma cellular origins, in particular for the poorly characterized Group 3 and Group 4 subgroups.
Results
The medulloblastoma enhancer landscape
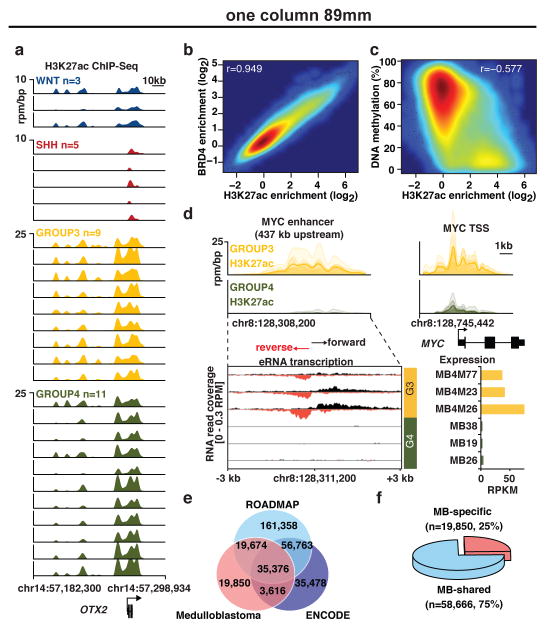
Recent large-scale efforts annotating active regulatory elements genome-wide in human tissues (e.g. through DNase I hypersensitivity, H3K27ac and BRD4 ChIP-Seq), have catalogued enhancers in immortalized or malignant cell lines and normal human tissues, often under-representing discrete disease entities8,10. For medulloblastoma, only a single long-term culture cell line (D721; first reported in 1997) is included amongst 125 cell types initially studied by ENCODE9. Further, cancer cell lines often exhibit drastic genomic and transcriptional divergence from their corresponding primary tumour tissues as exemplified in Non-Hodgkin’s lymphoma where our prior epigenomic analyses identified greater likeness between primary tumour samples and normal lymphoid tissues than between tumours and cell lines11. Given the apparent limitations of using cell lines to faithfully study the tumour epigenome, and the recognized subgroup-dependent heterogeneity of medulloblastoma, we collected a series of 28 treatment-naïve, fresh-frozen medulloblastoma specimens and profiled the active enhancer landscape by H3K27ac ChIP-Seq (Figure 1a; Extended Data Figure 1a–c).
Figure 1. The enhancer landscape of primary medulloblastoma.
(a) Highly active enhancers at the OTX2 locus across 28 primary medulloblastomas.
(b) H3K27ac versus BRD4 ChIP-Seq signals at medulloblastoma enhancers (n=78,516).
(c) H3K27ac ChIP-Seq signal versus DNA methylation (WGBS) at medulloblastoma enhancers (n=78,516).
(d) Group 3-specific eRNA expression (lower left) overlapping a Group 3-specific MYC enhancer (upper left) in a subset of medulloblastomas (n=6). MYC gene expression (RPKM) is also shown for the same cases (lower right).
(e, f) Overlap of medulloblastoma enhancers with ENCODE and Roadmap enhancers.
This cohort is inclusive of all four medulloblastoma subgroups (Supplemental Table S1; WNT, n=3, SHH, n=5, Group 3, n=9, Group 4, n=11) and includes three additional Group 3 cell lines (MED8A, D425, and HD-MB03). Using MACS12 to identify significantly enriched H3K27ac peaks, we inferred 78,516 enhancers, effectively saturating the medulloblastoma enhancer landscape (Extended Data Figure 1d). These regions of promoter distal H3K27ac enrichment mainly (~80%) covered introns and intergenic regions (Extended Data Figure 1e). Parallel ChIP-Seq was performed for Bromodomain Containing 4 (BRD4), an enhancer-associated transcriptional coactivator11,13, in 27/31 cases. Enrichment of H3K27ac and BRD4 ChIP-Seq signals strongly correlated at putative enhancer loci (Pearson correlation, r=0.949), further enforcing their active enhancer classification (Figure 1b)11,13. Likewise, H3K27ac peaks were strongly anti-correlated with DNA methylation (Pearson correlation, r=−0.577; Figure 1c) and showed a high degree of overlap with the active/poised enhancer H3K4me1 but not the repressive H3K27me3 histone marks (Extended Data Figure 1f). Finally, strand-specific RNA-Seq data generated from the same cohort detected short, unspliced, bidirectional RNA transcripts overlapping H3K27ac peaks (Figure 1d), in accordance with recently described enhancer RNAs (eRNAs)14. Active enhancers exhibited a modest statistical enrichment for overlap with focal amplifications and deletions identified in Group 3 and Group 44 (P=0.028 for amplifications, P=0.016 for deletions; Extended Data Figure 1g). Comparison of predicted medulloblastoma enhancers with those reported using analogous methods employed by the ENCODE and Roadmap Epigenomics Projects revealed 19,850 novel regulatory regions, indicative of potentially hindbrain- or medulloblastoma-specific enhancers in our dataset (Figure 1e, f). Primary medulloblastoma enhancer landscapes exhibited poor overlap and correlation with those generated from medulloblastoma cell lines (Extended Data Figure 1h, i), further emphasizing the importance of studying the epigenome in primary tumours.
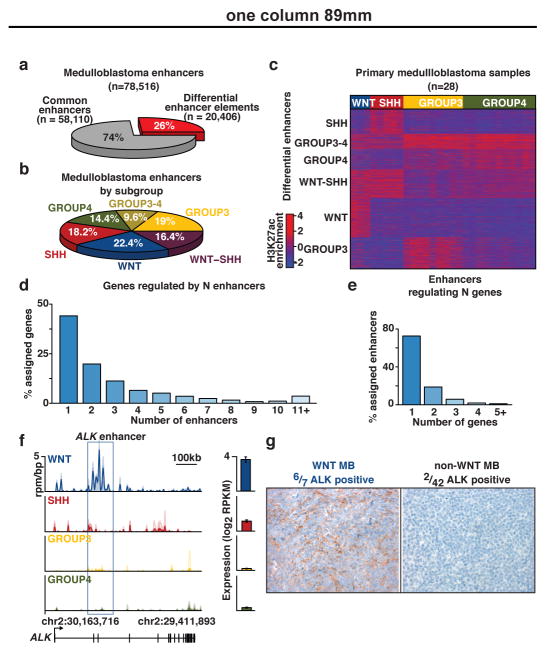
ANOVA identified sets of enhancers differing according to known molecular subgroup, revealing 20,406 differentially active enhancers (26% of all inferred enhancers; Figure 2a, b). The remaining 74% (n=58,110) displayed varied activity across subgroups, suggesting either ubiquitous activity of e.g. ‘housekeeping’ genes or a general role in medulloblastoma or cerebellar identity (Figure 2a; Supplemental Table S2). K-means clustering of differentially regulated enhancers delineated six distinct medulloblastoma enhancer classes, including one for each subgroup as well as WNT-SHH and Group 3-Group 4 shared classes (Figure 2b, c). Group 3 and Group 4 subgroups are known to exhibit some degree of transcriptional similarity15,16, consistent with the enhancer clustering results, whereas a common subset of shared enhancers between WNT and SHH subgroups was unexpected.
Figure 2. Differentially regulated enhancers in medulloblastoma subgroups.
(a) ANOVA classification of medulloblastoma enhancers.
(b) Distribution of differentially regulated enhancers among medulloblastoma enhancer classes.
(c) K-means clustering of differentially regulated medulloblastoma enhancers (n=20,406).
(d) Proportion of enhancer/gene assignments to N enhancers.
(e) Proportion of enhancer/gene assignments to N genes.
(f) WNT-specific enhancer activity (rpm/bp) and expression (log2 RPKM, n=140) of ALK. Error bars represent standard deviation (s.d.) of the mean.
(g) Immunohistochemical validation of ALK expression in WNT medulloblastoma patients (n=49).
Medulloblastoma enhancer/gene assignment
We next sought to assign enhancer elements to target genes, a process typically hindered by the majority of enhancer/promoter interactions occurring over extensive and highly variable genomic distances17. To overcome these challenges, we leveraged sample-matched RNA-Seq gene expression data to identify putative enhancer/gene interactions that are (i) contained within the same topologically associated domain (TAD18) and (ii) exhibit significant positive correlations between enhancer H3K27ac signal and gene expression (FDR <0.05, Extended Data Figure 2a–i). This approach assigned 8,775 enhancers (43% of all differential enhancers) to at least one protein-coding target gene (Supplemental Table S3). The majority (44%) of inferred target genes were assigned to a single enhancer, but in many cases, several enhancers were predicted to converge on the regulation of a single gene (Figure 2d). Likewise, 73% of enhancers were assigned to only a single gene target (Figure 2e). To validate the robustness of our methods, we used 4C-Seq19 to query Group 3-specific enhancer/promoter interactions for enhancers showing conserved activity in both primary Group 3 tumours and cell lines. This approach confirmed enhancer/promoter interactions for both TGFBR1 and SMAD9 in the Group 3 cell line HD-MB03, a low-passage line more faithful to primary Group 3 tumours than older models6,20 (Extended Data Figure 2j, k).
Medulloblastoma subgroup ‘signature’ genes have been extensively documented using various expression-profiling methods15,16. Enhancer/gene assignments derived from coupling H3K27ac ChIP-Seq with RNA-Seq produced a refined ‘lens’ for investigating subgroup-related diversity in medulloblastoma, implicating themes previously undisclosed through expression data alone. For example, enhancers regulating ALK, a receptor tyrosine kinase frequently altered in a variety human cancers21, were found to be highly active in the WNT subgroup and explained the largely WNT-specific expression pattern detected by RNA-Seq and confirmed by immunohistochemical staining of primary patient samples (n=49; P=1.35e-5, Fisher’s exact test; Figure 2f, g). Further investigations into the potential oncogenic role of ALK in WNT subgroup medulloblastoma are essential but rational given that ALK inhibitors are currently FDA approved for the treatment of NSCLC (i.e. crizotinib and ceritinib).
Rational target-based treatment options remain scarce for Group 3 and Group 4 subgroup patients necessitating additional biological insights to direct future mechanistic and translational research. Functional pathway analysis (see Supplementary Methods) performed on differential enhancer/gene target assignments identified enrichment of neuronal transcriptional regulators in Group 4 and thematic pathways associated with TGFβ signalling in Group 3 (Extended Data Figure 3a–c). Notably, we uncovered a ~450kb focal amplification at the ACVR2A locus in one Group 3 sample that encompassed both the gene and the upstream enhancer regions (Extended Data Figure 3d). In this sample, enhancers regulating TGFβ pathway components exhibited increased H3K27ac versus other Group 3 tumours (Extended Data Figure 3e). These data, combined with our prior observations that TGFβ receptor genes are recurrently amplified in Group 34, further suggest TGFβ signaling as a putative oncogenic driver in this subgroup.
Medulloblastoma subgroup super-enhancers
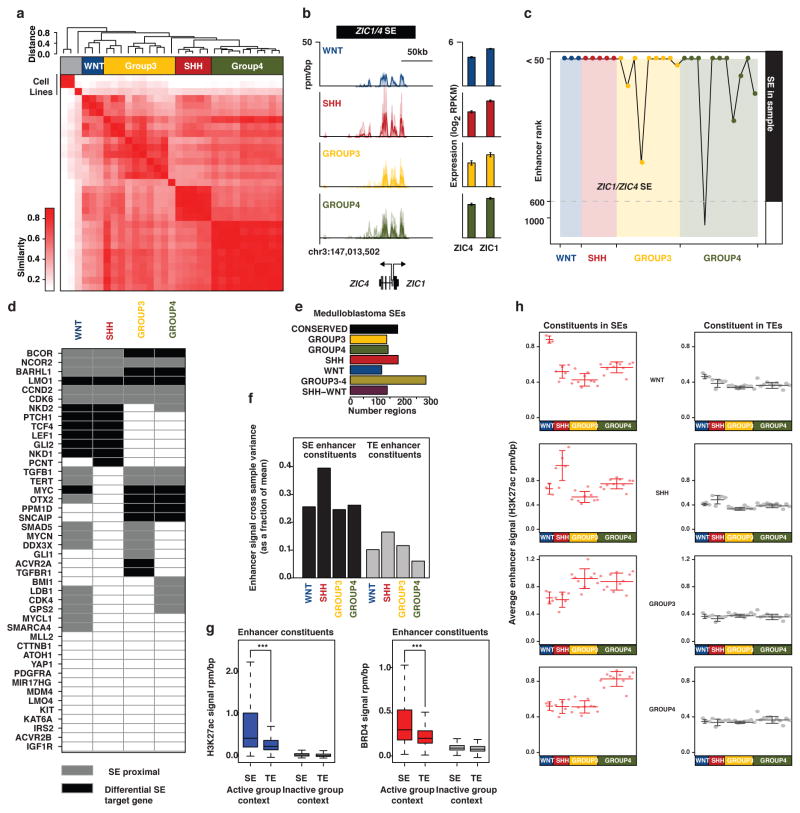
In multiple tumour types, super-enhancers (SEs), broad spatially co-localized enhancer domains22,23, have recently been shown to drive oncogenes, genes required for maintenance of tumour cell identity, and genes associated with cell type-specific functions. To determine whether SEs might play a role in characterizing subgroup-specific identity, we undertook a systematic mapping of SEs across all 28 medulloblastoma samples (see Supplementary Methods; Extended Data Figure 4a). Massive (>50kb) SE domains were identified at the cerebellar-specific TFs, ZIC1 and ZIC424 (Extended Data Figure 4b, c), and at ~70% of a queried set of established medulloblastoma driver genes and chromatin modifiers implicated in cancer, including GLI2, MYC, OTX2 and others4 (Extended Data Figure 4d).
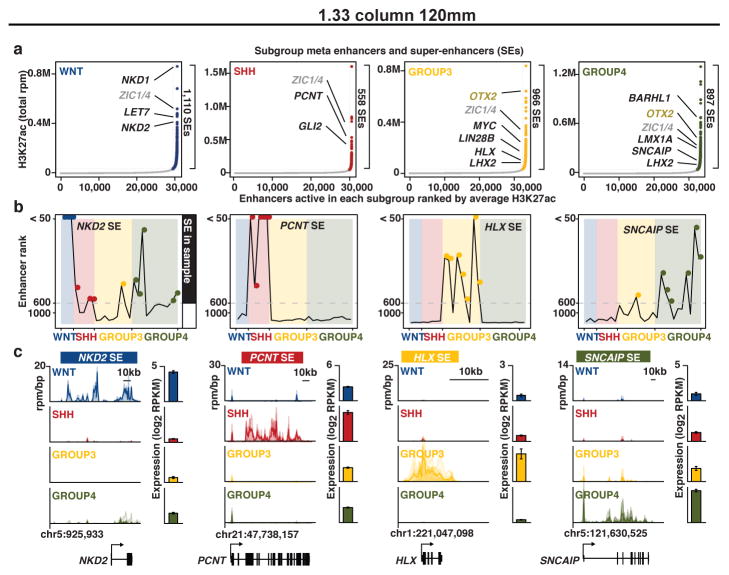
To identify subgroup-specific SEs, we took the union of all enhancer regions in a given subgroup and ranked them by average H3K27ac enrichment across all samples in that subgroup23, resulting in ~3,000 distinct SE containing loci (~600–1,100 SEs/subgroup; Figure 3a; Extended Data Figure 4e; Supplemental Table S4). Compared to typical enhancers, SEs showed higher occupancy of BRD4 and greater enhancer signal dynamic range between subgroups (Extended Data Figure 4f–h). Targets of differential enhancers contained within SEs (i.e. SE target genes) included a large fraction of established medulloblastoma signature genes (32%; Supplemental Table S3), as well as novel candidates (Figure 3a–c). Medulloblastoma SEs were inferred to regulate known Cancer Gene Census genes, including the aforementioned ALK in WNT, SMO and NTRK3 in SHH, LMO1, LMO2, and MYC in Group 3, and ETV4 and PAX5 in Group 4, among others (Supplemental Table S3). Furthermore, several actionable, SE-regulated genes were revealed in our analysis (Supplemental Table S5).
Figure 3. Medulloblastoma super-enhancers characterize subgroup-specific identity.
(a) Ranked enhancer plots defined across composite H3K27ac landscapes of WNT, SHH, Group 3, and Group 4 medulloblastomas. Select genes associated with SEs in each subgroup are highlighted and shaded according to enhancer class specificity.
(b) Enhancer rankings for candidate subgroup-specific SEs across all samples according to subgroup.
(c) Meta tracks of H3K27ac ChIP-Seq signal (rpm/bp) across medulloblastoma subgroups for the loci shown in (b). Candidate gene expression (mean RPKM) is shown to the right of each H3K27ac track (n=140). Error bars represent standard deviation (s.d.) of the mean.
Unbiased hierarchical clustering of SEs across samples was sufficient to recapitulate transcriptional subgroupings using no prior knowledge of subgroup status, suggesting that SEs might play a pivotal role in characterizing subgroup identity (Extended Data Figure 4a). SEs from established Group 3 medulloblastoma cell lines clustered with one another, but failed to show similarity to primary Group 3 samples or samples from any other subgroup.
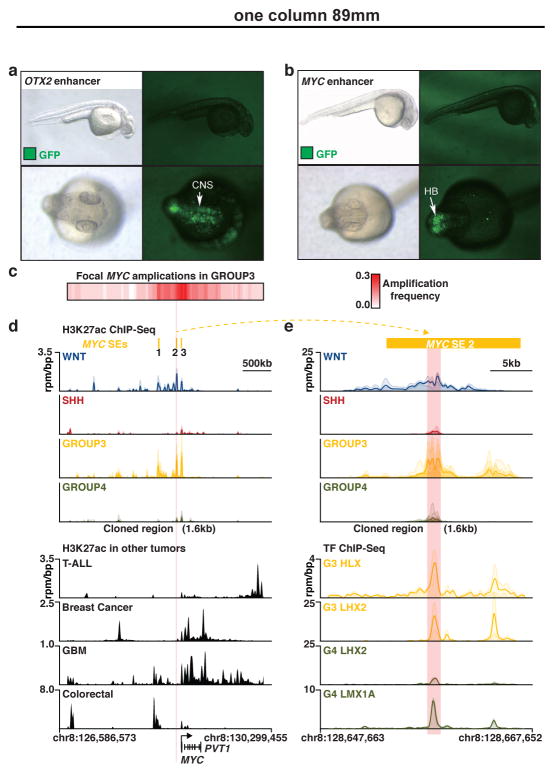
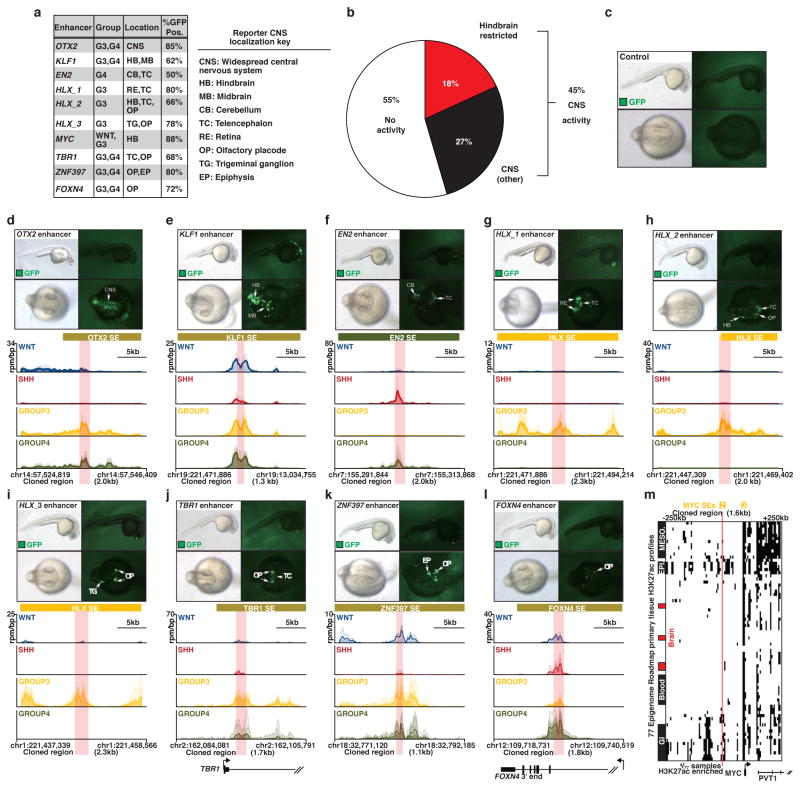
To experimentally validate the activity of medulloblastoma subgroup-specific SEs, we synthesized twenty-two unique SE loci (size range, 1.1–2.1kb) and evaluated them using Tol2 transposon-mediated zebrafish transgenesis (see Supplementary Methods)25. These in vivo reporter assays resulted in a validation rate of 45% (10/22), with all reproducibly active enhancer constructs showing specific activity in the zebrafish CNS (Figure 4a, b; Extended Data Figure 5a–l). We used TF ChIP-Seq data for HLX, LHX2, and LMX1A – all highly expressed and SE-regulated in Group 3 and/or Group 4 (Figure 3a and data not shown) – to enable precise definition of enhancer coordinates (based on TF occupancy) for testing in zebrafish (Figure 4e), potentially explaining the remarkably high in vivo validation rate we observed. These experiments confirmed zebrafish hindbrain-specific activity for an SE (active in WNT and Group 3) mapping ~90kb upstream of MYC inferred to regulate MYC expression (Figure 4b–e). This SE was not found in other common human cancers (Figure 4d), and in only 4/77 different primary tissues included in Roadmap, suggesting that this validated MYC SE is highly specific to the developing hindbrain and/or medulloblastoma (Extended Data Figure 5m). Importantly, identified MYC SEs clearly demarcate a focal amplification hotspot in published Group 3 medulloblastoma copy-number data4 (Figure 4c, d), strongly implicating these SEs in the oncogenic regulation of MYC. Collectively, these in vivo validation data further substantiate our highly integrative approach for the identification of enhancers and SEs, and inference of their target genes.
Figure 4. In vivo validation of medulloblastoma super-enhancers.
(a, b) Zebrafish reporter assays for OTX2 (a) and MYC (b) enhancers observed in medulloblastoma. Arrows indicate the locations of GFP signal. CNS, central nervous system; HB, hindbrain.
(c) Heatmap summarizing MYC copy-number data derived from a published series of Group 3 medulloblastomas (n=168).
(d, e) H3K27ac ChIP-Seq (upper panels) data showing a shared WNT/Group 3 MYC enhancer not found in other human cancers (d, lower panel) and occupied by SE-regulated TFs HLX, LHX2, and LMX1A as determined by TF ChIP-Seq (e, lower panel).
SE-regulated TFs reveal cellular origins
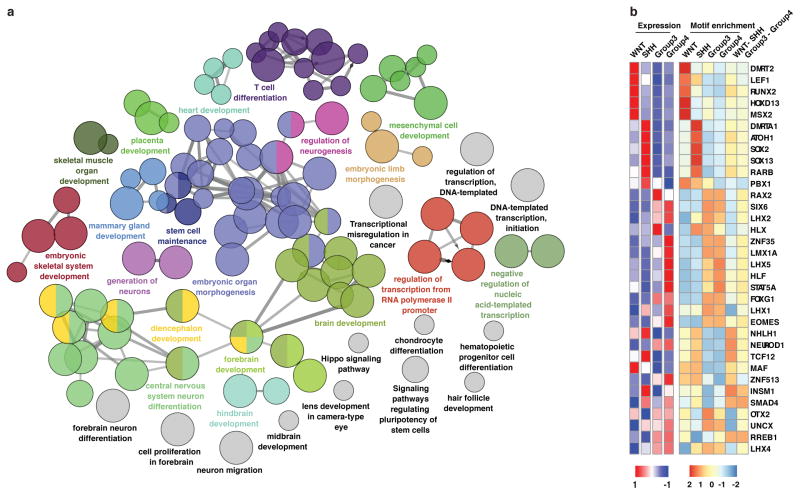
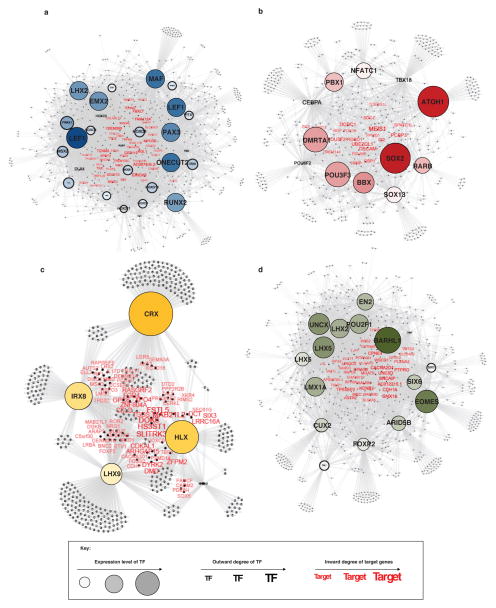
Among subgroup-specific SE target genes, we observed an enrichment of TFs involved in neuronal development (P~0.0001, Fisher’s exact test; Extended Data Figure 6a). Overall, subgroup-specific TFs displayed similar patterns of expression, enhancer motif enrichment, and overlap of target genes (Extended Data Figures 6b & 7). TFs were also enriched in subgroup-specific SE targets as compared to subgroup-specific non-SE targets (P~0.002, Fisher’s exact test), consistent with prior observations that SEs regulate key TFs required for tumour cell identity and maintenance11,13,22. Given evidence in embryonic stem cells that pluripotency master regulator TFs (OCT4, SOX2, and NANOG) are driven by SEs and themselves bind to and establish SEs23, we hypothesized that a reverse analysis of SEs in medulloblastoma might enable a de novo reconstruction of tumour identity-defining TFs and their associated regulatory circuitry, thereby providing novel insights into medulloblastoma origins.
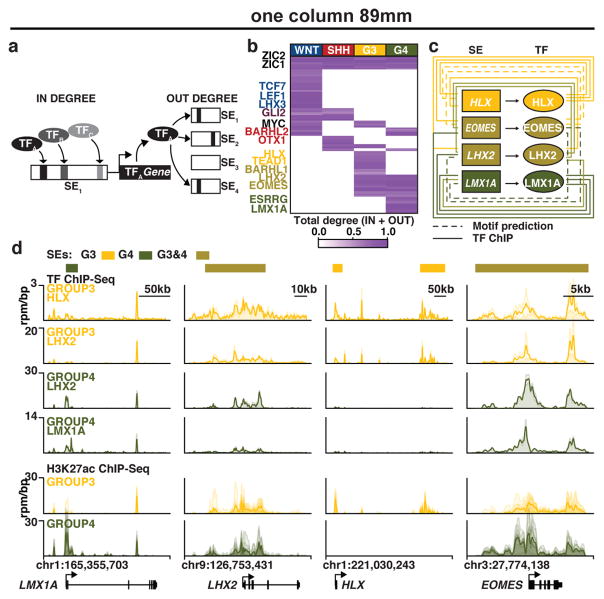
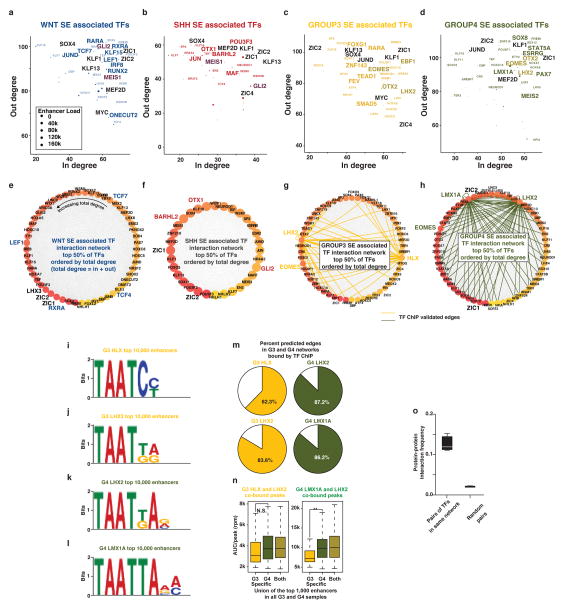
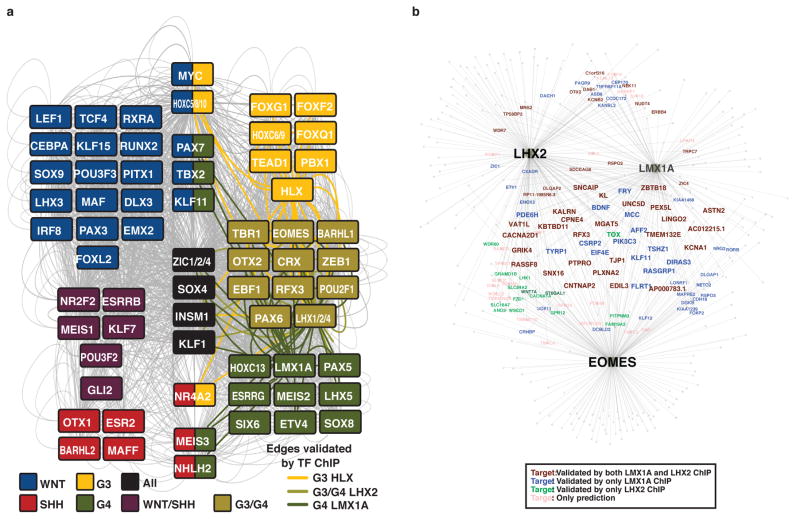
Pursuant to this idea, we proposed a definition of core regulatory circuitry TFs in which the TFs are SE-regulated and the TFs themselves bind to the SEs of one another (Figure 5a, see Supplementary Methods). For each SE-regulated TF, these criteria are quantified by measuring the inward binding of other SE associated TFs (in degree) and the outward binding of the TF to other SEs (out degree) (Figure 5a, b). Regulatory circuitry reconstruction across all SE-associated TFs in medulloblastoma identified cliques of TFs with similar patterns of in/out degree, strong interconnectivity via motif binding, and higher likelihoods of pairwise protein/protein interaction and motif co-occurrence at enhancers (see Supplementary Methods, Extended Data Figure 8). This reconstruction creates for the first time a core regulatory circuitry blueprint for each subgroup, and implicates specific sets of TFs in establishing medulloblastoma subgroup identity (Extended Data Figure 9). Importantly, ChIP-Seq for the homeodomain TFs HLX (Group 3 network), LMX1A (Group 4 network), and LHX2 (shared Group 3/Group 4 network) performed on select Group 3 and Group 4 primary samples (n=4) largely validated the computationally derived regulatory networks constructed for these subgroups (Figure 5c, d; Extended Data Figures 8–9).
Figure 5. Super-enhancers characterize medulloblastoma regulatory circuitry.
(a) Methodology for inferring medulloblastoma core regulatory circuitry.
(b) Heatmap of all SE-associated TFs in medulloblastoma (rows) clustered by similarity of regulatory degree. Selected TFs with similar subgroup-specific patterns of regulatory degree are annotated.
(c) Subgroup-specific regulatory circuitry in Group 3 and Group 4 medulloblastoma.
(d) TF and H3K27ac ChIP-Seq meta tracks for the SE-regulated TFs LMX1A, LHX2, HLX, and EOMES.
Distinct cellular origins for WNT and SHH medulloblastomas have been experimentally established using a variety of genetically engineered mouse models26–28. The origins of Group 3 and Group 4 medulloblastoma, however, are unknown and yet essential to define, as these tumours account for ~60% of all diagnoses, lack targeted therapies, and are frequently associated with poor clinical outcomes1.
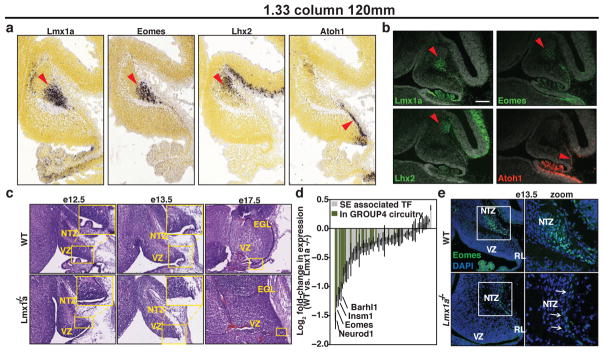
Cell identity is most essentially defined by the activity of master regulator TFs. As such, we hypothesized that the regulatory SE regions governing endogenous expression of candidate master TFs and embedded in the core regulatory circuitry of medulloblastoma subgroups might inform cellular origins of the disease via their cell type-specific activity. During early cerebellar development, Lmx1a, Eomes, and Lhx2 – master regulator Group 4 TFs deduced from our core regulatory circuitry analysis (Figure 5c) – exhibit overlapping spatiotemporal restricted expression in the nuclear transitory zone (NTZ; Figure 6a), an assembly point for immature deep cerebellar nuclei (DCN). DCN residing in the NTZ at this time point are predominantly glutamatergic projection neurons that originate from earlier progenitors of the upper rhombic lip (uRL), a transient germinal zone producing progenitors with distinct cellular fates, including DCN and cerebellar granule neurons29. Immunofluorescence microscopy confirmed compartmentalized expression of Lmx1a, Eomes, and Lhx2 that was notably distinct from Atoh1 expression, the latter marking the early external granule layer (EGL) at this developmental stage (Figure 6b).
Figure 6. Master transcription factors implicate Group 4 cellular origins.
(a) Expression (In situ hybridization) of Lmx1a, Eomes, Lhx2, and Atoh1 in the embryonic cerebellum (e13.5).
(b) Immunofluorescence microscopy for the TFs shown in (a) performed on sagittal sections of the e13.5 murine cerebellum.
(c) H&E-stained cerebellar sections (sagittal) of wild-type and drJ/drJ (Lmx1a−/−) embryos. The RL is demarcated by a yellow box in each panel.
(d) Differentially expressed TFs in the e13.5 RL of Lmx1a−/− embryos versus wild-type controls. Error bars represent standard error of the mean (n=3).
(e) Immunofluorescence microscopy confirming Eomes down-regulation in Lmx1a−/− embryos (e13.5).
Both LMX1A enhancer activity and expression are highly discriminatory for Group 4, nominating this TF as a master regulator of the Group 4 transcriptional program (Figure 3a, 5c; Extended Data Figures 8–9). Indeed, LMX1A ChIP-Seq performed on Group 4 primary samples verified >90% of predicted target genes inferred through motif-driven computational analyses (Extended Data Figures 8–9). LMX1A is a LIM-homeodomain TF previously shown to function as a critical regulator of cell-fate decisions in the uRL and essential for normal cerebellar development30. Spontaneous Lmx1a loss-of-function null mutations are causative in dreher mice, resulting in profound cerebellar phenotypes typified by premature regression of the RL, reduced choroid plexus, and cerebellar hypoplasia predominantly affecting the posterior vermis (Figure 6c)31. To further investigate the molecular targets associated with dreher cerebellar phenotypes, we microdissected uRL from wild-type and dreher (drJ/drJ) mice at e13.5 and delineated transcriptional differences through expression profiling. Strikingly, SE-regulated TFs contained in Group 3/Group 4 regulatory circuitry (Extended Data Figure 9) were among the most differentially expressed genes in dreher uRL compared to controls (Figure 6d, e). Collectively, these phenotypic and molecular data further support Lmx1a as a master regulator TF in both the cerebellar uRL and in Group 4 medulloblastoma, implicating the uRL compartment and its derivate precursors as putative cells-of-origin for Group 4.
Discussion
We describe the active medulloblastoma enhancer landscape across a series of 28 fresh-frozen, treatment-naïve tissue samples and three cultured cell lines, to our knowledge representing the largest such dataset for any single cancer entity. Our data reveal drastic divergence between primary tumour and tumour cell line material and uncover considerable cis-regulatory element heterogeneity between subgroups of the disease that would be unsubstantiated in series limited to just a few cases.
Clinically relevant medulloblastoma subgroups are principally defined based on their underlying transcriptional profiles. Differentially regulated medulloblastoma enhancers and SEs are here shown to recapitulate these subgroups, and importantly extend our understanding of this disease to inferences regarding cell specification and actionable tumour dependencies. Biological themes and signaling networks extracted from transcriptional data have served as the primary source of annotation for medulloblastoma subgroups, with WNT and SHH subgroups characterized by activation of their respective signaling pathways, and Group 3 and Group 4 recognized for their GABAergic and glutamatergic expression phenotypes, respectively. Although these data provide a functional and phenotypic annotation of medulloblastoma, they fail to articulate the developmental identity of individual subgroups. Using a reverse analysis of the medulloblastoma chromatin landscape starting at the level of differentially-regulated enhancers and SEs, we have reconstructed and experimentally validated the core regulatory circuitry inherent to medulloblastoma subgroups, inferring master transcriptional regulators responsible for subgroup-specific divergence. The majority of these master regulator TFs were not previously implicated in medulloblastoma development, nor were they visible amongst transcriptionally-derived gene sets dominated by overwhelming phenotypic signatures. Through tracing the spatiotemporal activity of a subset of Group 4 master TFs, these studies identified DCN of the cerebellar NTZ, or plausibly their earlier precursors originating from the uRL, as putative cells-of-origin for this large subgroup of patients. Together these approaches establish a framework for the inference of tumour cell-of-origin through enhancer core regulatory circuitry mapping.
Identifying the cellular origins of cancer has broad implications for the understanding and treatment of malignancy32. Although tumour cells deviate from their developmental origins during transformation, numerous cancers, especially those of the immune compartment still maintain developmental TF activity and as such are treatable through targeting of the lineage (e.g. anti-B cell therapies for leukaemia)33,34. As medulloblastoma is believed to originate from cell populations that normally exist ephemerally during development, targeting the aberrant persistence of tumour cells from these lineages may represent a novel therapeutic strategy with minimal effect on the normal tissue compartment. Moreover, elucidation of master TFs of medulloblastoma implicates upstream signalling pathways, transcriptional co-activators, and downstream effectors as potential subgroup-specific targets for rational therapeutic intervention. These insights demonstrate the critical importance of epigenetic analyses of primary tumours as opposed to cell line model systems and highlight the broad utility of core regulatory circuitry mapping especially in poorly characterized and clinically heterogeneous malignancies.
Methods
Identifying super-enhancer constituents for reporter assays
We sought to identify candidate Group 3 and Group 4 super-enhancer constituents for validation by reporter assays. We identified candidate Group 3 and Group 4 super-enhancer constituents by first locating nucleosome free “valleys” in the H3K27ac data using an algorithm adapted from Ramsey et al., 201035. Valleys that showed strong evidence of TF ChIP-Seq binding for respective Group 3 (HLX and LHX2) and Group 4 (LHX2 and LMX1A) TFs were selected and manually curated for validation in reporter assays. Based on restrictions for DNA synthesis and cloning, candidate reporter regions of roughly +/− 1kb flanking the valley center were used (Figure 4 and Extended Data Figure 5)
Zebrafish in vivo enhancer assays
All experiments involving zebrafish (Danio rerio, AB strain) were approved by the Vanderbilt Institutional Animal Care and Use Committee, Nashville, TN. Microinjection was done as described Ni et al 201236. Briefly, a mixture of individual enhancer-containing vector DNA (25μg/ml) and transposase RNA (25μg/ml) was injected into zebrafish zygotes (1 nl/zygote). The injected embryos were cultured in 0.3x Danieau’s solution at 28.5°C. After 24 hours, the embryos were examined for EGFP expression under a fluorescent dissecting microscope (Zeiss Discovery V12) to determine the stereotypic expression pattern conferred by the enhancer. The total number of embryos injected with the construct and the number of embryos with the stereotypical EGFP pattern were determined to calculate the frequency of the pattern. Embryos were dechorionated and imaged using a Zeiss AxioCam HRc digital camera. At a minimum, ~150–200 embryos were injected per reporter construct and assays were repeated 2–3 times per construct to confirm reproducibility.
Immunofluorescence microscopy
Spatial protein expression of medulloblastoma Group 4-specific transcription factors in e13.5 cerebella was determined by IHC. PFA-fixed frozen tissues were sectioned (12um thickness) and processed without antigen retrieval steps. The antibodies used here are Tbr2 (1:100, Abcam, ab23345), Lmx1a (1:100, Novus Biologicals, NBP1-81303), Atoh1 (1:500, Abcam, ab105497) and appropriate secondary antibodies conjugated with Alexa fluorophores (1:400, Invitrogen). The images were captured by an epifluorescence microscopy.
Analysis of Allen Brain Atlas Data Portal
Endogenous expression of candidate TFs was determined by querying the Allen Brain Atlas Data Portal (http://developingmouse.brain-map.org) at various developmental time points.
Medulloblastoma tissue microarrays (TMAs)
The molecular subgroup of 49 medulloblastoma samples on tissue microarrays were determined as previously described37. Immunohistochemistry was performed using clone ALK01 (#790-2918, Ventana) with appropriate secondary reagents. Individual tumors were scored positive in the presence of cytoplasmic immunoreactivity for ALK1, whereas the tumor was considered negative in the absence of immunoreactivity.
Phenotypic analysis of Dreher (Lmx1a−/ −) embryos
All mouse (Mus musculus) experiments were done in accordance with the guidelines laid down by the Institutional Animal Care and Use Committee (IACUC), of Seattle Children’s Research Institute, Seattle, WA. Lmx1a+/− mice were crossed and the day of plug was taken as e0.5. WT and Lmx1a−/ − embryos were dissected out between e12.5 and e17.5 and subsequently fixed in 4% paraformaldehyde (PFA) for 2–6 hours. The fixed embryos were washed in PBS and incubated in 30% sucrose overnight. The following day, embryos were frozen in optimum cutting temperature (OCT) compound. Mid-sagittal cryo-sections of the cerebellum at 11 microns were taken. H&E staining and immunohistochemistry were performed as described previously38. Briefly, cryosections were incubated at room temperature for 1 hour after which they were subjected to heat-mediated antigen retrieval. All sections were blocked using 5% serum containing 0.35% triton X, and then incubated with the primary antibody (Eomes (Tbr2); #14-4875, ebioscience, Mouse, 1:200), overnight. The following day fluorescent dye labelled secondary antibodies (Alexa fluor 488, 1:1000, Molecular probes, Grand Island, NY, USA) were used. Sections were counter stained using DAPI (4′,6-diamidino-2-phenylindole) (Vector laboratories). All images were captured at room temperature. H&E stained sections were imaged was done using Hamamatsu Nanozoomer whole slide scanner. All confocal images were captured using Zeiss LSM Meta and Zen 2009 software.
Collection of patient material and cell lines
An Institutional Review Board ethical vote (Ethics Committee of the Medical Faculty of Heidelberg) was obtained according to ICGC guidelines (http://www.icgc.org), along with informed consent for all participants. No patient underwent chemotherapy or radiotherapy before surgical removal of the primary tumour. Tumour tissues were subjected to neuropathological review for confirmation of histology and for tumour cell content >80%. The ChIP-Seq cohort was established based on tissue availability and availability of orthogonal data types (e.g. WGS, RNA-Seq) and patient metadata (e.g. molecular subgroup). Subgroup assignments were made using the Illumina 450K DNA methylation array as described39. Medulloblastoma cell lines were cultured at 37 °C with 5% CO2. D425_Med (D425; a gift from D. D. Bigner) and MED8A cells (from the authors’ own stocks; T. Pietsch) were cultured in DMEM with 10% FCS (Life Technologies). HD-MB03 cells20 were grown in RPMI-1640 with 10% FCS (Life Technologies). All cells were regularly authenticated and tested for mycoplasma (Multiplexion, Heidelberg, Germany).
ChIP-Sequencing
H3K27ac, BRD4, H3K27me3, H3K4me1, LMX1A, LHX2, and HLX ChIP was performed at ActiveMotif (Carlsbad, CA) using antibodies against H3K27ac (AM#39133, Active Motif), BRD4 (#A301-985A, Bethyl Laboratories), H3K27me3 (#07-449, Millipore), H3K4me1 (AM#39298, ActiveMotif), LMX1A (#AB10533, Millipore), LHX2 (#sc-19344, Santa Cruz), and HLX (#HPA005968, Sigma). Fresh-frozen medulloblastoma tissues (or cell lines) were submersed in PBS + 1% formaldehyde, cut into small pieces and incubated at room temperature for 15 minutes. Fixation was stopped by the addition of 0.125 M glycine (final concentration). The tissue pieces were then treated with a TissueTearer and finally spun down and washed 2x in PBS. Chromatin was isolated by the addition of lysis buffer, followed by disruption with a Dounce homogenizer. Lysates were sonicated and the DNA sheared to an average length of ~300–500 bp. Genomic DNA (input) was prepared by treating aliquots of chromatin with RNase, proteinase K and heat for de-crosslinking, followed by ethanol precipitation. Pellets were resuspended and the resulting DNA was quantified on a NanoDrop spectrophotometer. Extrapolation to the original chromatin volume allowed quantitation of the total chromatin yield. An aliquot of chromatin (30 ug) was precleared with protein A (G – for goat pc or monoclonal antibodies) agarose beads (Invitrogen). Genomic DNA regions of interest were isolated using 4 ug of antibody. ChIP complexes were washed, eluted from the beads with SDS buffer, and subjected to RNase and proteinase K treatment. Crosslinks were reversed by incubation overnight at 65 °C, and ChIP DNA was purified by phenol-chloroform extraction and ethanol precipitation. Quantitative PCR (qPCR) reactions were carried out in triplicate on specific genomic regions using SYBR Green Supermix (Bio-Rad). The resulting signals were normalized for primer efficiency by carrying out qPCR for each primer pair using Input DNA.
Illumina sequencing libraries were prepared from the ChIP and Input DNAs by the standard consecutive enzymatic steps of end-polishing, dA-addition, and adaptor ligation. After a final PCR amplification step, the resulting DNA libraries were quantified and sequenced on the Illumina HiSeq 2000 platform using 2 × 101 cycles according to the manufacturer’s instructions. Alignment, and downstream processing of ChIP-Seq data was performed as described6.
RNA-sequencing and transcriptome read alignment
RNA was extracted from fresh frozen tissue samples using the AllPrep DNA/RNA/Protein Mini kit (Qiagen) including DNase I treatment on column. All samples were subjected to quality control on a Bioanalyzer instrument. RNA sequencing libraries were prepared from 10 μg of total RNA. Strand-specific RNA sequencing was performed following a protocol described previously40,41. Sequencing was carried out with 2x51 cycles on a HiSeq 2000 instrument (Illumina). All reads were aligned to the human reference genome (1000 genomes version of human reference genome hg19/GRCh37) using BWA (v 0.5.9–r16). Aligned reads were converted to the SAM/BAM format using SAMtools. Gene annotation was based on Ensembl v70 (Homo sapiens).
4C-Seq
4C samples were prepared from Group 3 medulloblastoma cell line HD-MB03 using the method as described19,42. DpnII was used as the primary restriction enzyme and Csp6I as the secondary restriction enzyme in template generation. Sample libraries for SMAD9 and TGFBR1 were amplified using the primers, SMAD9_F: TTATCCAGGCAAGGAAGATC, SMAD9_R: ATTACCTCATCTGCAAAACC, TGFBR1_F: CATTCTTTCTCCCCATGATC, and TGFBR1_R: ACACAATCTTGGGTGTTTTT, respectively. Amplified libraries were multiplexed, spiked with 40% PhiX viral genome and sequenced on Hiseq 2000. Reads were mapped to human genome (hg19) using Bowtie (v 1.0.0)43.
Identification of enhancer RNA candidates
Forward and reverse RNA transcription based on directional RNA sequencing data was quantified in 3 kb windows upstream and downstream of enhancer peaks that were based on H3K27ac ChIP-Seq data, resulting in four RNA expression values for each enhancer region: (L_fwd) forward transcription left of enhancer peak, (R_fwd) forward transcription right of enhancer peak, (L_rev) reverse transcription left of enhancer peak, and (R_rev) reverse transcription right of enhancer peak. We calculated the “directionality index” D, a measure of the directionality of transcription inside an enhancer region, with D ranging from 0 to 1, by D = | R_fwd – L_rev | / (R_fwd + L_rev ) as described before14, with low D values representing bidirectional eRNA transcription. For correlation of eRNA transcription values with corresponding gene expression values, we calculated eRNA transcription values in 3 kb windows upstream and downstream of enhancer peaks by eRNA_transcription = (R_fwd + L_rev ) / 2.
Genomic coordinates and gene annotation
All coordinates in this study were based on human reference genome assembly hg19, GRCh37 (ncbi.nlm.nih.gov/assembly/2758/). Gene annotations were based on genecode annotation release 19 (gencodegenes.org/releases/19.html).
Code availability
Computational code used in analysis can be obtained at the following repositories. Calculating read density with Bamliquidator: (http://github.com/BradnerLab/pipeline/wiki/bamliquidator). Identifying enhancers and super-enhancers: (https://github.com/BradnerLab/pipeline/rose2). Defining transcriptional core regulatory circuitry: (https://pypi.python.org/pypi/coltron).
Calculating read density
We calculated the normalized read density of a ChIP-Seq dataset in any genomic region using the Bamliquidator (version 1.0) read density calculator (https://github.com/BradnerLab/pipeline/wiki/bamliquidator). Briefly, ChIP-Seq reads aligning to the region were extended by 200bp and the density of reads per base pair (bp) was calculated. The density of reads in each region was normalized to the total number of million mapped reads producing read density in units of reads per million mapped reads per bp (rpm/bp).
Plotting meta representations of ChIP-Seq signal
To compactly display medulloblastoma H3K27ac ChIP-Seq signal at individual genomic loci and across subgroups, we developed a simple meta representation (Figure 1d and others). For all samples within a group, ChIP-Seq signal is smoothed using a simple spline function and plotted as a translucent shape in units of rpm/bp. Darker regions indicate regions with signal in more samples. An opaque line is plotted and gives the average signal across all samples in a group.
Peak finding and classification
H3K27ac peak finding was performed using MACS12 with a p-value threshold of 1e-9, and with other settings as default parameters. Peak finding for each medulloblastoma was performed separately and as a control background for each H3K27ac ChIP-Seq sample, its matched genomic DNA was used. The SPOT statistic44, a measure of read fraction found in enriched regions developed by the ENCODE consortium, was used to quantify H3K27ac enrichment quality. Primary medulloblastoma datasets had a median SPOT score of 0.62 which was equivalent to cell line data and on par with primary human data generated in the Epigenome ROADMAP.
After peak calling in individual samples, H3K27ac peaks were merged into a single coordinate file. Peaks which can not be identified in at least two primary medulloblastomas and contained completely within the region surrounding ± 1kb TSS were excluded from any further analysis. This resulted in final combined and filtered peak set (n=78,516). H3K27ac enrichments were calculated on the final peak set using the following formula: log2(((CntChIP/LSizeChIP*min(LSizeChIP, LSizecnt))+pscnt)/ ((Cntcnt/LSizecnt*min(LSizeChIP, LSizecnt))+pscnt)), where CntChIP denotes the total number of reads mapping to the enhancer coordinate in ChIP sample, LSizeChIP is the total library size for the ChIP sample, Cntcnt is the total number of reads mapping to the enhancer coordinate in the control genomic DNA, LSizecnt is the total library size for the control sample, and pscnt is a constant number (pscnt=8), which was used to stabilize enrichments based on low read counts. Peaks showing statistically significant differential H3K27ac enrichment across medulloblastoma subgroups were determined using ANOVA and the ones with FDR < 0.01 were preserved after multiple testing correction. From the resulting peak-set, peaks having 1.5 (log2) fold change difference across any medulloblastoma subgroup comparison were called as “subgroup specific” enhancers (n=20,406). Peaks that do not fulfill these criteria were referred as “common” enhancers (n=58,110). Subgroup-specific enhancers were further clustered using k means, with k=6 into 6 groups as “SHH”,”WNT”,”Group4”,”WNT-SHH”,”Group3-Group4”, and “Group3” (Figure 2).
Coverage of medulloblastoma enhancers in the genome
Genome was classified into regions as exon, intron, intergenic and promoter (region surrounding ±1kb transcriptional start sites) by following the hierarchy promoter > exon > intron > intergenic. Then, medulloblastoma enhancers were intersected with these defined elements and fraction covered by each element was calculated.
Enhancer saturation analysis
To better understand whether our enhancer profiling adequately captured the primary medulloblastoma enhancer landscape, we performed a saturation analysis. We measured the total number of discreet regions and the fraction of novel regions gained by increasing sample number. This was performed across 1,000 permutations of the 28 medulloblastoma samples to establish 95% confidence intervals (Extended Data Figure 1d).
Comparison of H3K27ac with BRD4 occupancy and DNA methylation at enhancers
BRD4 enrichments at enhancers were calculated as the ratio between library size normalized read counts for BRD4 ChIP and its sample matched genomic DNA control in the same way used for calculating H3K27ac enrichments. DNA methylation values at enhancers were determined by calculating the average DNA methylation of all medulloblastoma samples where DNA methylation data is available6. H3K27ac enrichments were plotted against BRD4 enrichments (Figure 1b) or against DNA methylation (Figure 1c).
Comparison of H3K27ac occupancy with H3K4me1, H3K27me3 and BRD4 occupancy
We generated ChIP-Seq data for H3K4me1 and H3K27me3 for only three Group 3 medulloblastomas (MB-1M21,MB-4M23, and MB-4M26).Therefore, comparison of H3K27ac occupancy with H3K4me1, H3K27me3 and BRD4 (Extended Data Figure 1f) was done using the data from only these three Group 3 samples. To analyze the occupancy of the marks at H3K27me3 enriched regions, we called H3K27me3 peaks using MACS. ChIP-Seq reads covering each base pair either in the region ± 5 kb around Group 3-specific enhancer midpoints (Extended Data Figure 1f top panel) or in the region ± 5 kb around H3K27me3 peak midpoints (Extended Data Figure 1f bottom panel) were quantified. Read coverage was averaged in 100-bp windows along the regions and the values were scaled to arrange between 0 –1. Resulting values were represented as heatmaps.
Comparison of H3K27ac peak calling using whole genome sequencing or whole cell extract backgrounds
We repeated H3K27ac peak finding (running MACS with a p-value threshold of 1e-9, and with other settings as default parameters) for the two medulloblastomas (MB12 and MB200) using their input chromatin as the backgrounds instead of using their matched whole genome sequencing. Resulting set of peaks identified using whole chromatin extract were compared to the ones identified using whole genome sequencing in scatter plots in Extended Data Figure 1c.
Comparison of medulloblastoma H3K27ac enhancers with published H3K27ac data
ENCODE8 H3K27ac peaks were downloaded from http://ftp.ebi.ac.uk/pub/databases/ensembl/encode/integration_data_jan2011/byDataType/peaks/jan2011/histone_macs/optimal/hub/ and all peaks were merged into a single coordinate file. Regarding ROADMAP data45,46, all available H3K27ac alignment files were downloaded and peak finding on individual samples was performed using MACS12. All ROADMAP H3K27ac peaks were as well merged into a single coordinate file. Resulting peaks from both ENCODE and ROADMAP were intersected with medulloblastoma H3K27ac peaks (with a minimum 50% overlap criteria; Figure 1e, f).
Comparison of medulloblastoma H3K27ac enhancers with CNV data
To determine the overlap of enhancer loci with CNVs, medulloblastoma enhancer loci were intersected with focal amplifications and deletions obtained from4. To determine the statistical significance of the overlap, we performed 10,000 random simulation whereby CNV locations were randomly permuted across the genome without overlap using the bedtools shuffle utility (http://bedtools.readthedocs.org) and excluding regions found in the ENCODE8 blacklist (https://sites.google.com/site/anshulkundaje/projects/blacklists). This distribution of random overlaps was used to calculate an empirical p-value of the observed overlap significance (Extended Data Figure 1g).
Quantification of gene expression and assignment of subgroup specific expression
Expression values in rpkm were calculated using “qCount” function of Bioconductor package “quasR” (http://www.bioconductor.org/packages/release/bioc/html/QuasR.html). Genes showing differential gene expression across four medulloblastoma subgroups were determined using ANOVA (FDR less than 1%). Then, subgroup specific assignment of gene expression was done by performing a post-hoc test (using “glht” function of R package “multicomp”56.
Identification of enhancer target genes
Target gene identification of enhancers was performed as described47. For each enhancer, topology-associated domain (TAD)18 which it belongs to was identified. Then, genes with transcriptional start sites falling into the same TAD were determined. We filtered nearby genes for protein coding status, as eRNAs and other enhancer associated ncRNAs are likely to emanate from enhancers and obfuscate distal target genes. Correlation tests (Spearman’s rank correlation coefficient) for H3K27ac enrichment of the enhancer and expression level of genes which are in the same TAD were performed. After repeating this procedure for each enhancer, all p-values obtained via correlation tests were combined and corrected for multiple testing globally using Bioconductor package “qvalue” (http://www.bioconductor.org/packages/release/bioc/html/qvalue.html). Correlations with a FDR less than 5% were preserved. For each enhancer, gene whose expression best correlates with the H3K27ac enrichment of the enhancer was selected as the potential target gene. For the cases where the difference between spearman correlation coefficients for the best and second best correlating genes were less than 0.1, the second best correlating gene was also selected as another potential target gene. Identification of enhancer target genes was performed for subgroup specific and common enhancers separately. After getting final gene lists for targets of subgroup specific and common enhancers, genes which are identified as targets both for subgroup specific and common enhancers were removed from common enhancer target gene list.
Classification of enhancer targets according to enhancer regulation
Genes regulated by differential enhancers were classified into categories depending on the number of differential enhancers they are targeted by (Figure 2d). As mentioned in “identification of enhancer targets” part, to assign the enhancers to their targets with highest probability, in the final list of enhancer target genes, number of genes per enhancer was restricted to 2 genes having the highest correlation coefficient. However, to evaluate the number of genes targeted by each enhancer overall, enhancers were classified into categories depending on the number of genes they target by including all the genes targeted by enhancers (satisfying FDR<0.05 criteria) (Figure 2e).
Overlap of target genes with regulatory information from literature
medulloblastoma signature genes were defined to be the genes regulated differentially in 4 medulloblastoma subgroups16. To be conservative on the signature genes, for each medulloblastoma subgroup, top 100 genes differentially regulated in the respective subgroups were included in the analysis. Resulting gene list were compared to the genes regulated by medulloblastoma subgroup specific enhancers and super-enhancers. Comparison to cancer genes was performed using the gene list provide in cancer gene census (http://cancer.sanger.ac.uk/cancergenome/projects/census). Target genes were overlapped with consensus TFs provided48. Inference whether the target genes we identified was druggable was done by intersecting target genes with the genes provided in the drug gene interaction database (http://dgidb.genome.wustl.edu/) by using “Expert curated” option in the source trust level category of the interactions. All information showing the overlap of target genes with gene lists from literature can be found in Supplemental Table S3.
Pathway analysis
Functional characterization of enhancer/gene assignments was conducted using the ClueGO plugin for cytoscape49. Subgroup-specific enhancer gene targets or SE-regulated TFs were queried against a compendium of gene sets from GO (Biological Process), KEGG, and REACTOME to identify processes/pathways that were significantly enriched in tested gene lists from our dataset. Analyses were performed using the GO Term Fusion option in ClueGO and only processes/pathways with a p-value < 0.05 (right-sided hypergeometric test) following p-value correction (Bonferroni step down) were visualized. Manual trimming of ClueGO output was performed to remove processes/pathways affiliated with only a single gene set.
Functional comparison of Group 3 and Group 4 enhancers
To identify subgroup specific enhancers and their associated functional pathways, we performed a differential enhancer analysis50 on Group 3 and Group 4 enhancers. We first took the union of the top 1,000 enhancer in Group 3 and Group 4 as defined by total H3K27ac signal (area under the curve). We next ranked all enhancer regions by the log2 fold change in H3K27ac (Extended Data Figure 3b). Differential enhancer target genes as previously defined were depicted under associated enhancers. Visual inspection revealed a number of TGFβ pathway components associated with Group 3 specific enhancers. We visualized this by identifying all enhancer regulated TGFβ pathway components (obtained from KEGG, REACTOME, and GO Biological Process databases) and depicting their specific regulation by Group 3, Group 4, or Group 3–4 differential enhancers (Extended Data Figure 3c).
Comparing enhancer acetylation at TGFβ pathway components in ACVR2A amplified vs. non-amplified Group 3 tumors
We identified a focal amplification of the TGFβ pathway receptor gene ACVR2A in the Group 3 medulloblastoma sample MB-4M23. Whole genome sequencing log2 read depth ratio is plotted in Extended Data Figure 3d. We hypothesized that in MB-4M23, amplification of ACVR2A leads to increased TGFβ pathway activity, including the increased H3K27ac at enhancers regulating TGFβ pathway components. We identified all Group 3 enhancers regulating TGFβ pathway components and compared the median enhancer normalized H3K27ac signal in MB-4M23 vs. all other Group 3 medulloblastomas. Extended Data Figure 3e shows all enhancers ranked by their log2 fold change in H3K27ac for MB-4M23 vs. other Group 3 samples. The standard error of the mean was calculated for the fold change and is displayed as error bars in Extended Data Figure 3e.
Nucleosome free region (NFR) identification
H3K27ac data for the samples within the same subgroup was combined. Nucleosome free regions per subgroup were identified by feeding these combine datasets to HOMER software (http://homer.salk.edu/homer/ngs/index.html) using “findPeaks” function with the option “-nfr”.
Enrichment of TFs at subgroup-specific enhancers
TF binding sites obtained from TRANSFAC51 and detected at NFRs using FIMO52 were overlapped with NFRs located within each class of differentially regulated enhancers. For each TF, contingency tables showing the number of NFRs overlapping and non-overlapping with the respective TF were constructed. Significance of enrichment of TFs in NFRs of differentially regulated enhancers was determined using Chi-squared test. Resulting p-values were corrected for multiple testing (FDR<0.01). TF enrichments were calculated as the ratio between observed counts over expected counts. To represent TF enrichments as a heatmap (Extended Data Figure 6b), for each class of enhancers, 4–5 TFs showing the highest enrichments were selected.
Linking subgroup-specific enhancers with TFs
For each of differentially regulated enhancers in the classes of WNT, SHH, Group 3 and Group 4, NFRs belonging to each subgroup were overlapped with the respective subgroup-specific enhancers targeting at least one gene. Overlapping NFRs were intersected with TF binding sites having top 20th percentile enrichment scores in the respective subgroup-specific enhancers and differentially expressed in the same subgroup. For each TF, NFRs having the top 10th percentile number of binding sites were identified as sites occupied by the respective TF. Then, resulting NFRs were linked back to enhancers they are located, which enabled the linking of TFs having binding sites in the respective enhancers with the target genes of the enhancers. TF regulatory networks for each subgroup (Extended Data Figure 7), where TFs represented as “sources” and enhancer target genes represented as “targets” were constructed using visualization platform Gephi (http://gephi.github.io/). To connect LMX1A, LHX2 and EOMES with their targets (Extended Data Figure 9b), same strategy was applied by restricting the initial set of TFs to only those three.
4C-seq data analysis
Aligned 4C data was further processed, filtered and visualized using Bioconductor package “Basic4Cseq”53.
Mapping typical enhancers and super-enhancers using H3K27ac enhancer definitions
H3K27ac super-enhancers (SEs) and typical enhancers (TEs) in individual medulloblastoma samples were mapped using the ROSE2 software package described13,23 and available at https://github.com/BradnerLab/pipeline. A 12.5kb stitching window was used to connect proximal clusters of H3K27ac peaks into contiguous enhancer regions. These mappings identified on average ~600 SEs per sample.
Clustering medulloblastoma samples by SE patterns
Relationships between SE landscapes between samples were determined as in Chapuy et al., 201311. First, we defined the union of all regions considered to be an SE in any individual primary sample and in three Group 3 cell lines. Next H3K27ac signal was calculated at each region and median normalized for each sample. Samples were hierarchically clustered based on similarity of patterns of median normalized H3K27ac enhancer signal as determined using pairwise Pearson correlations.
Mapping SEs and typical enhancers across medulloblastoma subgroups (subgroup enhancer mapping)
In order to map and quantify enhancer regions for each medulloblastoma subgroup, we first mapped all enhancers in each individual sample within the group. Across a group, we used the union of all enhancer regions within group samples as the landscape of enhancers. Within this landscape, enhancers were ranked by average H3K27ac signal (area under curve) and classified as SEs or TEs as previously described. This produced SE and TE meta enhancer landscapes for WNT, SHH, Group 3, and Group 4 medulloblastoma with between 558 and 1,110 SEs called per group (Figure 3a). Locations for all SEs and TEs in each subgroup are provided in Supplemental Table S4.
Quantifying enhancer signal variance across samples at meta enhancer regions
To compare the dynamic range of SEs and TEs defined in each medulloblastoma subgroup, we quantified H3K27ac signal variance across samples. For SE and TE enhancer constituents (individual peaks of H3K27ac enrichment within broader enhancer domains) defined in each group, H3K27ac signal variance across samples as a fraction of the mean sample was calculated. The average H3K27ac signal variance across all SEs or TEs within a group is plotted in Extended Data Figure 4f.
Quantifying average H3K27ac signal across samples at subgroup SEs and typical enhancers
We sought to examine trends in H3K27ac signal across medulloblastoma samples at regions defined as SEs or TEs in each group. First we mapped H3K27ac across all samples to enhancer constituents defined in each group. For each medulloblastoma sample, the average median normalized H3K27ac signal was plotted for SE and TE constituents respectively. For SEs and TEs defined in each group, the average sample H3K27ac signal is plotted with the mean and standard deviation shown as lines. This visualization enables a rapid assessment of H3K27ac variance within a group and of trends in H3K27ac signal for SEs and TEs defined in each group (Extended Data Figure 4h). For instance, enhancer constituents in Group 3 SEs tend to have high signal in Group 4.
Quantifying group ChIP-Seq signal at subgroup SEs and typical enhancers within and between groups
SEs have been shown to have higher H3K27ac and BRD4 signal density at constituents when compared to typical enhancers13,23. To determine if these trends were observed at medulloblastoma enhancers, we calculated H3K27ac and BRD4 ChIP-Seq signal density across all samples at all regions defined as enhancers across groups (meta enhancers). In order to properly compare ChIP-Seq signal density between SEs and TEs, for each enhancer constituent, we first determined if it was considered part of an SE in one or more groups, and if so, these groups defined the “active group context” for that particular enhancer constituent. Groups in which the enhancer constituent showed no evidence of enhancer activity (SE or TE) were considered the inactive group context. For enhancer constituents considered only part of a TE in one or more groups, groups in which the enhancer constituent was classified as a TE were considered the active group context and all other groups were considered the inactive group context. For each SE or TE constituent, average H3K27ac or BRD4 signal density was calculated at all samples in the active group context or in the inactive group context. The distributions of H3K27ac or BRD4 signal for enhancer constituents classified by SE or TE status were plotted and the statistical significance of the difference in the mean was tested in the active or inactive group context using a Welch’s two-tailed t test (Extended Data Figure 4g).
Identifying group specific and conserved SEs
We developed a method to identify SEs that were conserved across all medulloblastoma subgroups as well as SEs that showed highly group specific patterns of enhancer activity. We first took as the SE landscape all regions identified as SEs in the meta subgroup enhancer mapping. To account for sample-to-sample variability in H3K27ac ChIP-Seq dynamic range, H3K27ac signal at enhancers in each medulloblastoma sample was rank transformed (Figure 3b). As each medulloblastoma sample contained on average ~600 SEs, enhancer regions with an average rank of 600 or better in each subgroup were considered conserved. To identify enhancers with group specific patterns of activity, we calculated a “group rank Z-score” that compared average signal in one group to average signal in other groups. Here we considered whether enhancers might show group specific patterns for WNT, SHH, Group 3, Group 4, and as well for groupings of WNT/SHH, and Group 3/4. For each enhancer, this group rank Z-score was calculated for each group vs. other combination. Enhancers with a group rank Z-score > 1 (i.e. those whose mean rank within a group was > 1 standard deviation above the mean rank of all other samples) were considered group specific. To account for variability in enhancer ranks, only enhancers with a statistically significant difference in ranks (within group vs. all other samples, Welch’s two-tailed t test, p-value < 0.01) were considered. Supplemental Table S4 contains all SE regions identified in medulloblastoma subgroups and their corresponding max group rank Z-score, p-value, and classification.
Mapping H3K27ac enrichment at the MYC gene desert
To provide a developmental context for medulloblastoma MYC SEs, we mapped H3K27ac enrichment at the MYC locus. H3K27ac data was obtained from the Epigenome ROADMAP as in Figure 1e. The 500kb region flanking the MYC SE No. 2 was divided into 5kb bins and each bin was tested for overlap with a H3K27ac peak in each ROADMAP sample. ROADMAP samples were hierarchically clustered by similarity of H3K27ac peak pattern at the MYC locus (Extended Data Figure 5m). Overlap with MYC SE No. 2 was found in 4/77 ROADMAP samples.
Calculating regulatory IN and OUT degree for all SE associated TFs
Medulloblastoma core regulatory circuitry analysis was performed using the COLTRON (https://pypi.python.org/pypi/coltron) that calculated inward and outward degree regulation of SE-regulated TFs. To quantify the interaction network of TF regulation, we calculated the IN and OUT degree of all SE associated TFs. The 92 SE associated TFs were those defined as either proximal to an SE (within 50kb) or the target of a differential SE enhancer element. For any given TF (TFi), the IN degree was defined as the number of TFs with an enriched binding motif at the proximal SE of TFi (Figure 5a). The OUT degree was defined as the number of TF associated SEs containing an enriched binding site for TFi. Within any given SE, enriched TF binding sites were determined at putative nucleosome free regions (valleys) flanked by high levels of H3K27ac. Valleys were calculated using an algorithm adapted from Ramsey et al., 201035. In these regions, we searched for enriched TF binding sites using the FIMO52 algorithm with TF position weight matrices defined in the TRANSFAC database51. An FDR cutoff of 0.01 was used to identify enriched TF binding sites. Using this approach, we calculated IN and OUT degree for all SE associated TFs within the meta H3K27ac landscape (average of all samples) of each medulloblastoma subgroup. This approach resulted in an IN and OUT degree estimate for each SE associated TF in each medulloblastoma subgroup (Extended Data Figure 8a–d).
Identifying TF binding motifs for LMX1A, LHX2, and HLX
We sought to identify TF binding motifs for each TF in each subgroup. For each TF, we defined binding regions as the +/− 1,000bp flanking the enriched region summit (as defined using MACS 1.4.2 with a p-value cutoff of 1e-9). We took the union of all regions bound in a given subgroup (e.g. HLX bound regions in Group 3 samples) that overlapped an enhancer in that subgroup and did not overlap any ENCODE8 blacklist regions. We next took the top 10,000 discreet regions as ranked by average TF ChIP-Seq signal and used the +/−100bp region flanking the region center as the input for de novo motif finding. De novo motif finding was performed using the MEME54 suite using a 1st order background model and searching for motifs between 6 and 30bp in length. The top motif for each TF is displayed as a position weight matrix in Extended Data Figure 8i–l.
Visualizing TF regulatory networks
To visualize SE associated TF interactions in each subgroup, we ranked all SE associated TF by TOTAL degree (IN + OUT). We visualized the top 50% of SE associated TFs in each subgroup as a network diagram with each node representing a SE associated TF, and with nodes colored and ordered by increasing TOTAL degree (Extended Data Figure 8e–h). Interactions between SE associated TF nodes were defined as a TF motif identified in the SE of a TF and are depicted as edges. For Group 3 and Group 4, edges validated by the presence of a TF ChIP-Seq peak are colored.
Clustering TFs by regulatory degree to identify and infer subgroup specific regulatory circuitry
To identify SE associated TFs with similar regulatory patterns likely to influence subgroup identity, we first normalized the TOTAL degree for each SE associated TF in each subgroup from 0 to 1. We then calculated the normalized TOTAL degree for each SE associated TF in each subgroup. We filtered out all TFs with a max TOTAL degree across medulloblastomas of less than 0.7. We next clustered all remaining TFs by their TOTAL degree pattern. Hierarchical clustering was performed using a Euclidian distance metric and the resulting clustergram tree was cut at a distance of 0.5 to produce 26 individual clusters. Of these 26 clusters, 12 showed a median TOTAL degree > 0.7 in 1,2, or all 4 subgroups. Clusters with > 0.7 TOTAL degree in 3 subgroups were omitted for simplicity. TOTAL degree patterns of TFs in these 12 clusters are shown in Extended Data Figure 9a. This filtering produced a list of 102 SE associated TFs, of which 71 had predicted interactions with one another. These 71 TFs fall into either conserved, subgroup specific, or dual subgroup clusters and together they comprise the inferred core regulatory circuitry of medulloblastoma subgroups. As in Extended Data Figure 8e–h, regulatory interactions between these core regulatory circuitry TFs are depicted in Extended Data Figure 9a with Group 3 and Group 4 validated edges colored. A subset of this larger network containing the TFs HLX, LHX2, EOMES, and LMX1A is depicted in Figure 5c with ChIP-Seq validated edges drawn as solid lines and motif prediction edges drawn in dotted lines.
Quantifying protein-protein interactions of co-regulating SEs
We used the STRING interaction database55 to quantify protein-protein interaction frequencies of SE associated TFs with similar regulatory patterns. TF pairs were considered co-regulatory if they shared 50% of the same OUT degree edges. Interaction frequencies for co-regulatory pairs were compared to those from 10,000 randomly assigned pairs of TFs expressed in that subgroup (Extended Data Figure 8o).
Integration of TF ChIP-Seq occupancy into enhancer landscape and TF regulatory network
To determine the fraction of motif predicted edges with evidence of actual TF ChIP-Seq binding, we first took all predicted edges for HLX, LHX2, and LMX1A interacting SE associated with other TFs in Group 3 and Group 4. We validated all edges that contained a ChIP-Seq peak within the same enhancer as the predicted TF motif. The fraction of validated edges for each TF in each subgroup is shown in Extended Data Figure 8g, h, m.
Quantification of TF binding at Group 3 and 4 enhancers
To determine how Group 3 and Group 4 TF ChIP-Seq levels varied at Group 3 and Group 4 specific enhancers, we quantified TF ChIP-Seq signal at Group 3 and Group 4 enhancers. We first took the union of the top 1,000 enhancer regions as defined by H3K27ac signal in Group 3 and Group 4 (as in Extended Data Figure 3b). We identified as Group 3 and Group 4 specific enhancer regions with a > log2 1.0 absolute fold change between Group 3 and Group 4. We identified as conserved enhancer regions with a < 0.05 log2 absolute fold change between Group 3 and Group 4. We next identified all enhancer regions bound by LHX2 and HLX in Group 3 (G3 HLX and LHX2) or by LHX2 and LMX1A in Group 4 (G4 LMX1A and LHX2). TF ChIP-Seq occupancy in units of average area under the curve (AUC) were quantified at TF bound regions overlapping Group 3 specific, Group 4 specific, and conserved enhancer region (Extended Data Figure 8n). Statistical differences in the means of the distributions of TF ChIP-Seq signal at different enhancer populations was determined using a Welch’s two tailed t-test (Extended Data Figure 8n).
Quantifying Group 4 TF gene expression changes in Dreher RL
To identify genes transcriptionally regulated by Lmx1a in the developing cerebellum, we isolated cerebellar uRL from wild type and Lmx1a−/− embryos by laser capture microdissection. uRL was isolated from WT (n=3) and Lmx1a−/− (n=3) embryos (~3000 cells/embryo) at e13.5, just prior to abnormal RL regression in Lmx1a−/− embryos. RNA was extracted using PicoPure RNA Isolation Kit (Arcturus) and hybridized to Illumina MouseRef8 v2 Expression BeadChips at the Johns Hopkins Array Core Facility. Next we identified all human TF genes with unambiguous mouse homologs that were detectably expressed in the WT mouse cerebellum (cut off of 100 arbitrary units). We subsequently quantified median normalized expression in WT or Lmx1a−/− samples and calculated the log2 fold-change for all TFs. We ranked the expression fold-change of all SE-associated TFs in medulloblastoma and plotted their log2 fold change in Lmx1a−/− vs. WT (Figure 6d). SE-associated TFs present in the Group 4 TF network (Extended Data Figure 8h) were colored in green.
Extended Data
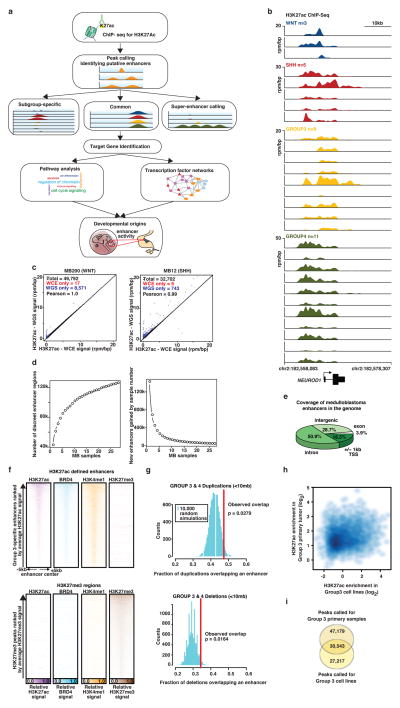
Extended Data Figure 1 (accompanies Figure 1). Enhancer landscape of primary medulloblastoma.
(a) Experimental workflow for studying enhancers and super-enhancers in primary medulloblastomas.
(b) H3K27ac ChIP-Seq data showing a highly active enhancer at the NEUROD1 locus across all 28 primary medulloblastoma samples from our series.
(c) Scatter plots showing Pearson correlation of H3K27ac peaks called using either sample-matched WGS or whole cell extract (WCE) sequences as background for two samples from our series.
(d) Saturation analysis showing the number of discreet enhancer regions identified as a function of increasing sample number (top), or the fraction of newly gained discreet enhancer regions as a function of increasing sample number (bottom). Error bars represent 95% confidence intervals obtained from 1,000 permutations of sample order.
(e) Pie chart showing the genomic distribution of enhancer elements in medulloblastoma.
(f) Heatmaps of ChIP-Seq data showing the scaled read densities for H3K27ac, BRD4, H3K4me1, and H3K27me3 in regions located ± 5kb from Group 3-specific H3K27ac (top panel) and H3K27me3 peak midpoints (bottom panel).
(g) Histograms showing the fractional overlap of enhancers with focal amplifications (top) or focal deletions (bottom) in Group 3 and Group 4 medulloblastoma samples. The blue distributions represent expected fractional overlap generated from 10,000 random simulations. The red line depicts the actual observed fractional overlap with empirical p-value noted.
(h) Scatter plot correlating average H3K27ac enrichment in Group 3 cell lines with average H3K27ac enrichment in Group 3 primary medulloblastomas. Enrichments are calculated for peaks called in primary Group 3 samples.
(i) Venn diagram showing the overlap between H3K27ac peaks called for primary Group 3 medulloblastomas and Group 3 medulloblastoma cell lines.
Extended Data Figure 2 (accompanies Figure 2). Enhancer/gene assignments in medulloblastoma.
(a) Meta H3K27ac ChIP-Seq tracks of the Group 3-specific enhancers (E1 and E2) in the TAD containing ATP10A, GABRB3, and GABRA5.
(b) Zoom in meta H3K27ac ChIP-Seq tracks of enhancer E1 from (a).
(c–e) Scatter plots correlating sample-matched gene expression (log2 RPKM, x-axis) of ATP10A (c), GABRB3 (d), and GABRA5 (e) with H3K27ac enrichment (log2; y-axis) for the Group 3-specific enhancer shown in (b).
(f) Zoom in meta H3K27ac ChIP-Seq tracks of enhancers E2 from (a).
(g–i) Scatter plots correlating sample-matched gene expression (log2 RPKM, x-axis) of ATP10A (g), GABRB3 (h), and GABRA5 (i) with H3K27ac enrichment (log2; y-axis) for the Group 3-specific enhancer shown in (f).
(j, k) 4C-Seq validation of TGFBR1 (j) and SMAD9 (k) enhancer/promoter interactions in a Group 3 cell line (HD-MB03).
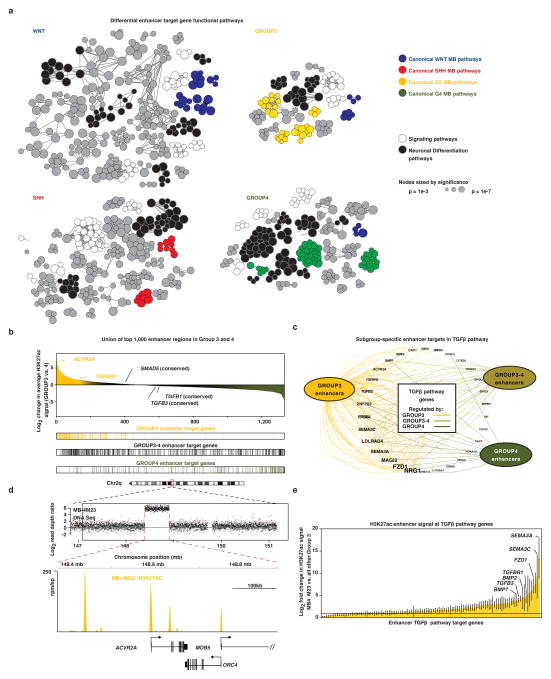
Extended Data Figure 3 (accompanies Figure 2). Enhancer-driven TGFβ activity in Group 3 medulloblastoma.
(a) Functional annotation of target genes assigned to subgroup-specific enhancers based on their significant overlap with gene sets annotated in Gene Ontology (GO Biological Process) and pathway databases (KEGG, Reactome).
(b) Waterfall plot discriminating the top 1,000 Group 3 and Group 4 subgroup-specific enhancers as defined by total H3K27ac signal. The distribution of assigned targets in Group 3, Group 4, and shared Group 3–4 targets are shown below the waterfall.
(c) Convergence of Group 3-specific enhancers on TGFβ pathway genes. Subgroup-specific enhancers are summarized as nodes according to their respective medulloblastoma enhancer class – Group 3, Group 4, and shared Group 3/Group 4 – with edges representing individual enhancer/TGFβ pathway gene assignments.
(d) Amplification of the TGFβ type II receptor, ACVR2A, in a Group 3 medulloblastoma from the ChIP-Seq cohort (MB-4M23). Log2 read depth data (tumour versus matched germline) derived from WGS data for this case is shown (upper panel). Highly active H3K27ac enhancer peaks overlapping the amplified ACVR2A locus are shown for the same case (lower panel).
(e) Bar plot showing the difference in H3K27ac enhancer signal between MB-4M23 (ACVR2A-amplified Group 3 sample) and all other Group 3 samples. Bar plot shows H3K27ac log2 fold change at all enhancers regulating TGFβ component genes. Enhancers are ranked by increasing change in H3K27ac. Error bars represent standard error of the mean fold change.
Extended Data Figure 4 (accompanies Figure 3). Features of medulloblastoma super-enhancers.
(a) Unsupervised hierarchical clustering of primary medulloblastomas and cell lines using H3K27ac signal calculated at all SEs identified in each individual sample.
(b) Meta tracks of H3K27ac ChIP-Seq signal for the ZIC1/ZIC4 SE locus. Expression (mean RPKM) for both ZIC4 (left) and ZIC1 (right) is displayed as bar graphs to the right of each H3K27ac track with error bars representing s.d. of the mean (n = 140 samples).
(c) Line plot showing the enhancer rank for the ZIC1/ZIC4 SE locus across all samples according to subgroup.
(d) Heatmap showing the SE association of known medulloblastoma driver genes and chromatin modifiers. Genes with called differential SEs are shaded black, whereas genes with proximal SEs (within 100kb of TSS) are shaded grey, according to their respective subgroup.
(e) Bar plot showing the number of SE regions assigned to individual enhancer classes in medulloblastoma.
(f) Bar plot of enhancer signal cross sample variance (y-axis) displayed as a fraction of the mean for SE enhancer constituents (left, black) or TE enhancer constituents (right, grey) identified in each medulloblastoma subgroup.
(g) Boxplots of H3K27ac (left, blue) or BRD4 (right, red) enhancer signal at SEs or typical enhancers (TE) in their active group-specific context or in their inactive group context (e.g. for SEs or TEs present in Group 3, active group context includes all Group 3 samples and inactive group context includes all other samples). Differences in the means of the distributions is quantified by a Welch’s two-tailed t test (*** p<1e−9).
(h) Dot plots of average H3K27ac enhancer signal in the constituents of SEs (left) or TEs (right) for enhancer constituents identified in WNT, SHH, Group 3, or Group 4 samples, respectively. Error bars represent standard deviation of the mean across all samples in a subgroup.
Extended Data Figure 5 (accompanies Figure 4). In vivo validation of Group 3 and Group 4 medulloblastoma super-enhancers.
(a) Summary of zebrafish reporter assays.
(b) Pie chart showing the fraction of all tested medulloblastoma enhancer regions that demonstrate any CNS localized reporter activity.
(c–l) Representative bright-field and fluorescence images of embryos (1 dpf) injected with individual enhancer-containing Tol2 vectors. Lateral views (60x) show GFP reporter expression in the whole body and dorsal views show GFP expression in the CNS (120x). White arrows indicate the locations of GFP signal. CNS, central nervous system; HB, hindbrain; MB, midbrain; CB, cerebellum; TC, telencephalon; RE, retina; OP, olfactory placode; TG, trigeminal ganglion. For each tested enhancer, meta tracks of H3K27ac ChIP-Seq signal across medulloblastoma subgroups for the cloned regulatory element are shown.
(m) Heatmap showing H3K27ac enrichment at the +/− 250kb region flanking the medulloblastoma MYC SE described in Figure 4 (SE #2; panels f, h–j) across 77 Epigenome Roadmap tissues. Each row represents a single tissue. Each column represents a region of the MYC gene desert locus. Black shaded regions indicate the presence of H3K27ac enrichment. The samples are ordered by similarity of H3K27ac enrichment pattern. Notable clusters of mesoderm (MESO.), epithelial (EPI.), blood, brain, or GI lineage derived samples are noted. The cloned enhancer reporter region described in Figure 4 (panels f, h–j) is depicted as a vertical line and shows overlap with only 4/77 H3K27ac Epigenome Roadmap samples.
Extended Data Figure 6 (accompanies Figure 5). Pathways regulated by super-enhancer associated transcription factors in medulloblastoma.
(a) Functional pathways regulated by SE-associated TFs in medulloblastoma.
(b) Heatmap of select subgroup-specific TFs showing their expression (left columns) and enhancer motif enrichment (right columns). Enhancer motif enrichment was calculated at differential enhancer elements in the respective enhancer classes.
Extended Data Figure 7 (accompanies Figure 5). Medulloblastoma subgroup-specific transcription factors and their associated target genes.
(a–d) Network of subgroup-specific TFs and their predicted target genes for WNT (a), SHH (b), Group 3 (c) and Group 4 (d) subgroups. Nodes represent subgroup-specific TFs. In each subgroup, node size is scaled and shaded according to the expression level of the TF and node font is scaled and shaded according to the number of inferred target genes (i.e. OUT degree). TF target genes are shown in red font scaled according to the number of TFs predicted to target that gene (i.e. IN degree).
Extended Data Figure 8 (accompanies Figure 5). Super-enhancers define medulloblastoma regulatory circuitry.
(a–d) Scatter plots of IN (x-axis) and OUT (y-axis) regulatory degree for SE-associated TFs in each medulloblastoma subgroup.
(e–h) TF interaction networks for each medulloblastoma subgroup. Nodes represent the top 50% of SE-associated TFs in each subgroup as ranked by total degree (counter clockwise). Each node is colored by total degree and predicted binding interactions with other TF SEs are shown as edges. For Group 3 and Group 4 networks, edges validated by TF ChIP-Seq binding are colored.
(i–l) Position weight matrices showing the top statistically enriched motif identified for each transcription factor at the top 10,000 bound enhancers in each subgroup.
(m) Pie charts showing the fraction of predicted edges in each Group 3 and Group 4 TF networks that are validated by the presence of the respective TF ChIP-Seq binding at the enhancer.
(n) Medulloblastoma subgroup distribution of shared, co-bound peaks for master regulatory TFs analysed by ChIP-Seq. TF binding is quantified as area under curve per peak (AUC/peak) in units of rpm. Differences in the means of the distributions is quantified by a Welch’s two-tailed t test (N.S. p > 0.1, ** p<1e−6).
(o) Boxplot of protein-protein interaction frequency (y-axis) calculated from STRING database for pairs of SE-associated TFs showing patterns of subgroup-specific SE co-regulation (left) or randomized pairs (right).
Extended Data Figure 9 (accompanies Figure 5). LMX1A, EOMES, and LHX2 are master transcriptional regulators of Group 4 medulloblastoma.
(a) Subgroup-specific regulatory circuitry. Nodes are TFs associated with an SE in a subgroup-specific context. Edges indicate co-regulating TFs as defined by enrichment of TF binding motifs in respective regulatory regions. Edges validated by TF ChIP-Seq are coloured according to their respective subgroup association.
(b) Network involving LHX2, LMX1A, and EOMES TFs and target genes inferred based on the presence of the respective TF motifs in Group 4-specific enhancers. Target genes are colored according to their validation status based on LMX1A and LHX2 ChIP-Seq, with genes arranged in the center of the network inferred to be targeted by all three master TFs. For visualization purposes, these common targets are displayed with a larger font size compared to the genes in the surrounding network.
Supplementary Material
Acknowledgments
S.E. is a recipient of Human Frontiers Science Program long-term postdoctoral fellowship (LT000432/2014). SMW received funding through a SNSF Early Postdoc Mobility Fellowship (P2ELP3_155365) and an EMBO Long-Term Fellowship (ALTF 755-2014). CYL is supported by a US Department of Defense CDMRP CA120184 postdoctoral fellowship. PAN is a V Foundation V Scholar in Childhood Cancer Research. We thank Creative Science Studios (http://www.creativesciencestudios.com/) for assistance with artwork.
Footnotes
Short-read sequencing data have been deposited at the European Genome-Phenome Archive (EGA, http://www.ebi.ac.uk/ega/) hosted by the EBI, under accession number EGAS00001000215.
The authors declare no competing financial interests.
Readers are welcome to comment on the online version of this article at www.nature.com/nature.
Author Contributions
PAN, JEB, and SMP conceived and co-led the study. CYL and SE performed all bioinformatics related to the analysis of medulloblastoma enhancers and super-enhancers. YT, LY, DK, BCW, BJ, and WC validated subgroup-specific enhancers in vivo. CYL and AJF constructed medulloblastoma regulatory circuitry networks. MZ, SW, RZ, MS-W, DTWJ, MK, VH, IB, and LC provided informatics and general scientific support. PH, VVC, and KJM performed the developmental studies with dreher and WT mouse embryonic cerebella. TR, H-JW, VA, HL, and M-LY conducted RNA-Seq data generation and enhancer RNA analysis. BAO performed ALK staining on medulloblastoma TMAs. LS, PJ, and SG performed 4C-Seq experiments. MR and AK provided medulloblastoma tissue samples. RE, PL, JOK, SMP, JEB, and PAN provided institutional support and project supervision. CYL, SE, SMP, JEB, and PAN prepared the figures and wrote the manuscript.
References
- 1.Northcott PA, Korshunov A, Pfister SM, Taylor MD. The clinical implications of medulloblastoma subgroups. Nature reviews. Neurology. 2012;8:340–351. doi: 10.1038/nrneurol.2012.78. [DOI] [PubMed] [Google Scholar]
- 2.Jones DT, et al. Dissecting the genomic complexity underlying medulloblastoma. Nature. 2012;488:100–105. doi: 10.1038/nature11284. [DOI] [PMC free article] [PubMed] [Google Scholar]
- 3.Northcott PA, et al. Enhancer hijacking activates GFI1 family oncogenes in medulloblastoma. Nature. 2014;511:428–434. doi: 10.1038/nature13379. [DOI] [PMC free article] [PubMed] [Google Scholar]
- 4.Northcott PA, et al. Subgroup-specific structural variation across 1,000 medulloblastoma genomes. Nature. 2012;488:49–56. doi: 10.1038/nature11327. [DOI] [PMC free article] [PubMed] [Google Scholar]
- 5.Northcott PA, et al. Medulloblastomics: the end of the beginning. Nature reviews. Cancer. 2012;12:818–834. doi: 10.1038/nrc3410. [DOI] [PMC free article] [PubMed] [Google Scholar]
- 6.Hovestadt V, et al. Decoding the regulatory landscape of medulloblastoma using DNA methylation sequencing. Nature. 2014;510:537–541. doi: 10.1038/nature13268. [DOI] [PubMed] [Google Scholar]
- 7.Shlyueva D, Stampfel G, Stark A. Transcriptional enhancers: from properties to genome-wide predictions. Nature reviews. Genetics. 2014;15:272–286. doi: 10.1038/nrg3682. [DOI] [PubMed] [Google Scholar]
- 8.Consortium EP. An integrated encyclopedia of DNA elements in the human genome. Nature. 2012;489:57–74. doi: 10.1038/nature11247. [DOI] [PMC free article] [PubMed] [Google Scholar]
- 9.Thurman RE, et al. The accessible chromatin landscape of the human genome. Nature. 2012;489:75–82. doi: 10.1038/nature11232. [DOI] [PMC free article] [PubMed] [Google Scholar]
- 10.Roadmap Epigenomics C etal. Integrative analysis of 111 reference human epigenomes. Nature. 2015;518:317–330. doi: 10.1038/nature14248. [DOI] [PMC free article] [PubMed] [Google Scholar]
- 11.Chapuy B, et al. Discovery and characterization of super-enhancer-associated dependencies in diffuse large B cell lymphoma. Cancer cell. 2013;24:777–790. doi: 10.1016/j.ccr.2013.11.003. [DOI] [PMC free article] [PubMed] [Google Scholar]
- 12.Zhang Y, et al. Model-based analysis of ChIP-Seq (MACS) Genome biology. 2008;9:R137. doi: 10.1186/gb-2008-9-9-r137. [DOI] [PMC free article] [PubMed] [Google Scholar]
- 13.Loven J, et al. Selective inhibition of tumor oncogenes by disruption of super-enhancers. Cell. 2013;153:320–334. doi: 10.1016/j.cell.2013.03.036. [DOI] [PMC free article] [PubMed] [Google Scholar]
- 14.Kim TK, et al. Widespread transcription at neuronal activity-regulated enhancers. Nature. 2010;465:182–187. doi: 10.1038/nature09033. [DOI] [PMC free article] [PubMed] [Google Scholar]
- 15.Cho YJ, et al. Integrative genomic analysis of medulloblastoma identifies a molecular subgroup that drives poor clinical outcome. Journal of clinical oncology : official journal of the American Society of Clinical Oncology. 2011;29:1424–1430. doi: 10.1200/JCO.2010.28.5148. [DOI] [PMC free article] [PubMed] [Google Scholar]
- 16.Northcott PA, et al. Medulloblastoma comprises four distinct molecular variants. Journal of clinical oncology : official journal of the American Society of Clinical Oncology. 2011;29:1408–1414. doi: 10.1200/JCO.2009.27.4324. [DOI] [PMC free article] [PubMed] [Google Scholar]
- 17.Jin F, et al. A high-resolution map of the three-dimensional chromatin interactome in human cells. Nature. 2013;503:290–294. doi: 10.1038/nature12644. [DOI] [PMC free article] [PubMed] [Google Scholar]
- 18.Pope BD, et al. Topologically associating domains are stable units of replication-timing regulation. Nature. 2014;515:402–405. doi: 10.1038/nature13986. [DOI] [PMC free article] [PubMed] [Google Scholar]
- 19.Groschel S, et al. A single oncogenic enhancer rearrangement causes concomitant EVI1 and GATA2 deregulation in leukemia. Cell. 2014;157:369–381. doi: 10.1016/j.cell.2014.02.019. [DOI] [PubMed] [Google Scholar]
- 20.Milde T, et al. HD-MB03 is a novel Group 3 medulloblastoma model demonstrating sensitivity to histone deacetylase inhibitor treatment. J Neurooncol. 2012;110:335–348. doi: 10.1007/s11060-012-0978-1. [DOI] [PubMed] [Google Scholar]
- 21.Hallberg B, Palmer RH. Mechanistic insight into ALK receptor tyrosine kinase in human cancer biology. Nature reviews. Cancer. 2013;13:685–700. doi: 10.1038/nrc3580. [DOI] [PubMed] [Google Scholar]
- 22.Hnisz D, et al. Super-enhancers in the control of cell identity and disease. Cell. 2013;155:934–947. doi: 10.1016/j.cell.2013.09.053. [DOI] [PMC free article] [PubMed] [Google Scholar]
- 23.Whyte WA, et al. Master transcription factors and mediator establish super-enhancers at key cell identity genes. Cell. 2013;153:307–319. doi: 10.1016/j.cell.2013.03.035. [DOI] [PMC free article] [PubMed] [Google Scholar]
- 24.Aruga J, et al. Mouse Zic1 is involved in cerebellar development. The Journal of neuroscience : the official journal of the Society for Neuroscience. 1998;18:284–293. doi: 10.1523/JNEUROSCI.18-01-00284.1998. [DOI] [PMC free article] [PubMed] [Google Scholar]
- 25.Rada-Iglesias A, et al. A unique chromatin signature uncovers early developmental enhancers in humans. Nature. 2011;470:279–283. doi: 10.1038/nature09692. [DOI] [PMC free article] [PubMed] [Google Scholar]
- 26.Gibson P, et al. Subtypes of medulloblastoma have distinct developmental origins. Nature. 2010;468:1095–1099. doi: 10.1038/nature09587. [DOI] [PMC free article] [PubMed] [Google Scholar]
- 27.Schuller U, et al. Acquisition of granule neuron precursor identity is a critical determinant of progenitor cell competence to form Shh-induced medulloblastoma. Cancer cell. 2008;14:123–134. doi: 10.1016/j.ccr.2008.07.005. [DOI] [PMC free article] [PubMed] [Google Scholar]
- 28.Yang ZJ, et al. Medulloblastoma can be initiated by deletion of Patched in lineage-restricted progenitors or stem cells. Cancer cell. 2008;14:135–145. doi: 10.1016/j.ccr.2008.07.003. [DOI] [PMC free article] [PubMed] [Google Scholar]
- 29.Fink AJ, et al. Development of the deep cerebellar nuclei: transcription factors and cell migration from the rhombic lip. The Journal of neuroscience : the official journal of the Society for Neuroscience. 2006;26:3066–3076. doi: 10.1523/JNEUROSCI.5203-05.2006. [DOI] [PMC free article] [PubMed] [Google Scholar]
- 30.Chizhikov VV, et al. Lmx1a regulates fates and location of cells originating from the cerebellar rhombic lip and telencephalic cortical hem. Proceedings of the National Academy of Sciences of the United States of America. 2010;107:10725–10730. doi: 10.1073/pnas.0910786107. [DOI] [PMC free article] [PubMed] [Google Scholar]
- 31.Millonig JH, Millen KJ, Hatten ME. The mouse Dreher gene Lmx1a controls formation of the roof plate in the vertebrate CNS. Nature. 2000;403:764–769. doi: 10.1038/35001573. [DOI] [PubMed] [Google Scholar]
- 32.Gilbertson RJ. Mapping cancer origins. Cell. 2011;145:25–29. doi: 10.1016/j.cell.2011.03.019. [DOI] [PMC free article] [PubMed] [Google Scholar]
- 33.Byrd JC, et al. Targeting BTK with ibrutinib in relapsed chronic lymphocytic leukemia. The New England journal of medicine. 2013;369:32–42. doi: 10.1056/NEJMoa1215637. [DOI] [PMC free article] [PubMed] [Google Scholar]
- 34.Hale G, et al. Remission induction in non-Hodgkin lymphoma with reshaped human monoclonal antibody CAMPATH-1H. Lancet. 1988;2:1394–1399. doi: 10.1016/s0140-6736(88)90588-0. [DOI] [PubMed] [Google Scholar]
- 35.Ramsey SA, et al. Genome-wide histone acetylation data improve prediction of mammalian transcription factor binding sites. Bioinformatics. 2010;26:2071–2075. doi: 10.1093/bioinformatics/btq405. [DOI] [PMC free article] [PubMed] [Google Scholar]
- 36.Ni TT, et al. Conditional control of gene function by an invertible gene trap in zebrafish. Proceedings of the National Academy of Sciences of the United States of America. 2012;109:15389–15394. doi: 10.1073/pnas.1206131109. [DOI] [PMC free article] [PubMed] [Google Scholar]
- 37.Robinson G, et al. Novel mutations target distinct subgroups of medulloblastoma. Nature. 2012;488:43–48. doi: 10.1038/nature11213. [DOI] [PMC free article] [PubMed] [Google Scholar]
- 38.Haldipur P, et al. Expression of Sonic hedgehog during cell proliferation in the human cerebellum. Stem Cells Dev. 2012;21:1059–1068. doi: 10.1089/scd.2011.0206. [DOI] [PubMed] [Google Scholar]
- 39.Hovestadt V, et al. Robust molecular subgrouping and copy-number profiling of medulloblastoma from small amounts of archival tumour material using high-density DNA methylation arrays. Acta neuropathologica. 2013;125:913–916. doi: 10.1007/s00401-013-1126-5. [DOI] [PMC free article] [PubMed] [Google Scholar]
- 40.Borodina T, Adjaye J, Sultan M. A strand-specific library preparation protocol for RNA sequencing. Methods in enzymology. 2011;500:79–98. doi: 10.1016/B978-0-12-385118-5.00005-0. [DOI] [PubMed] [Google Scholar]
- 41.Sultan M, et al. A simple strand-specific RNA-Seq library preparation protocol combining the Illumina TruSeq RNA and the dUTP methods. Biochemical and biophysical research communications. 2012;422:643–646. doi: 10.1016/j.bbrc.2012.05.043. [DOI] [PubMed] [Google Scholar]
- 42.van de Werken HJ, et al. 4C technology: protocols and data analysis. Methods Enzymol. 2012;513:89–112. doi: 10.1016/B978-0-12-391938-0.00004-5. [DOI] [PubMed] [Google Scholar]
- 43.Langmead B, Trapnell C, Pop M, Salzberg SL. Ultrafast and memory-efficient alignment of short DNA sequences to the human genome. Genome biology. 2009;10:R25. doi: 10.1186/gb-2009-10-3-r25. [DOI] [PMC free article] [PubMed] [Google Scholar]
- 44.John S, et al. Chromatin accessibility pre-determines glucocorticoid receptor binding patterns. Nature genetics. 2011;43:264–268. doi: 10.1038/ng.759. [DOI] [PMC free article] [PubMed] [Google Scholar]
- 45.Romanoski CE, Glass CK, Stunnenberg HG, Wilson L, Almouzni G. Epigenomics: Roadmap for regulation. Nature. 2015;518:314–316. doi: 10.1038/518314a. [DOI] [PubMed] [Google Scholar]
- 46.Skipper M, et al. Presenting the epigenome roadmap. Nature. 2015;518:313. doi: 10.1038/518313a. [DOI] [PubMed] [Google Scholar]
- 47.Waszak SM, et al. Population Variation and Genetic Control of Modular Chromatin Architecture in Humans. Cell. 2015;162:1039–1050. doi: 10.1016/j.cell.2015.08.001. [DOI] [PubMed] [Google Scholar]
- 48.Vaquerizas JM, Kummerfeld SK, Teichmann SA, Luscombe NM. A census of human transcription factors: function, expression and evolution. Nature reviews. Genetics. 2009;10:252–263. doi: 10.1038/nrg2538. [DOI] [PubMed] [Google Scholar]
- 49.Bindea G, et al. ClueGO: a Cytoscape plug-in to decipher functionally grouped gene ontology and pathway annotation networks. Bioinformatics. 2009;25:1091–1093. doi: 10.1093/bioinformatics/btp101. [DOI] [PMC free article] [PubMed] [Google Scholar]
- 50.Hothorn T, Bretz F, Westfall P. Simultaneous inference in general parametric models. Biometrical journal. Biometrische Zeitschrift. 2008;50:346–363. doi: 10.1002/bimj.200810425. [DOI] [PubMed] [Google Scholar]
- 51.Matys V, et al. TRANSFAC and its module TRANSCompel: transcriptional gene regulation in eukaryotes. Nucleic acids research. 2006;34:D108–110. doi: 10.1093/nar/gkj143. [DOI] [PMC free article] [PubMed] [Google Scholar]
- 52.Grant CE, Bailey TL, Noble WS. FIMO: scanning for occurrences of a given motif. Bioinformatics. 2011;27:1017–1018. doi: 10.1093/bioinformatics/btr064. [DOI] [PMC free article] [PubMed] [Google Scholar]
- 53.Walter C, Schuetzmann D, Rosenbauer F, Dugas M. Basic4Cseq: an R/Bioconductor package for analyzing 4C-seq data. Bioinformatics. 2014;30:3268–3269. doi: 10.1093/bioinformatics/btu497. [DOI] [PubMed] [Google Scholar]
- 54.Bailey TL, et al. MEME SUITE: tools for motif discovery and searching. Nucleic acids research. 2009;37:W202–208. doi: 10.1093/nar/gkp335. [DOI] [PMC free article] [PubMed] [Google Scholar]
- 55.Franceschini A, et al. STRING v9.1: protein-protein interaction networks, with increased coverage and integration. Nucleic acids research. 2013;41:D808–815. doi: 10.1093/nar/gks1094. [DOI] [PMC free article] [PubMed] [Google Scholar]
Associated Data
This section collects any data citations, data availability statements, or supplementary materials included in this article.


