

Abstract
Mesoderm is the developmental precursor to myriad human tissues including bone, heart, and skeletal muscle. Unravelling the molecular events through which these lineages become diversified from one another is integral to developmental biology and understanding changes in cellular fate. To this end, we developed an in vitro system to differentiate human pluripotent stem cells through primitive streak intermediates into paraxial mesoderm and its derivatives (somites, sclerotome, dermomyotome) and separately, into lateral mesoderm and its derivatives (cardiac mesoderm). Whole-population and single-cell analyses of these purified populations of human mesoderm lineages through RNA-seq, ATAC-seq, and high-throughput surface marker screens illustrated how transcriptional changes co-occur with changes in open chromatin and surface marker landscapes throughout human mesoderm development. This molecular atlas will facilitate study of human mesoderm development (which cannot be interrogated in vivo due to restrictions on human embryo studies) and provides a broad resource for the study of gene regulation in development at the single-cell level, knowledge that might one day be exploited for regenerative medicine.
Subject terms: Pluripotency, Differentiation, High-throughput screening, Gene expression analysis
Background & Summary
A longstanding goal of regenerative medicine has been to efficiently differentiate stem cells into pure, functional populations of desired cell types. This has been challenging to achieve in practice: many extant differentiation methods take weeks or months to complete and result in heterogeneous mixtures of the target lineage and other contaminating lineages. Difficulties in differentiating stem cells into desired cell-types in vitro might stem from incomplete knowledge of how stem cells naturally develop into these lineages during the course of embryonic development.
We focus here on human mesoderm development, which starts with the differentiation of pluripotent stem cells into the primitive streak (PS) and then into paraxial and lateral mesoderm1–3. Paraxial mesoderm subsequently buds off into tissue segments known as somites4, with dorsal somites (dermomyotome) giving rise to brown fat, skeletal muscle, and dorsal dermis, and ventral somites (sclerotome) yielding the bone and cartilage of the spine and ribs5. Separately, lateral mesoderm goes on to form limb bud mesoderm6 and cardiac mesoderm7, the latter of which generates cardiomyocytes and other heart constituents.
Our related publication8 delineated a comprehensive roadmap for human mesoderm development that outlined key intermediate stages and defined the minimal combinations of extrinsic signals sufficient to induce differentiation at each stage. To elicit differentiation at defined stages, in addition to identifying the necessary inductive cues at each stage (as is typical), we also identified pathways leading to ‘unwanted’ cell fates and systematically repressed them at each lineage branchpoint. We used this strategy to efficiently differentiate pluripotent stem cells, through anterior and mid primitive streak, into paraxial and lateral mesoderm, and subsequently into somites, sclerotome, dermomytome, and cardiac mesoderm (Fig. 1). The identity and purity of these cell types was respectively assessed by transplantation into mouse models or single-cell gene expression profiling8.
Figure 1. A schematic of human mesoderm development.
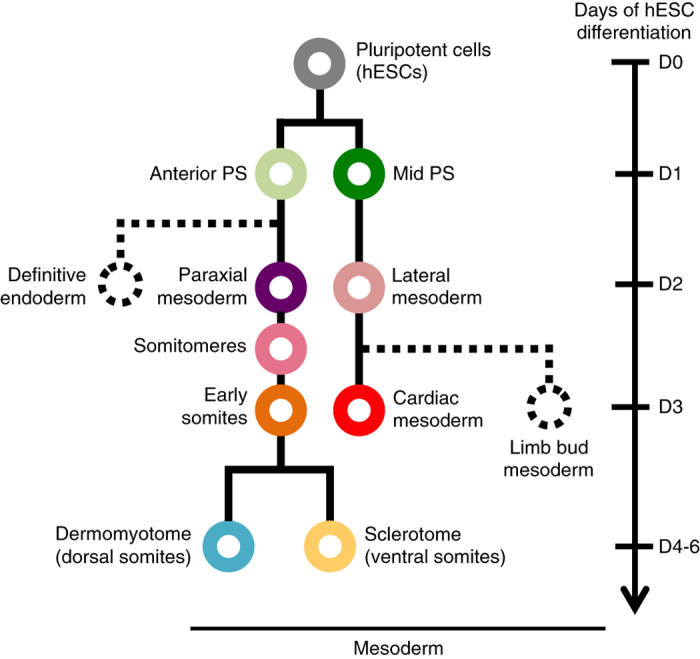
We differentiate and profile each of the 10 cell types shown in color here, starting with pluripotent stem cells and ending in dermomyotome, sclerotome, and cardiac mesoderm.
Here we describe in detail the materials and methods used to generate and profile these distinct cell types, with an eye towards promoting reproducibility and reuse of our data. We focus on the biological methods used to generate the data; the computational pre- and post-processing of the data; and the technical validation of the quality of our data. In contrast, our related publication8 focused on experimentally validating the biological function and purity of the differentiated cell types and on extracting developmental insights from the data.
Our dataset comprises three main types of data -- gene expression, chromatin accessibility, and surface marker expression -- across 10 different cell types (pluripotent stem cells, anterior PS, mid PS, paraxial mesoderm, somitomeres, somites, sclerotome, dermomyotome, lateral mesoderm and cardiac mesoderm). For expression, we performed bulk-population RNA-seq as well as single-cell RNA-seq (using the Fluidigm C1 system) on a total of 651 cells spanning all lineages. Chromatin accessibility across the genome was measured by ATAC-seq9. For each lineage, two to six biological replicates were assayed for bulk-population RNA-seq and ATAC-seq. Finally, the expression of 332 cell-surface markers was ascertained on most lineages by means of high-throughput antibody screening.
Taken together, this dataset will constitute a useful resource for the study of human mesoderm development. For example, this dataset enabled us to identify novel marker genes in somitogenesis (a transient process which cannot be observed in vivo due to restrictions on the use of human embryos); identify the putative cell-of-origin for different subtypes of congenital scoliosis; and infer the activity of transcription factors at each stage of mesodermal development8. The data from the high-throughput surface marker screen will also be helpful in purifying desired cell types for transplantation or further study.
Moreover, we believe that this dataset will be useful as a broader resource for the analysis of a timecourse data, e.g., as a testing ground for algorithms that aim to reconstruct developmental paths from single-cell RNA-seq data10,11, or for the study of how changes in chromatin accessibility are correlated with, and are ultimately causative of, changes in gene expression across developmental time and space.
Methods
We reproduce here the experimental protocols included in our related publication8, with added detail on our computational processing steps, RNA library construction, and surface marker screening. A list of all experiments reported here, together with accession codes of the corresponding data, can be found in Table 1 (available online only).
Table 1. Overall experimental metadata briefly describing each of the data sets available, with links to the appropriate data repository.
| Source (Cell type) | Sample ID | Protocol 1 | Protocol 2 | Protocol 3 | Data |
|---|---|---|---|---|---|
| D0 hESC | H7_hESC_ATAC1 | Nuclei isolation | ATAC-seq | SRR3689759 | |
| D0 hESC | H7_hESC_ATAC2 | Nuclei isolation | ATAC-seq | SRR3689760 | |
| D0 hESC | H7hESC_1 | RNA extraction | Bulk RNA-seq | SRR3439477 | |
| D0 hESC | H7hESC_2 | RNA extraction | Bulk RNA-seq | SRR3439478 | |
| D0 hESC | H7hESC_3 | RNA extraction | Bulk RNA-seq | SRR3439480 | |
| D0 hESC | H7Trzl | RNA extraction | Bulk RNA-seq | SRR3439481 | |
| D0 hESC | multiple | Single-cell capture | Single-cell RNA-seq | SRX1977195 | |
| D0 hESC | H7 hESC | Surface marker screening | 10.6084/m9.figshare.3505817 | ||
| D0 hESC | (processed peak calls) | Nuclei isolation | ATAC-seq | GSM2257291 | |
| D1 Anterior Primitive Streak | APS_ATAC3 | Differentiation | Nuclei isolation | ATAC-seq | SRR3689761 |
| D1 Anterior Primitive Streak | APS_ATAC4 | Differentiation | Nuclei isolation | ATAC-seq | SRR3689762 |
| D1 Anterior Primitive Streak | APS_1 | Differentiation | RNA extraction | Bulk RNA-seq | SRR3439429 |
| D1 Anterior Primitive Streak | APS_2 | Differentiation | RNA extraction | Bulk RNA-seq | SRR3439430 |
| D1 Anterior Primitive Streak | APS_3 | Differentiation | RNA extraction | Bulk RNA-seq | SRR3439431 |
| D1 Anterior Primitive Streak | multiple | Differentiation | Single-cell capture | Single-cell RNA-seq | SRX1977196 |
| D1 Anterior Primitive Streak | Ant Primitive Streak (MIXL1-GFP+) | Differentiation | Surface marker screening | 10.6084/m9.figshare.3505817 | |
| D1 Anterior Primitive Streak | (processed peak calls) | Differentiation | Nuclei isolation | ATAC-seq | GSM2257292 |
| D1 Mid Primitive Streak | MPS_ATAC5 | Differentiation | Nuclei isolation | ATAC-seq | SRR3689763 |
| D1 Mid Primitive Streak | MPS_ATAC6 | Differentiation | Nuclei isolation | ATAC-seq | SRR3689764 |
| D1 Mid Primitive Streak | MPS_1 | Differentiation | RNA extraction | Bulk RNA-seq | SRR3439482 |
| D1 Mid Primitive Streak | MPS_2 | Differentiation | RNA extraction | Bulk RNA-seq | SRR3439485 |
| D1 Mid Primitive Streak | MPS_3 | Differentiation | RNA extraction | Bulk RNA-seq | SRR3439486 |
| D1 Mid Primitive Streak | MPS_4 | Differentiation | RNA extraction | Bulk RNA-seq | SRR3439487 |
| D1 Mid Primitive Streak | multiple | Differentiation | Single-cell capture | Single-cell RNA-seq | SRX1977197 |
| D1 Mid Primitive Streak | (processed peak calls) | Differentiation | Nuclei isolation | ATAC-seq | GSM2257293 |
| D2 DLL1− Paraxial Mesoderm | DLL1nD2nonPXM_1 | Differentiation | RNA extraction | Bulk RNA-seq | SRR3439468 |
| D2 DLL1− Paraxial Mesoderm | DLL1nD2nonPXM_2 | Differentiation | RNA extraction | Bulk RNA-seq | SRR3439469 |
| D2 DLL1+ Paraxial Mesoderm | DLL1pPXm_ATAC7 | Differentiation | Nuclei isolation | ATAC-seq | SRR3689781 |
| D2 DLL1+ Paraxial Mesoderm | DLL1pPXm_ATAC8 | Differentiation | Nuclei isolation | ATAC-seq | SRR3689915 |
| D2 DLL1+ Paraxial Mesoderm | DLL1pPXM_3 | Differentiation | RNA extraction | Bulk RNA-seq | SRR3439471 |
| D2 DLL1+ Paraxial Mesoderm | multiple | Differentiation | Single-cell capture | Single-cell RNA-seq | SRX1977198 |
| D2 DLL1+ Paraxial Mesoderm | DLLpPXM_1 | Differentiation | RNA extraction | Bulk RNA-seq | SRR3439472 |
| D2 DLL1+ Paraxial Mesoderm | DLL1pPXM_2 | Differentiation | RNA extraction | Bulk RNA-seq | SRR3439470 |
| D2 DLL1+ Paraxial Mesoderm | (processed peak calls) | Differentiation | Nuclei isolation | ATAC-seq | GSM2257294 |
| D2 Lateral Mesoderm | D2Ltm_ATAC10 | Differentiation | Nuclei isolation | ATAC-seq | SRR3689918 |
| D2 Lateral Mesoderm | D2Ltm_ATAC9 | Differentiation | Nuclei isolation | ATAC-seq | SRR3689916 |
| D2 Lateral Mesoderm | D2LtM_1 | Differentiation | RNA extraction | Bulk RNA-seq | SRR3439434 |
| D2 Lateral Mesoderm | D2LtM_2 | Differentiation | RNA extraction | Bulk RNA-seq | SRR3439437 |
| D2 Lateral Mesoderm | multiple | Differentiation | Single-cell capture | Single-cell RNA-seq | SRX1977202 |
| D2 Lateral Mesoderm | (processed peak calls) | Differentiation | Nuclei isolation | ATAC-seq | GSM2257298 |
| D2 Paraxial Mesoderm | Paraxial Mesoderm | Differentiation | Surface marker screening | 10.6084/m9.figshare.3505817 | |
| D2.25 Somitomeres | Smtmrs_ATAC21 | Differentiation | Nuclei isolation | ATAC-seq | SRR3689991 |
| D2.25 Somitomeres | Smtmrs_ATAC22 | Differentiation | Nuclei isolation | ATAC-seq | SRR3690220 |
| D2.25 Somitomeres | multiple | Differentiation | Single-cell capture | Single-cell RNA-seq | SRX1977204 |
| D2.25 Somitomeres | (processed peak calls) | Differentiation | Nuclei isolation | ATAC-seq | GSM2257300 |
| D3 Cardiac Mesoderm | Cardiac Mesoderm (NKX2.5-GFP+) | Differentiation | Surface marker screening | 10.6084/m9.figshare.3505817 | |
| D3 Early Somite | ESMT_ATAC13 | Differentiation | Nuclei isolation | ATAC-seq | SRR3689931 |
| D3 Early Somite | ESMT_ATAC14 | Differentiation | Nuclei isolation | ATAC-seq | SRR3689932 |
| D3 Early Somite | Smt_1 | Differentiation | RNA extraction | Bulk RNA-seq | SRR3439490 |
| D3 Early Somite | Smt_2 | Differentiation | RNA extraction | Bulk RNA-seq | SRR3439491 |
| D3 Early Somite | D3EarlySmt_1 | Differentiation | RNA extraction | Bulk RNA-seq | SRR3439438 |
| D3 Early Somite | D3EarlySmt_2 | Differentiation | RNA extraction | Bulk RNA-seq | SRR3439440 |
| D3 Early Somite | multiple | Differentiation | Single-cell capture | Single-cell RNA-seq | SRX1977199 |
| D3 Early Somite | Smt_4 | Differentiation | RNA extraction | Bulk RNA-seq | SRR3439494 |
| D3 Early Somite | Smt_3 | Differentiation | RNA extraction | Bulk RNA-seq | SRR3439493 |
| D3 Early Somite | Early Somite | Differentiation | Surface marker screening | 10.6084/m9.figshare.3505817 | |
| D3 Early Somite | (processed peak calls) | Differentiation | Nuclei isolation | ATAC-seq | GSM2257295 |
| D3 GARP+ Cardiac Mesoderm | D3CrdcM_ATAC15 | Differentiation | Nuclei isolation | ATAC-seq | SRR3689933 |
| D3 GARP+ Cardiac Mesoderm | D3CrdcM_ATAC16 | Differentiation | Nuclei isolation | ATAC-seq | SRR3689934 |
| D3 GARP+ Cardiac Mesoderm | D3GARPpCrdcM_1 | Differentiation | RNA extraction | Bulk RNA-seq | SRR3439441 |
| D3 GARP+ Cardiac Mesoderm | D3GARPpCrdcM_2 | Differentiation | RNA extraction | Bulk RNA-seq | SRR3439442 |
| D3 GARP+ Cardiac Mesoderm | multiple | Differentiation | Single-cell capture | Single-cell RNA-seq | SRX1977203 |
| D3 GARP+ Cardiac Mesoderm | (processed peak calls) | Differentiation | Nuclei isolation | ATAC-seq | GSM2257299 |
| D5 Dermomyotome | Drmmtm_ATAC19 | Differentiation | Nuclei isolation | ATAC-seq | SRR3689935 |
| D5 Dermomyotome | Drmmtm_ATAC20 | Differentiation | Nuclei isolation | ATAC-seq | SRR3689936 |
| D5 Dermomyotome | Drmmtm_1 | Differentiation | RNA extraction | Bulk RNA-seq | SRR3439474 |
| D5 Dermomyotome | Drmmtm_2 | Differentiation | RNA extraction | Bulk RNA-seq | SRR3439475 |
| D5 Dermomyotome | D5CentralDrmmtm | Differentiation | RNA extraction | Bulk RNA-seq | SRR3439443 |
| D5 Dermomyotome | multiple | Differentiation | Single-cell capture | Single-cell RNA-seq | SRX1977201 |
| D5 Dermomyotome | Drmmtm_3 | Differentiation | RNA extraction | Bulk RNA-seq | SRR3439476 |
| D5 Dermomyotome | Dermomyotome | Differentiation | Surface marker screening | 10.6084/m9.figshare.3505817 | |
| D5 Dermomyotome | (processed peak calls) | Differentiation | Nuclei isolation | ATAC-seq | GSM2257297 |
| D6 PDGFRA+ Sclerotome | D6Sclrtm_ATAC11 | Differentiation | Nuclei isolation | ATAC-seq | SRR3689921 |
| D6 PDGFRA+ Sclerotome | D6Sclrtm_ATAC12 | Differentiation | Nuclei isolation | ATAC-seq | SRR3689923 |
| D6 PDGFRA+ Sclerotome | Sclrtm_1 | Differentiation | RNA extraction | Bulk RNA-seq | SRR3439488 |
| D6 PDGFRA+ Sclerotome | Sclrtm_2 | Differentiation | RNA extraction | Bulk RNA-seq | SRR3439489 |
| D6 PDGFRA+ Sclerotome | D6PDGFRApSclrtm_1 | Differentiation | RNA extraction | Bulk RNA-seq | SRR3439456 |
| D6 PDGFRA+ Sclerotome | multiple | Differentiation | Single-cell capture | Single-cell RNA-seq | SRX1977200 |
| D6 PDGFRA+ Sclerotome | (processed peak calls) | Differentiation | Nuclei isolation | ATAC-seq | GSM2257296 |
| D6 Sclerotome | Sclerotome | Differentiation | Surface marker screening | 10.6084/m9.figshare.3505817 |
Bulk-population RNA-seq
RNA extraction, library preparation and sequencing
For bulk-population RNA-seq, RNA was extracted from either whole cell populations or alternatively, cell subsets purified by fluorescence activated cell sorting (FACS). In brief, RNA was obtained from undifferentiated H7 hESCs (day 0 of in vitro differentiation), H7-derived anterior primitive streak populations (day 1), H7-derived mid primitive streak populations (day 1), H7-derived lateral mesoderm (day 2), H7-derived FACS-purified GARP+ cardiac mesoderm (day 3), H7-derived FACS-purified DLL1+ paraxial mesoderm populations (day 2), H7-derived day 3 early somite progenitor populations (day 3), H7-derived dermomyotome populations (day 5, treated with BMP4+CHIR99021+Vismodegib on days 4–5), and H7-derived FACS-purified PDGFRα+ sclerotome populations (day 6).
Total RNA from the above cell populations was isolated using Trizol (Thermo Fisher) as per the manufacturer's recommendations, with the additional use of linear polyacrylamide (Sigma) as a carrier to facilitate RNA precipitation. Purified total RNA was treated with 4 units of RQ1 RNase-free DNase (Promega) at 37 degrees Celsius for 1 h to remove trace amounts of genomic DNA. The DNase-treated total RNA was cleaned-up using the RNeasy Micro Kit (Qiagen). Subsequently, the integrity of extracted RNA was assayed by on-chip electrophoresis (Agilent Bioanalyzer) and only samples with a high RNA integrity (RIN) value were used for subsequent cDNA library preparation.
Purified total RNA (10–50 ng) was reverse-transcribed into cDNA and amplified using the Ovation RNA-seq System V2 (NuGEN). Amplified cDNA was sheared using the Covaris S2 (Covaris) with the following settings: total volume 120 μl, duty cycle 10%, intensity 5, cycle/burst 100 and total time 2 min. The sheared cDNA was cleaned up using Agencourt Ampure XP beads (Beckman Coulter) to obtain cDNA fragments >=400 base pairs (bp). 500 ng of sheared and size-selected cDNA was used as input for library preparation using the NEBNext Ultra DNA Library Prep Kit for Illumina (New England BioLabs) as per the manufacturer's recommendations. Resulting libraries (fragment distribution: 300–700 bp; peak 500–550 bp) were pooled (multiplexed) and sequenced using either a HiSeq 4000 or NextSeq 500 (Illumina) at the Stanford Functional Genomics Facility to obtain 2×150 bp paired-end reads. For each RNA-seq library, the effectiveness of adapter ligation and the effective library concentration was determined by qPCR and Bioanalyzer (Agilent) prior to pooling and loading them onto the sequencers.
Each sample in our data constitutes a separate biological replicate. Bulk population RNA-seq libraries were prepared in three batches (Table 2).
Table 2. Bulk-population RNA-seq metadata and mapping statistics.
| Sample ID | Celltype | Batch | Number of uniquely mapped reads | Percentage of uniquely mapping reads |
|---|---|---|---|---|
| H7hESC_1 | D0 H7 hESC | 1 | 29077933 | 77.64 |
| H7hESC_2 | D0 H7 hESC | 1 | 32593810 | 72.39 |
| H7hESC_3 | D0 H7 hESC | 1 | 30800393 | 74.51 |
| H7Trzl | D0 H7 hESC | 3 | 60399642 | 76.01 |
| APS_1 | D1 Anterior Primitive Streak | 1 | 29444532 | 71.43 |
| APS_2 | D1 Anterior Primitive Streak | 1 | 30585671 | 72.73 |
| APS_3 | D1 Anterior Primitive Streak | 3 | 62559303 | 74.76 |
| MPS_1 | D1 Mid Primitive Streak | 1 | 32195105 | 74.5 |
| MPS_2 | D1 Mid Primitive Streak | 1 | 29668483 | 76.07 |
| MPS_3 | D1 Mid Primitive Streak | 3 | 64236835 | 73.91 |
| MPS_4 | D1 Mid Primitive Streak | 3 | 76385886 | 72.9 |
| DLL1nD2nonPXM_1 | D2 DLL1− Paraxial Mesoderm | 2 | 28555523 | 64.46 |
| DLL1nD2nonPXM_2 | D2 DLL1− Paraxial Mesoderm | 2 | 24999466 | 66.51 |
| DLL1pPXM_3 | D2 DLL1+ Paraxial Mesoderm | 2 | 11948788 | 50.27 |
| DLLpPXM_1 | D2 DLL1+ Paraxial Mesoderm | 2 | 29595403 | 73.74 |
| DLL1pPXM_2 | D2 DLL1+ Paraxial Mesoderm | 2 | 25504394 | 71.61 |
| D2LtM_1 | D2 Lateral Mesoderm | 3 | 79623847 | 72.3 |
| D2LtM_2 | D2 Lateral Mesoderm | 3 | 85281213 | 70.89 |
| D3GARPpCrdcM_1 | D3 GARP+ Cardiac Mesoderm | 3 | 87530457 | 69.6 |
| D3GARPpCrdcM_2 | D3 GARP+ Cardiac Mesoderm | 3 | 94587346 | 74.36 |
| Smt_1 | D3 Somite | 1 | 15272975 | 57.37 |
| Smt_2 | D3 Somite | 1 | 24702016 | 60.63 |
| D3EarlySmt_1 | D3 Somite | 3 | 60723730 | 65.19 |
| D3EarlySmt_2 | D3 Somite | 3 | 64467176 | 64.97 |
| Smt_4 | D3 Somite | 2 | 14235841 | 62.14 |
| Smt_3 | D3 Somite | 2 | 20701016 | 62.06 |
| Drmmtm_1 | D5 Dermomyotome | 1 | 32318123 | 73.43 |
| Drmmtm_2 | D5 Dermomyotome | 1 | 18890789 | 63.49 |
| D5CentralDrmmtm | D5 Dermomyotome | 3 | 126799726 | 69.06 |
| Drmmtm_3 | D5 Dermomyotome | 2 | 10583923 | 65.92 |
| Sclrtm_1 | D6 PDGFRA+ Sclerotome | 1 | 20751549 | 58.61 |
| Sclrtm_2 | D6 PDGFRA+ Sclerotome | 1 | 23117071 | 66.89 |
| D6PDGFRApSclrtm_1 | D6 PDGFRA+ Sclerotome | 3 | 102352286 | 74.86 |
Quantification and processing
Obtained RNA-seq reads were trimmed for base call quality (PHRED score >=21) and for adapter sequences (using Skewer12), and then were subsequently processed using a slightly-modified version of the ENCODE long RNA-seq pipeline for quantification of mRNA expression (https://www.encodeproject.org/rna-seq/long-rnas/)13. Specifically, reads were aligned to hg38 using STAR 2.4 (ref. 14); gene-level expression was then quantified using RSEM 1.2.21 (ref. 15). We only kept samples with at least 10,000,000 uniquely mapping reads and with at least 50% of reads uniquely mapping, which meant rejecting one sample (from sclerotome) out of 34. The numbers and percentages of uniquely mapping reads for each sample are listed in Table 2. The full parameter settings used can be found in our versions of
STAR_RSEM.sh
and
STAR_RSEM_prep.py
(see Code Availability below).
To facilitate global comparisons of gene expression levels across cell types, we first took the log2TPM (transcripts per million) values for each gene, before filtering out all genes where there was a difference of less than 2 (in log2TPM units, i.e., a 4-fold difference in expression) between the cell types with the highest and lowest expression. Next, we used ComBat with non-parametric priors16 (as implemented through the sva R package17) to correct for batch effects. This sometimes left small negative values for the expression of some genes, which we set to 0. The R Markdown script implementing this batch correction is
bulkDataViz.Rmd
.
For ease of use, we also prepared a spreadsheet with TPM values for each gene, augmented with the following information on each gene: 1) whether the gene product is present on the cell surface (GO code GO:0009986); 2) for each pair of adjacent conditions, whether the gene was differentially expressed between those conditions; and 3) the shrunken log-fold-change for that gene between those conditions. We provide (1) as a convenience to help in finding potential surface markers that were not included in our high-throughput screen (e.g., because an antibody was not available). (2) and (3) were calculated by DESeq2 (ref. 18) using batch information; genes were called as differentially expressed at a false discovery rate (FDR) of 0.1.
The raw data from the bulk-population RNA-seq can be found in [Data Citation 1]. A spreadsheet of TPM values can be found in [Data Citation 2]. The annotated spreadsheet, as described in the previous paragraph, is in [Data Citation 3].
Single-cell RNA-seq
Library preparation and sequencing
Cells were briefly washed (DMEM/F12), dissociated (TrypLE Express), strained (100 μm filter), pelleted and re-suspended in DMEM/F12 for counting. Before single-cell capture, two quality control steps were implemented. First, cell size was estimated in order to determine whether cells should be loaded onto C1 capture arrays of either 10–17 μm or 17–25 μm size. Arrays were chosen for each lineage by estimating the median cell size of each given population on a flow cytometer on the basis of the FSC-W signal19 and choosing an array with an appropriate pore size to accommodate such cells. Second, to ensure the high viability of in vitro-differentiated cells prior to commencing single-cell RNA-seq, for each population a separate aliquot of cells was stained with 1.1 μM DAPI and analyzed by flow cytometry; for all cell populations that were used for single-cell RNA-seq, >98% of cells were viable (i.e., DAPI negative).
For single-cell capture, cells were diluted to a concentration of 1000 cells per μl, diluted in a 3:2 mixture of C1 Cell Suspension Reagent and DMEM/F12, and then loaded onto a Fluidigm C1 single-cell capture array chip for automated capture on a Fluidigm C1 Machine (Stanford Stem Cell Institute Genomics Core). 10–17 μm array chips were used for hESCs, day 1 anterior PS, day 2 sorted DLL1+ paraxial mesoderm, day 2.25 somitomeres, day 3 early somites, day 2 lateral mesoderm, day 3 sorted GARP+ cardiac mesoderm, day 5 central dermomyotome, and day 6 sorted PDGFRA+ sclerotome while a 17–25 μm array chip was used for day 1 mid PS.
After loading, the efficiency of single-cell capture was verified using an automated microscope that imaged each captured cell on the chip. Subsequent cell lysis, cDNA synthesis, and amplification was executed within each microfluidic chamber in the array chip in an automated fashion with the Fluidigm C1 machine using the reagents from SMARTer Ultra Low RNA Kit (Clontech, 634833), as per the manufacturers' instructions (Fluidigm, PN 100–7168 Rev. A2). The amplified cDNA from individual cells was harvested into a nuclease-free 96-well plate and diluted using the C1 harvesting reagent (Fluidigm). The concentration and integrity of amplified cDNA were assessed using a Fragment Analyzer (Advanced Analytical) in 96-well plate format. Amplified cDNAs from only those wells that (1) were not degraded and (2) originated from wells that were microscopically verified manually to contain a single cell, were carried forward for subsequent library construction. It is important to note that because of manual verification, we were able to effectively rule out doublets if captured in the medium (10–17 μm) or the large (17–25 μm) array chips.
A single-channel liquid handling robot, Mosquito X1(TTP Labtech), was used to simultaneously, 1) dilute amplified cDNAs from single cells from all lineages to a concentration range of 0.05–0.16 ng per μl with C1 Harvest Reagent (Fluidigm) as a diluent and 2) consolidate the diluted cDNA into 384 well plates. The diluted single-cell cDNAs were tagmented and converted to sequencing libraries in the 384 well plates using the Nextera XT DNA Sample Prep Kit (Illumina, FC-131–1096) in an automated fashion using another 16-channel pipetting robot, Mosquito HTS (TTP Labtech), and 384 distinct Illumina-compatible molecular barcodes. The resulting sequencing libraries from a single such 384 well plate were then pooled and cleaned up using Agencourt AMPure XP beads (Beckman Coulter). The pooled libraries were then analyzed for quality and concentration using Bioanalyzer (Agilent) and qPCR and loaded on a single lane of NextSeq 500 or two lanes of HiSeq 4000 to obtain 1–2 million 2×150 bp reads per cell. The reads obtained were trimmed for base call quality (PHRED score >=21) and the presence of adapter sequences using Skewer12.
Quantification and processing
We quantified single-cell gene expression using the ENCODE long RNA-seq pipeline (with the same parameter settings as employed for analysis of bulk-population RNA-seq). We only kept samples with at least 1 million uniquely mapped reads and at least 70% of reads uniquely mapping, which meant keeping data from 498 single cells out of 651. The numbers and percentages of uniquely mapping reads for each cell are listed in Table 3 (available online only).
Table 3. Single-cell RNA-seq metadata and mapping statistics.
| Sample ID | Number of uniquely mapped reads | Percentage of uniquely mapping reads | Included in analysis? |
|---|---|---|---|
| APS-p1c10r1 | 1496268 | 81.21 | TRUE |
| APS-p1c10r3 | 1635980 | 79.9 | TRUE |
| APS-p1c10r4 | 1462666 | 79.58 | TRUE |
| APS-p1c10r6 | 1015763 | 79.94 | TRUE |
| APS-p1c10r7 | 1649241 | 80.35 | TRUE |
| APS-p1c10r8 | 631285 | 79.63 | FALSE |
| APS-p1c11r2 | 2006570 | 79.83 | TRUE |
| APS-p1c11r3 | 1571051 | 80.36 | TRUE |
| APS-p1c11r6 | 1595606 | 80.29 | TRUE |
| APS-p1c11r7 | 1611080 | 80.05 | TRUE |
| APS-p1c12r2 | 1910166 | 80.12 | TRUE |
| APS-p1c12r3 | 1453044 | 81.01 | TRUE |
| APS-p1c12r4 | 1662275 | 80.47 | TRUE |
| APS-p1c12r5 | 1804505 | 80.55 | TRUE |
| APS-p1c12r6 | 1810735 | 76.06 | TRUE |
| APS-p1c12r7 | 2065268 | 79.42 | TRUE |
| APS-p1c1r2 | 1727374 | 80.73 | TRUE |
| APS-p1c1r5 | 1756430 | 80.18 | TRUE |
| APS-p1c1r8 | 1569290 | 77.97 | TRUE |
| APS-p1c2r1 | 885464 | 80.93 | FALSE |
| APS-p1c2r2 | 1926022 | 80.48 | TRUE |
| APS-p1c2r3 | 1941685 | 80.73 | TRUE |
| APS-p1c2r4 | 1700490 | 79.24 | TRUE |
| APS-p1c2r6 | 1614915 | 79.99 | TRUE |
| APS-p1c2r7 | 543563 | 76.21 | FALSE |
| APS-p1c3r1 | 1600354 | 81.01 | TRUE |
| APS-p1c3r3 | 1101602 | 81.42 | TRUE |
| APS-p1c3r4 | 1620729 | 80.95 | TRUE |
| APS-p1c3r5 | 1809789 | 80.39 | TRUE |
| APS-p1c3r6 | 1820410 | 80.26 | TRUE |
| APS-p1c4r2 | 1870031 | 80.81 | TRUE |
| APS-p1c4r5 | 1767798 | 79.67 | TRUE |
| APS-p1c4r6 | 1525333 | 79.93 | TRUE |
| APS-p1c4r7 | 1816027 | 80.58 | TRUE |
| APS-p1c4r8 | 1821569 | 80.37 | TRUE |
| APS-p1c5r1 | 1800248 | 81.67 | TRUE |
| APS-p1c5r2 | 1891607 | 81.05 | TRUE |
| APS-p1c5r3 | 1492013 | 80.99 | TRUE |
| APS-p1c5r4 | 1730157 | 80.21 | TRUE |
| APS-p1c5r7 | 1701332 | 80.69 | TRUE |
| APS-p1c5r8 | 1812781 | 80.93 | TRUE |
| APS-p1c6r2 | 2181845 | 80.94 | TRUE |
| APS-p1c6r3 | 1308024 | 81.28 | TRUE |
| APS-p1c6r4 | 1733343 | 80.84 | TRUE |
| APS-p1c6r5 | 1421945 | 77.27 | TRUE |
| APS-p1c6r6 | 1719273 | 80.1 | TRUE |
| APS-p1c6r8 | 1911832 | 74.68 | TRUE |
| APS-p1c7r2 | 1545812 | 81.26 | TRUE |
| APS-p1c7r3 | 1524138 | 80.8 | TRUE |
| APS-p1c7r4 | 1072955 | 80.44 | TRUE |
| APS-p1c7r5 | 1526998 | 80.09 | TRUE |
| APS-p1c7r6 | 1577051 | 79.48 | TRUE |
| APS-p1c7r8 | 840333 | 76.82 | FALSE |
| APS-p1c8r1 | 1787534 | 81.16 | TRUE |
| APS-p1c8r3 | 1353928 | 80.91 | TRUE |
| APS-p1c8r4 | 1607464 | 80.79 | TRUE |
| APS-p1c8r5 | 1536405 | 80.24 | TRUE |
| APS-p1c8r8 | 418551 | 72.48 | FALSE |
| APS-p1c9r1 | 1406401 | 80.75 | TRUE |
| APS-p1c9r2 | 1706509 | 81.23 | TRUE |
| APS-p1c9r3 | 1194409 | 81.22 | TRUE |
| APS-p1c9r4 | 1679021 | 80.14 | TRUE |
| APS-p1c9r6 | 1484868 | 80.4 | TRUE |
| APS-p1c9r7 | 1760868 | 79.9 | TRUE |
| cDM-p4c10r1 | 2019689 | 81.41 | TRUE |
| cDM-p4c10r2 | 1965420 | 80.01 | TRUE |
| cDM-p4c10r4 | 1870848 | 81.12 | TRUE |
| cDM-p4c10r5 | 1884639 | 81.67 | TRUE |
| cDM-p4c10r6 | 1847885 | 81.15 | TRUE |
| cDM-p4c11r1 | 1911203 | 79.96 | TRUE |
| cDM-p4c11r3 | 1717116 | 81.56 | TRUE |
| cDM-p4c11r5 | 1662303 | 80.64 | TRUE |
| cDM-p4c11r7 | 2072860 | 80.03 | TRUE |
| cDM-p4c11r8 | 1910380 | 81.22 | TRUE |
| cDM-p4c12r2 | 1915054 | 80.57 | TRUE |
| cDM-p4c12r3 | 1933069 | 79.73 | TRUE |
| cDM-p4c12r4 | 1817113 | 81.03 | TRUE |
| cDM-p4c12r5 | 1996977 | 81.25 | TRUE |
| cDM-p4c12r6 | 2111421 | 82.11 | TRUE |
| cDM-p4c12r7 | 2230099 | 79.93 | TRUE |
| cDM-p4c1r1 | 1828075 | 79.63 | TRUE |
| cDM-p4c1r2 | 1994440 | 80.47 | TRUE |
| cDM-p4c1r3 | 1984577 | 80.11 | TRUE |
| cDM-p4c1r4 | 1978378 | 81.57 | TRUE |
| cDM-p4c1r5 | 1894520 | 80.67 | TRUE |
| cDM-p4c1r7 | 2191642 | 80.94 | TRUE |
| cDM-p4c1r8 | 1889495 | 79.06 | TRUE |
| cDM-p4c2r2 | 1838478 | 79.98 | TRUE |
| cDM-p4c2r3 | 1829101 | 80.64 | TRUE |
| cDM-p4c2r4 | 1876122 | 80.46 | TRUE |
| cDM-p4c2r5 | 1757262 | 80.67 | TRUE |
| cDM-p4c2r6 | 1779703 | 80.34 | TRUE |
| cDM-p4c2r7 | 2062879 | 81.3 | TRUE |
| cDM-p4c3r1 | 1904076 | 80.17 | TRUE |
| cDM-p4c3r3 | 1995857 | 78.14 | TRUE |
| cDM-p4c3r6 | 1762614 | 80.09 | TRUE |
| cDM-p4c3r8 | 2011670 | 80.68 | TRUE |
| cDM-p4c4r1 | 1746007 | 80.77 | TRUE |
| cDM-p4c4r2 | 1748403 | 80.22 | TRUE |
| cDM-p4c4r3 | 1765581 | 81.91 | TRUE |
| cDM-p4c4r4 | 1741191 | 79.69 | TRUE |
| cDM-p4c4r5 | 1817639 | 80.9 | TRUE |
| cDM-p4c4r6 | 1655302 | 79.89 | TRUE |
| cDM-p4c4r8 | 2141525 | 80.15 | TRUE |
| cDM-p4c5r2 | 1932752 | 80.97 | TRUE |
| cDM-p4c5r3 | 1829667 | 79.91 | TRUE |
| cDM-p4c5r6 | 1657866 | 81.54 | TRUE |
| cDM-p4c5r7 | 1936430 | 78.26 | TRUE |
| cDM-p4c6r2 | 1862491 | 80.72 | TRUE |
| cDM-p4c6r3 | 1869951 | 81.21 | TRUE |
| cDM-p4c6r7 | 1993252 | 77.67 | TRUE |
| cDM-p4c7r1 | 1788721 | 80.26 | TRUE |
| cDM-p4c7r3 | 1745311 | 81.19 | TRUE |
| cDM-p4c7r4 | 1583398 | 80.37 | TRUE |
| cDM-p4c7r5 | 1867644 | 80.28 | TRUE |
| cDM-p4c7r6 | 1437072 | 82.28 | TRUE |
| cDM-p4c7r7 | 1973276 | 81.6 | TRUE |
| cDM-p4c7r8 | 2539638 | 80.51 | TRUE |
| cDM-p4c8r1 | 2232466 | 80.51 | TRUE |
| cDM-p4c8r2 | 1924463 | 80.94 | TRUE |
| cDM-p4c8r3 | 1966729 | 79.69 | TRUE |
| cDM-p4c8r4 | 1833986 | 81.25 | TRUE |
| cDM-p4c8r6 | 1739467 | 81.13 | TRUE |
| cDM-p4c8r7 | 1702524 | 80.64 | TRUE |
| cDM-p4c9r1 | 2089258 | 80.94 | TRUE |
| cDM-p4c9r2 | 1599948 | 79.86 | TRUE |
| cDM-p4c9r3 | 1817174 | 79.3 | TRUE |
| cDM-p4c9r4 | 1992609 | 80.64 | TRUE |
| cDM-p4c9r5 | 1983037 | 80.94 | TRUE |
| cDM-p4c9r6 | 1726058 | 81.48 | TRUE |
| cDM-p4c9r7 | 1961458 | 81.39 | TRUE |
| D2_25somitomere-p9c10r2 | 1523221 | 83.23 | TRUE |
| D2_25somitomere-p9c10r3 | 1281308 | 82.57 | TRUE |
| D2_25somitomere-p9c10r4 | 1169199 | 82.93 | TRUE |
| D2_25somitomere-p9c10r5 | 40654 | 78.75 | FALSE |
| D2_25somitomere-p9c10r6 | 1489521 | 83.89 | TRUE |
| D2_25somitomere-p9c10r7 | 1493339 | 82.92 | TRUE |
| D2_25somitomere-p9c10r8 | 1351704 | 83.22 | TRUE |
| D2_25somitomere-p9c11r1 | 1014330 | 83.67 | TRUE |
| D2_25somitomere-p9c11r2 | 1444322 | 83.34 | TRUE |
| D2_25somitomere-p9c11r3 | 1209061 | 81.38 | TRUE |
| D2_25somitomere-p9c11r4 | 1236037 | 82.49 | TRUE |
| D2_25somitomere-p9c11r6 | 1422020 | 81.21 | TRUE |
| D2_25somitomere-p9c11r7 | 1519685 | 83.89 | TRUE |
| D2_25somitomere-p9c11r8 | 1437974 | 83.12 | TRUE |
| D2_25somitomere-p9c12r1 | 1123428 | 82.9 | TRUE |
| D2_25somitomere-p9c12r2 | 1249940 | 82.57 | TRUE |
| D2_25somitomere-p9c12r3 | 1092531 | 81.6 | TRUE |
| D2_25somitomere-p9c12r4 | 1323472 | 83.09 | TRUE |
| D2_25somitomere-p9c12r5 | 720869 | 79.78 | FALSE |
| D2_25somitomere-p9c12r6 | 1464125 | 83.25 | TRUE |
| D2_25somitomere-p9c12r7 | 1381278 | 83.13 | TRUE |
| D2_25somitomere-p9c1r1 | 1258841 | 82.63 | TRUE |
| D2_25somitomere-p9c1r2 | 1361435 | 83.28 | TRUE |
| D2_25somitomere-p9c1r3 | 1072989 | 83.87 | TRUE |
| D2_25somitomere-p9c1r5 | 1142438 | 83.3 | TRUE |
| D2_25somitomere-p9c1r7 | 1571532 | 83.97 | TRUE |
| D2_25somitomere-p9c2r1 | 1392293 | 83.59 | TRUE |
| D2_25somitomere-p9c2r2 | 1381840 | 82.08 | TRUE |
| D2_25somitomere-p9c2r3 | 861177 | 81.35 | FALSE |
| D2_25somitomere-p9c2r4 | 1255387 | 83.14 | TRUE |
| D2_25somitomere-p9c2r5 | 1126615 | 82.97 | TRUE |
| D2_25somitomere-p9c2r6 | 1184860 | 82.84 | TRUE |
| D2_25somitomere-p9c2r7 | 1363339 | 82.25 | TRUE |
| D2_25somitomere-p9c2r8 | 1132088 | 83.75 | TRUE |
| D2_25somitomere-p9c3r1 | 1124784 | 79.67 | TRUE |
| D2_25somitomere-p9c3r2 | 1419998 | 83.21 | TRUE |
| D2_25somitomere-p9c3r3 | 663489 | 81.92 | FALSE |
| D2_25somitomere-p9c3r4 | 1256006 | 84.04 | TRUE |
| D2_25somitomere-p9c3r5 | 871952 | 81.84 | FALSE |
| D2_25somitomere-p9c3r6 | 1200864 | 81.86 | TRUE |
| D2_25somitomere-p9c4r1 | 1444673 | 83.59 | TRUE |
| D2_25somitomere-p9c4r2 | 1610883 | 82.27 | TRUE |
| D2_25somitomere-p9c4r3 | 1297370 | 81.6 | TRUE |
| D2_25somitomere-p9c4r4 | 1343121 | 82.28 | TRUE |
| D2_25somitomere-p9c4r5 | 1572373 | 82.5 | TRUE |
| D2_25somitomere-p9c4r6 | 1847242 | 81.79 | TRUE |
| D2_25somitomere-p9c4r7 | 1350912 | 82.4 | TRUE |
| D2_25somitomere-p9c5r1 | 1412254 | 82.56 | TRUE |
| D2_25somitomere-p9c5r2 | 1548146 | 81.79 | TRUE |
| D2_25somitomere-p9c5r3 | 1136419 | 80.33 | TRUE |
| D2_25somitomere-p9c5r4 | 1237110 | 82.51 | TRUE |
| D2_25somitomere-p9c5r5 | 1461058 | 82.54 | TRUE |
| D2_25somitomere-p9c5r6 | 1528959 | 83.1 | TRUE |
| D2_25somitomere-p9c5r7 | 1611756 | 83.15 | TRUE |
| D2_25somitomere-p9c5r8 | 1349367 | 83.32 | TRUE |
| D2_25somitomere-p9c6r1 | 1050349 | 83.15 | TRUE |
| D2_25somitomere-p9c6r2 | 839879 | 82.34 | FALSE |
| D2_25somitomere-p9c6r3 | 1105600 | 81.23 | TRUE |
| D2_25somitomere-p9c6r4 | 914458 | 83.24 | FALSE |
| D2_25somitomere-p9c6r5 | 1326280 | 83.65 | TRUE |
| D2_25somitomere-p9c6r6 | 1204228 | 80.85 | TRUE |
| D2_25somitomere-p9c6r7 | 1024907 | 80.51 | TRUE |
| D2_25somitomere-p9c6r8 | 993224 | 81.11 | FALSE |
| D2_25somitomere-p9c7r1 | 1147234 | 82.9 | TRUE |
| D2_25somitomere-p9c7r2 | 496473 | 82.5 | FALSE |
| D2_25somitomere-p9c7r3 | 1473842 | 82.22 | TRUE |
| D2_25somitomere-p9c7r4 | 888574 | 80.67 | FALSE |
| D2_25somitomere-p9c7r5 | 1187268 | 83.82 | TRUE |
| D2_25somitomere-p9c7r6 | 1196961 | 82.93 | TRUE |
| D2_25somitomere-p9c7r7 | 1311356 | 82.88 | TRUE |
| D2_25somitomere-p9c7r8 | 1573973 | 80.19 | TRUE |
| D2_25somitomere-p9c8r1 | 1596476 | 80.48 | TRUE |
| D2_25somitomere-p9c8r2 | 1004266 | 82.24 | TRUE |
| D2_25somitomere-p9c8r3 | 1259905 | 80.02 | TRUE |
| D2_25somitomere-p9c8r4 | 729526 | 79.27 | FALSE |
| D2_25somitomere-p9c8r5 | 1457363 | 83.58 | TRUE |
| D2_25somitomere-p9c8r6 | 1550426 | 82.39 | TRUE |
| D2_25somitomere-p9c8r7 | 1400347 | 82.37 | TRUE |
| D2_25somitomere-p9c8r8 | 1504859 | 82.74 | TRUE |
| D2_25somitomere-p9c9r1 | 1100181 | 81.06 | TRUE |
| D2_25somitomere-p9c9r2 | 1413423 | 82.7 | TRUE |
| D2_25somitomere-p9c9r3 | 1304785 | 82.72 | TRUE |
| D2_25somitomere-p9c9r4 | 1314260 | 82.47 | TRUE |
| D2_25somitomere-p9c9r5 | 1235620 | 82.91 | TRUE |
| D2_25somitomere-p9c9r6 | 1486911 | 82.98 | TRUE |
| D2_25somitomere-p9c9r7 | 1338839 | 82.78 | TRUE |
| D2_25somitomere-p9c9r8 | 1379544 | 83.4 | TRUE |
| DLL1PXM-p8c10r1 | 3999241 | 75.5 | TRUE |
| DLL1PXM-p8c10r2 | 3788265 | 75.88 | TRUE |
| DLL1PXM-p8c10r3 | 2031405 | 79.22 | TRUE |
| DLL1PXM-p8c10r4 | 1325684 | 81.3 | TRUE |
| DLL1PXM-p8c10r6 | 1205931 | 82.67 | TRUE |
| DLL1PXM-p8c10r7 | 1366471 | 82.66 | TRUE |
| DLL1PXM-p8c10r8 | 1375044 | 82.09 | TRUE |
| DLL1PXM-p8c11r2 | 3714947 | 74.72 | TRUE |
| DLL1PXM-p8c11r3 | 1981586 | 79.89 | TRUE |
| DLL1PXM-p8c11r4 | 1319333 | 81.84 | TRUE |
| DLL1PXM-p8c11r5 | 1232579 | 82.76 | TRUE |
| DLL1PXM-p8c11r7 | 1390915 | 82.28 | TRUE |
| DLL1PXM-p8c11r8 | 1401231 | 82.85 | TRUE |
| DLL1PXM-p8c12r2 | 2980869 | 75.57 | TRUE |
| DLL1PXM-p8c12r3 | 1429174 | 81.76 | TRUE |
| DLL1PXM-p8c12r4 | 1208221 | 82.74 | TRUE |
| DLL1PXM-p8c12r5 | 1252460 | 81.07 | TRUE |
| DLL1PXM-p8c12r6 | 906562 | 82.4 | FALSE |
| DLL1PXM-p8c1r1 | 3526553 | 75.99 | TRUE |
| DLL1PXM-p8c1r2 | 3325434 | 76.19 | TRUE |
| DLL1PXM-p8c1r3 | 1078123 | 79.54 | TRUE |
| DLL1PXM-p8c1r4 | 1643660 | 80.34 | TRUE |
| DLL1PXM-p8c1r6 | 1399270 | 81.6 | TRUE |
| DLL1PXM-p8c1r7 | 1239893 | 83.18 | TRUE |
| DLL1PXM-p8c1r8 | 1237398 | 82.31 | TRUE |
| DLL1PXM-p8c2r1 | 3629648 | 76.36 | TRUE |
| DLL1PXM-p8c2r2 | 3978623 | 73.86 | TRUE |
| DLL1PXM-p8c2r3 | 1577386 | 76.8 | TRUE |
| DLL1PXM-p8c2r4 | 1582398 | 81.74 | TRUE |
| DLL1PXM-p8c2r5 | 1156589 | 82.48 | TRUE |
| DLL1PXM-p8c2r6 | 1361632 | 83.53 | TRUE |
| DLL1PXM-p8c2r7 | 1264376 | 83.2 | TRUE |
| DLL1PXM-p8c3r1 | 3728869 | 74.18 | TRUE |
| DLL1PXM-p8c3r2 | 4131313 | 74.81 | TRUE |
| DLL1PXM-p8c3r3 | 1310539 | 81.06 | TRUE |
| DLL1PXM-p8c3r4 | 2148413 | 79.67 | TRUE |
| DLL1PXM-p8c3r6 | 901761 | 80.09 | FALSE |
| DLL1PXM-p8c3r8 | 481938 | 79.15 | FALSE |
| DLL1PXM-p8c4r1 | 1061118 | 79.8 | TRUE |
| DLL1PXM-p8c4r3 | 2194501 | 79.64 | TRUE |
| DLL1PXM-p8c4r4 | 1314632 | 82.26 | TRUE |
| DLL1PXM-p8c4r5 | 1353872 | 82.44 | TRUE |
| DLL1PXM-p8c4r6 | 549267 | 77.18 | FALSE |
| DLL1PXM-p8c4r8 | 1037181 | 83.18 | TRUE |
| DLL1PXM-p8c5r1 | 2785354 | 72.09 | TRUE |
| DLL1PXM-p8c5r2 | 4124086 | 75.87 | TRUE |
| DLL1PXM-p8c5r3 | 1662736 | 81.18 | TRUE |
| DLL1PXM-p8c5r4 | 1160772 | 83.29 | TRUE |
| DLL1PXM-p8c5r5 | 1171809 | 82.23 | TRUE |
| DLL1PXM-p8c5r6 | 976060 | 82.23 | FALSE |
| DLL1PXM-p8c5r8 | 1018066 | 82.28 | TRUE |
| DLL1PXM-p8c6r1 | 2983359 | 66.13 | FALSE |
| DLL1PXM-p8c6r3 | 1487686 | 80.86 | TRUE |
| DLL1PXM-p8c6r4 | 604655 | 77.84 | FALSE |
| DLL1PXM-p8c6r5 | 1376485 | 82.34 | TRUE |
| DLL1PXM-p8c6r6 | 1211696 | 83.04 | TRUE |
| DLL1PXM-p8c6r7 | 1191425 | 81.53 | TRUE |
| DLL1PXM-p8c7r1 | 3571845 | 70.49 | TRUE |
| DLL1PXM-p8c7r2 | 3704175 | 71.41 | TRUE |
| DLL1PXM-p8c7r3 | 3163571 | 76.32 | TRUE |
| DLL1PXM-p8c7r4 | 1157615 | 82.54 | TRUE |
| DLL1PXM-p8c7r7 | 1233164 | 82.7 | TRUE |
| DLL1PXM-p8c7r8 | 1563606 | 81.47 | TRUE |
| DLL1PXM-p8c8r1 | 3776149 | 72.95 | TRUE |
| DLL1PXM-p8c8r2 | 3701594 | 74.95 | TRUE |
| DLL1PXM-p8c8r3 | 999340 | 81.42 | FALSE |
| DLL1PXM-p8c8r5 | 1384003 | 82.52 | TRUE |
| DLL1PXM-p8c8r6 | 1446561 | 82.68 | TRUE |
| DLL1PXM-p8c8r7 | 1164536 | 81.7 | TRUE |
| DLL1PXM-p8c8r8 | 1546021 | 82.63 | TRUE |
| DLL1PXM-p8c9r2 | 3624856 | 73.49 | TRUE |
| DLL1PXM-p8c9r4 | 1043989 | 83.14 | TRUE |
| DLL1PXM-p8c9r5 | 1351713 | 82.38 | TRUE |
| DLL1PXM-p8c9r6 | 1210519 | 83.69 | TRUE |
| DLL1PXM-p8c9r8 | 1339457 | 82.17 | TRUE |
| Earlysomite-p10c10r1 | 774819 | 73.46 | FALSE |
| Earlysomite-p10c10r2 | 1423274 | 80.76 | TRUE |
| Earlysomite-p10c10r3 | 1407180 | 81.52 | TRUE |
| Earlysomite-p10c10r5 | 1602963 | 81.25 | TRUE |
| Earlysomite-p10c10r7 | 2145410 | 80.91 | TRUE |
| Earlysomite-p10c10r8 | 787492 | 83.13 | FALSE |
| Earlysomite-p10c11r1 | 1532609 | 82.03 | TRUE |
| Earlysomite-p10c11r2 | 1673517 | 82.76 | TRUE |
| Earlysomite-p10c11r3 | 1395270 | 80.9 | TRUE |
| Earlysomite-p10c11r4 | 962242 | 83.59 | FALSE |
| Earlysomite-p10c11r5 | 1137531 | 82.47 | TRUE |
| Earlysomite-p10c11r6 | 1092418 | 79.58 | TRUE |
| Earlysomite-p10c11r7 | 63482 | 77.21 | FALSE |
| Earlysomite-p10c12r2 | 1391725 | 80.16 | TRUE |
| Earlysomite-p10c12r3 | 842843 | 78.69 | FALSE |
| Earlysomite-p10c12r4 | 1378920 | 80.65 | TRUE |
| Earlysomite-p10c12r6 | 1217242 | 79.83 | TRUE |
| Earlysomite-p10c2r4 | 962879 | 82.33 | FALSE |
| Earlysomite-p10c2r8 | 1443360 | 80.14 | TRUE |
| Earlysomite-p10c3r2 | 1067474 | 75.63 | TRUE |
| Earlysomite-p10c3r3 | 1232462 | 81.96 | TRUE |
| Earlysomite-p10c4r1 | 1423363 | 81.59 | TRUE |
| Earlysomite-p10c4r2 | 1340161 | 81.07 | TRUE |
| Earlysomite-p10c4r3 | 971375 | 82.38 | FALSE |
| Earlysomite-p10c4r4 | 1709900 | 78.35 | TRUE |
| Earlysomite-p10c4r5 | 1343614 | 82.21 | TRUE |
| Earlysomite-p10c4r6 | 1662512 | 82.42 | TRUE |
| Earlysomite-p10c4r7 | 64492 | 76.25 | FALSE |
| Earlysomite-p10c4r8 | 1121158 | 81.28 | TRUE |
| Earlysomite-p10c5r1 | 1082459 | 78.95 | TRUE |
| Earlysomite-p10c5r4 | 968698 | 82.09 | FALSE |
| Earlysomite-p10c5r5 | 1712134 | 82.37 | TRUE |
| Earlysomite-p10c5r6 | 1462368 | 81.79 | TRUE |
| Earlysomite-p10c5r7 | 1931446 | 80.42 | TRUE |
| Earlysomite-p10c5r8 | 1512212 | 82.03 | TRUE |
| Earlysomite-p10c6r1 | 1392445 | 81.23 | TRUE |
| Earlysomite-p10c6r2 | 1218625 | 82.46 | TRUE |
| Earlysomite-p10c6r3 | 1086105 | 82.44 | TRUE |
| Earlysomite-p10c6r4 | 1358585 | 82.64 | TRUE |
| Earlysomite-p10c6r5 | 1185549 | 83.27 | TRUE |
| Earlysomite-p10c6r6 | 1100330 | 82.46 | TRUE |
| Earlysomite-p10c6r7 | 1965721 | 81.13 | TRUE |
| Earlysomite-p10c6r8 | 2028813 | 80.93 | TRUE |
| Earlysomite-p10c7r1 | 1465126 | 80.68 | TRUE |
| Earlysomite-p10c9r5 | 1314685 | 81.83 | TRUE |
| GARP-p6c10r3 | 11454 | 77.13 | FALSE |
| GARP-p6c10r7 | 25539 | 78.51 | FALSE |
| GARP-p6c10r8 | 26958 | 78.53 | FALSE |
| GARP-p6c11r1 | 11768 | 78.14 | FALSE |
| GARP-p6c11r3 | 10349 | 77.35 | FALSE |
| GARP-p6c11r6 | 27293 | 79.3 | FALSE |
| GARP-p6c12r1 | 14280 | 77.94 | FALSE |
| GARP-p6c12r2 | 12766 | 77.57 | FALSE |
| GARP-p6c12r6 | 32501 | 78.95 | FALSE |
| GARP-p6c1r1 | 11162 | 77.14 | FALSE |
| GARP-p6c1r2 | 9803 | 76.78 | FALSE |
| GARP-p6c1r3 | 11573 | 78.04 | FALSE |
| GARP-p6c1r5 | 14135 | 78.16 | FALSE |
| GARP-p6c1r8 | 33495 | 78.12 | FALSE |
| GARP-p6c2r1 | 12558 | 77.71 | FALSE |
| GARP-p6c2r3 | 11597 | 77.57 | FALSE |
| GARP-p6c2r5 | 16336 | 78.32 | FALSE |
| GARP-p6c2r6 | 12629 | 77.23 | FALSE |
| GARP-p6c2r7 | 22792 | 78.73 | FALSE |
| GARP-p6c3r1 | 15130 | 78.47 | FALSE |
| GARP-p6c3r2 | 13706 | 77.69 | FALSE |
| GARP-p6c3r4 | 14666 | 78.7 | FALSE |
| GARP-p6c3r5 | 16248 | 78.41 | FALSE |
| GARP-p6c3r7 | 29841 | 77.87 | FALSE |
| GARP-p6c3r8 | 29254 | 78.35 | FALSE |
| GARP-p6c4r4 | 17827 | 78.78 | FALSE |
| GARP-p6c4r5 | 14303 | 77.57 | FALSE |
| GARP-p6c4r7 | 25810 | 78.01 | FALSE |
| GARP-p6c4r8 | 23401 | 77.92 | FALSE |
| GARP-p6c5r2 | 11507 | 76.33 | FALSE |
| GARP-p6c5r3 | 14371 | 77.13 | FALSE |
| GARP-p6c5r5 | 14500 | 78.36 | FALSE |
| GARP-p6c5r6 | 14749 | 77.74 | FALSE |
| GARP-p6c5r7 | 30506 | 78.86 | FALSE |
| GARP-p6c6r3 | 12627 | 76.86 | FALSE |
| GARP-p6c6r6 | 17101 | 78.41 | FALSE |
| GARP-p6c6r8 | 27028 | 78.21 | FALSE |
| GARP-p6c7r1 | 12492 | 77.77 | FALSE |
| GARP-p6c7r2 | 13090 | 77.52 | FALSE |
| GARP-p6c7r3 | 10551 | 76.94 | FALSE |
| GARP-p6c7r5 | 18259 | 78.01 | FALSE |
| GARP-p6c7r6 | 14548 | 78.42 | FALSE |
| GARP-p6c7r7 | 29833 | 78.89 | FALSE |
| GARP-p6c8r1 | 11066 | 77.66 | FALSE |
| GARP-p6c8r3 | 11671 | 76.37 | FALSE |
| GARP-p6c8r4 | 12803 | 78.41 | FALSE |
| GARP-p6c8r6 | 13057 | 78.01 | FALSE |
| GARP-p6c8r7 | 26229 | 78.36 | FALSE |
| GARP-p6c9r3 | 13597 | 77.83 | FALSE |
| GARP-p6c9r4 | 16741 | 77.67 | FALSE |
| GARP-p6c9r5 | 16141 | 77.49 | FALSE |
| GARP-p6c9r8 | 32136 | 79.22 | FALSE |
| H7hESC-p7c10r1 | 15212 | 77.81 | FALSE |
| H7hESC-p7c10r2 | 13042 | 77.38 | FALSE |
| H7hESC-p7c10r3 | 3040176 | 78.93 | TRUE |
| H7hESC-p7c10r4 | 140876 | 69.78 | FALSE |
| H7hESC-p7c10r5 | 2812947 | 79.05 | TRUE |
| H7hESC-p7c10r7 | 831290 | 79.19 | FALSE |
| H7hESC-p7c10r8 | 3601056 | 74.05 | TRUE |
| H7hESC-p7c11r4 | 2607183 | 77.86 | TRUE |
| H7hESC-p7c11r6 | 3000473 | 76 | TRUE |
| H7hESC-p7c11r7 | 3363517 | 78.13 | TRUE |
| H7hESC-p7c12r1 | 13410 | 77.49 | FALSE |
| H7hESC-p7c12r2 | 12037 | 77.87 | FALSE |
| H7hESC-p7c12r3 | 124096 | 71.79 | FALSE |
| H7hESC-p7c12r4 | 104487 | 72.21 | FALSE |
| H7hESC-p7c12r6 | 213692 | 50.66 | FALSE |
| H7hESC-p7c12r7 | 3338221 | 74.7 | TRUE |
| H7hESC-p7c1r1 | 24837 | 78.81 | FALSE |
| H7hESC-p7c1r2 | 13352 | 77.58 | FALSE |
| H7hESC-p7c1r3 | 129929 | 77.24 | FALSE |
| H7hESC-p7c1r4 | 3110798 | 74.28 | TRUE |
| H7hESC-p7c1r5 | 3155989 | 76.56 | TRUE |
| H7hESC-p7c1r6 | 2792444 | 77.2 | TRUE |
| H7hESC-p7c1r7 | 3344496 | 74.61 | TRUE |
| H7hESC-p7c1r8 | 3511007 | 73.82 | TRUE |
| H7hESC-p7c2r1 | 13618 | 78.42 | FALSE |
| H7hESC-p7c2r3 | 2197303 | 72.9 | TRUE |
| H7hESC-p7c2r4 | 3165871 | 79.03 | TRUE |
| H7hESC-p7c2r5 | 3414200 | 73.2 | TRUE |
| H7hESC-p7c2r6 | 2821648 | 75.67 | TRUE |
| H7hESC-p7c2r7 | 2629633 | 75.39 | TRUE |
| H7hESC-p7c2r8 | 3549143 | 75.69 | TRUE |
| H7hESC-p7c3r1 | 16109 | 77.62 | FALSE |
| H7hESC-p7c3r3 | 3107167 | 75.44 | TRUE |
| H7hESC-p7c3r4 | 3200798 | 77.93 | TRUE |
| H7hESC-p7c3r5 | 3046981 | 75.99 | TRUE |
| H7hESC-p7c3r6 | 2052182 | 77.7 | TRUE |
| H7hESC-p7c3r7 | 3104321 | 72.47 | TRUE |
| H7hESC-p7c4r2 | 16580 | 77.12 | FALSE |
| H7hESC-p7c4r3 | 3006452 | 78.27 | TRUE |
| H7hESC-p7c4r6 | 566011 | 78.16 | FALSE |
| H7hESC-p7c4r7 | 3183684 | 78.29 | TRUE |
| H7hESC-p7c4r8 | 3285656 | 74.13 | TRUE |
| H7hESC-p7c5r2 | 14747 | 77.51 | FALSE |
| H7hESC-p7c5r3 | 3568139 | 77.64 | TRUE |
| H7hESC-p7c5r4 | 2480859 | 79.42 | TRUE |
| H7hESC-p7c5r5 | 2384075 | 78.8 | TRUE |
| H7hESC-p7c5r6 | 936672 | 67.61 | FALSE |
| H7hESC-p7c5r8 | 3519477 | 76.97 | TRUE |
| H7hESC-p7c6r1 | 11228 | 77.48 | FALSE |
| H7hESC-p7c6r2 | 12039 | 77.25 | FALSE |
| H7hESC-p7c6r3 | 2926496 | 75.73 | TRUE |
| H7hESC-p7c6r4 | 1258451 | 78.46 | TRUE |
| H7hESC-p7c6r5 | 2606146 | 79.8 | TRUE |
| H7hESC-p7c6r6 | 2387516 | 78.12 | TRUE |
| H7hESC-p7c6r7 | 2876846 | 77.01 | TRUE |
| H7hESC-p7c6r8 | 3687463 | 76.39 | TRUE |
| H7hESC-p7c7r1 | 15548 | 77.71 | FALSE |
| H7hESC-p7c7r3 | 3191548 | 78.21 | TRUE |
| H7hESC-p7c7r5 | 2952936 | 78.61 | TRUE |
| H7hESC-p7c7r6 | 3058342 | 77.42 | TRUE |
| H7hESC-p7c7r7 | 2851034 | 77.88 | TRUE |
| H7hESC-p7c7r8 | 3239712 | 75.89 | TRUE |
| H7hESC-p7c8r1 | 13339 | 77.57 | FALSE |
| H7hESC-p7c8r2 | 13234 | 77.22 | FALSE |
| H7hESC-p7c8r3 | 3105874 | 73.86 | TRUE |
| H7hESC-p7c8r5 | 3249837 | 76.01 | TRUE |
| H7hESC-p7c8r6 | 3171979 | 77.12 | TRUE |
| H7hESC-p7c8r7 | 2920896 | 74.23 | TRUE |
| H7hESC-p7c8r8 | 3879315 | 74.84 | TRUE |
| H7hESC-p7c9r1 | 15088 | 77.63 | FALSE |
| H7hESC-p7c9r2 | 16111 | 79.54 | FALSE |
| H7hESC-p7c9r3 | 2087164 | 79.75 | TRUE |
| H7hESC-p7c9r5 | 2864608 | 78.63 | TRUE |
| H7hESC-p7c9r6 | 2225023 | 78.87 | TRUE |
| H7hESC-p7c9r7 | 2832054 | 78.63 | TRUE |
| H7hESC-p7c9r8 | 3388549 | 75.62 | TRUE |
| LatM-p3c10r1 | 1848645 | 80.26 | TRUE |
| LatM-p3c10r3 | 1711542 | 78.22 | TRUE |
| LatM-p3c10r6 | 1225845 | 82.13 | TRUE |
| LatM-p3c11r1 | 2036629 | 80.18 | TRUE |
| LatM-p3c11r3 | 1853196 | 80.2 | TRUE |
| LatM-p3c11r4 | 1620883 | 80.38 | TRUE |
| LatM-p3c11r5 | 1758473 | 79.52 | TRUE |
| LatM-p3c11r8 | 1820674 | 80.73 | TRUE |
| LatM-p3c12r2 | 1787205 | 81.83 | TRUE |
| LatM-p3c12r4 | 1473145 | 81.97 | TRUE |
| LatM-p3c12r5 | 1728367 | 80.65 | TRUE |
| LatM-p3c12r7 | 1754434 | 80.59 | TRUE |
| LatM-p3c1r1 | 1776278 | 81.49 | TRUE |
| LatM-p3c1r4 | 1790186 | 81.03 | TRUE |
| LatM-p3c1r6 | 1581544 | 80.21 | TRUE |
| LatM-p3c1r7 | 1711082 | 80.03 | TRUE |
| LatM-p3c2r1 | 1786408 | 80.57 | TRUE |
| LatM-p3c2r2 | 1880860 | 80.72 | TRUE |
| LatM-p3c2r3 | 1760165 | 80.96 | TRUE |
| LatM-p3c2r5 | 1751354 | 80.27 | TRUE |
| LatM-p3c2r6 | 1623023 | 80.2 | TRUE |
| LatM-p3c2r7 | 1858784 | 79.49 | TRUE |
| LatM-p3c3r2 | 1442559 | 79.79 | TRUE |
| LatM-p3c3r8 | 1705278 | 80.16 | TRUE |
| LatM-p3c4r1 | 1829541 | 80.95 | TRUE |
| LatM-p3c4r2 | 1931289 | 81.29 | TRUE |
| LatM-p3c4r4 | 1881071 | 80.69 | TRUE |
| LatM-p3c4r5 | 1650957 | 78.83 | TRUE |
| LatM-p3c4r6 | 1668589 | 80.08 | TRUE |
| LatM-p3c4r7 | 1890628 | 79.95 | TRUE |
| LatM-p3c4r8 | 1951557 | 79.25 | TRUE |
| LatM-p3c5r1 | 1937785 | 81.57 | TRUE |
| LatM-p3c5r2 | 1858567 | 79.88 | TRUE |
| LatM-p3c5r4 | 1842332 | 79.91 | TRUE |
| LatM-p3c5r6 | 1382254 | 81.5 | TRUE |
| LatM-p3c5r8 | 1843866 | 81.03 | TRUE |
| LatM-p3c6r1 | 1860437 | 78.79 | TRUE |
| LatM-p3c6r4 | 1818224 | 80.47 | TRUE |
| LatM-p3c6r7 | 2014636 | 79.86 | TRUE |
| LatM-p3c6r8 | 1922478 | 79.64 | TRUE |
| LatM-p3c7r1 | 1773998 | 81.46 | TRUE |
| LatM-p3c7r2 | 1866162 | 80.69 | TRUE |
| LatM-p3c7r3 | 1837113 | 81.17 | TRUE |
| LatM-p3c7r5 | 1625469 | 79.99 | TRUE |
| LatM-p3c7r6 | 1610642 | 79.42 | TRUE |
| LatM-p3c8r2 | 1858425 | 80.39 | TRUE |
| LatM-p3c8r3 | 1902659 | 80.99 | TRUE |
| LatM-p3c8r7 | 2089988 | 78.8 | TRUE |
| LatM-p3c8r8 | 1858528 | 80.44 | TRUE |
| LatM-p3c9r1 | 1688880 | 82.07 | TRUE |
| LatM-p3c9r2 | 1798283 | 81.47 | TRUE |
| LatM-p3c9r3 | 1889540 | 79.88 | TRUE |
| LatM-p3c9r4 | 1718310 | 80.47 | TRUE |
| LatM-p3c9r5 | 1555638 | 79.93 | TRUE |
| LatM-p3c9r7 | 1983700 | 79.74 | TRUE |
| MPS3-p5c10r4 | 20381 | 76.7 | FALSE |
| MPS3-p5c10r5 | 10555 | 78.21 | FALSE |
| MPS3-p5c10r6 | 13522 | 78.05 | FALSE |
| MPS3-p5c10r7 | 14699 | 77.16 | FALSE |
| MPS3-p5c10r8 | 15635 | 76.64 | FALSE |
| MPS3-p5c11r4 | 20558 | 76.27 | FALSE |
| MPS3-p5c11r5 | 12339 | 78.61 | FALSE |
| MPS3-p5c11r6 | 12125 | 77.2 | FALSE |
| MPS3-p5c11r7 | 10559 | 77.66 | FALSE |
| MPS3-p5c11r8 | 13773 | 77.09 | FALSE |
| MPS3-p5c12r1 | 1948756 | 80.33 | TRUE |
| MPS3-p5c12r2 | 22024 | 67.32 | FALSE |
| MPS3-p5c12r3 | 20980 | 75.67 | FALSE |
| MPS3-p5c12r4 | 2030771 | 80.97 | TRUE |
| MPS3-p5c12r5 | 12577 | 78.13 | FALSE |
| MPS3-p5c12r6 | 9270 | 76.62 | FALSE |
| MPS3-p5c1r1 | 2477457 | 78.55 | TRUE |
| MPS3-p5c1r3 | 2313945 | 80.07 | TRUE |
| MPS3-p5c1r4 | 1637354 | 78.79 | TRUE |
| MPS3-p5c1r7 | 10672 | 77.48 | FALSE |
| MPS3-p5c2r1 | 2480808 | 79.2 | TRUE |
| MPS3-p5c2r2 | 2263965 | 80.32 | TRUE |
| MPS3-p5c2r3 | 2208614 | 79.38 | TRUE |
| MPS3-p5c2r4 | 1672830 | 79.15 | TRUE |
| MPS3-p5c2r5 | 2023398 | 80.15 | TRUE |
| MPS3-p5c2r6 | 10750 | 77.89 | FALSE |
| MPS3-p5c2r8 | 14327 | 76.66 | FALSE |
| MPS3-p5c3r1 | 2012787 | 80.76 | TRUE |
| MPS3-p5c3r8 | 12363 | 77.12 | FALSE |
| MPS3-p5c4r1 | 25576 | 75.89 | FALSE |
| MPS3-p5c4r2 | 1882352 | 81.27 | TRUE |
| MPS3-p5c4r5 | 20462 | 77.17 | FALSE |
| MPS3-p5c4r7 | 13299 | 78.95 | FALSE |
| MPS3-p5c4r8 | 14242 | 78.48 | FALSE |
| MPS3-p5c5r1 | 1405075 | 80.67 | TRUE |
| MPS3-p5c5r2 | 2165346 | 79.87 | TRUE |
| MPS3-p5c5r3 | 2332677 | 80.73 | TRUE |
| MPS3-p5c5r5 | 10762 | 78.73 | FALSE |
| MPS3-p5c6r1 | 2334672 | 78.86 | TRUE |
| MPS3-p5c6r3 | 23901 | 77.09 | FALSE |
| MPS3-p5c6r4 | 19745 | 75.9 | FALSE |
| MPS3-p5c6r5 | 13045 | 78.17 | FALSE |
| MPS3-p5c6r7 | 11005 | 77.97 | FALSE |
| MPS3-p5c7r1 | 1675737 | 81.22 | TRUE |
| MPS3-p5c7r2 | 2191692 | 79.27 | TRUE |
| MPS3-p5c7r3 | 26703 | 76.97 | FALSE |
| MPS3-p5c7r4 | 2077373 | 80.51 | TRUE |
| MPS3-p5c7r8 | 14041 | 77.49 | FALSE |
| MPS3-p5c8r1 | 1823770 | 81.26 | TRUE |
| MPS3-p5c8r3 | 21160 | 77.06 | FALSE |
| MPS3-p5c8r4 | 1841927 | 79.76 | TRUE |
| MPS3-p5c8r5 | 8907 | 77.51 | FALSE |
| MPS3-p5c8r7 | 9871 | 78.68 | FALSE |
| MPS3-p5c8r8 | 12270 | 77.43 | FALSE |
| MPS3-p5c9r3 | 24057 | 77.4 | FALSE |
| MPS3-p5c9r4 | 2075554 | 80.11 | TRUE |
| MPS3-p5c9r5 | 12517 | 77.45 | FALSE |
| MPS3-p5c9r6 | 10794 | 78.06 | FALSE |
| MPS3-p5c9r7 | 12506 | 78.54 | FALSE |
| MPS3-p5c9r8 | 12816 | 77.5 | FALSE |
| Sclerotome-p2c10r1 | 1802955 | 81.48 | TRUE |
| Sclerotome-p2c10r2 | 1721023 | 80.74 | TRUE |
| Sclerotome-p2c10r3 | 1800314 | 81.44 | TRUE |
| Sclerotome-p2c10r4 | 2110665 | 79.43 | TRUE |
| Sclerotome-p2c10r5 | 1882311 | 80.88 | TRUE |
| Sclerotome-p2c10r6 | 1630387 | 80.23 | TRUE |
| Sclerotome-p2c10r7 | 1845782 | 80.28 | TRUE |
| Sclerotome-p2c10r8 | 1967016 | 80.1 | TRUE |
| Sclerotome-p2c11r1 | 1970304 | 80.91 | TRUE |
| Sclerotome-p2c11r3 | 1778989 | 80.41 | TRUE |
| Sclerotome-p2c11r4 | 1782802 | 79.6 | TRUE |
| Sclerotome-p2c11r6 | 1531583 | 80.34 | TRUE |
| Sclerotome-p2c11r7 | 1577302 | 79.73 | TRUE |
| Sclerotome-p2c12r1 | 24599 | 74.18 | FALSE |
| Sclerotome-p2c12r3 | 1840700 | 80.81 | TRUE |
| Sclerotome-p2c12r5 | 2083710 | 80.26 | TRUE |
| Sclerotome-p2c1r1 | 1334198 | 80.66 | TRUE |
| Sclerotome-p2c1r2 | 1943784 | 79.47 | TRUE |
| Sclerotome-p2c1r4 | 1890414 | 80.28 | TRUE |
| Sclerotome-p2c1r5 | 1912599 | 80.49 | TRUE |
| Sclerotome-p2c1r6 | 1799140 | 81.08 | TRUE |
| Sclerotome-p2c1r7 | 1777353 | 81.04 | TRUE |
| Sclerotome-p2c2r2 | 1568544 | 81 | TRUE |
| Sclerotome-p2c2r3 | 737599 | 81.34 | FALSE |
| Sclerotome-p2c2r6 | 1919205 | 80.04 | TRUE |
| Sclerotome-p2c2r8 | 973149 | 80.54 | FALSE |
| Sclerotome-p2c3r1 | 1749624 | 81.93 | TRUE |
| Sclerotome-p2c3r2 | 1908393 | 80.17 | TRUE |
| Sclerotome-p2c3r3 | 1884627 | 80.5 | TRUE |
| Sclerotome-p2c3r4 | 1635739 | 80.97 | TRUE |
| Sclerotome-p2c3r6 | 1840941 | 81.35 | TRUE |
| Sclerotome-p2c3r7 | 1801468 | 79.94 | TRUE |
| Sclerotome-p2c3r8 | 1856378 | 80.14 | TRUE |
| Sclerotome-p2c4r1 | 2033025 | 81.18 | TRUE |
| Sclerotome-p2c4r3 | 1881229 | 80.21 | TRUE |
| Sclerotome-p2c4r4 | 1733463 | 80.65 | TRUE |
| Sclerotome-p2c4r5 | 1834616 | 79.73 | TRUE |
| Sclerotome-p2c4r6 | 1414856 | 80.68 | TRUE |
| Sclerotome-p2c4r7 | 1723879 | 79.71 | TRUE |
| Sclerotome-p2c4r8 | 1784598 | 77.18 | TRUE |
| Sclerotome-p2c5r1 | 1901144 | 81.28 | TRUE |
| Sclerotome-p2c5r3 | 1785933 | 79.08 | TRUE |
| Sclerotome-p2c5r4 | 1611140 | 77.72 | TRUE |
| Sclerotome-p2c5r6 | 1570688 | 81.79 | TRUE |
| Sclerotome-p2c5r7 | 1982820 | 80.76 | TRUE |
| Sclerotome-p2c6r3 | 1809586 | 80.19 | TRUE |
| Sclerotome-p2c6r5 | 1739098 | 78.21 | TRUE |
| Sclerotome-p2c6r6 | 1660622 | 81.57 | TRUE |
| Sclerotome-p2c6r7 | 1775201 | 79.93 | TRUE |
| Sclerotome-p2c6r8 | 1835513 | 81.13 | TRUE |
| Sclerotome-p2c7r1 | 1987120 | 81.32 | TRUE |
| Sclerotome-p2c7r2 | 1347448 | 80.36 | TRUE |
| Sclerotome-p2c7r3 | 1648535 | 80.24 | TRUE |
| Sclerotome-p2c7r4 | 723428 | 80.49 | FALSE |
| Sclerotome-p2c7r5 | 1850945 | 80.51 | TRUE |
| Sclerotome-p2c7r6 | 1685250 | 78.77 | TRUE |
| Sclerotome-p2c8r2 | 1592429 | 80.56 | TRUE |
| Sclerotome-p2c8r3 | 1678306 | 80.05 | TRUE |
| Sclerotome-p2c8r4 | 1162892 | 81.04 | TRUE |
| Sclerotome-p2c8r5 | 1901339 | 81.21 | TRUE |
| Sclerotome-p2c8r6 | 1731477 | 79.41 | TRUE |
| Sclerotome-p2c8r7 | 1609297 | 78.87 | TRUE |
| Sclerotome-p2c8r8 | 1742708 | 77.69 | TRUE |
| Sclerotome-p2c9r1 | 1842849 | 81.26 | TRUE |
| Sclerotome-p2c9r2 | 1858150 | 79.13 | TRUE |
| Sclerotome-p2c9r3 | 1582883 | 81.39 | TRUE |
| Sclerotome-p2c9r4 | 1782125 | 80.89 | TRUE |
| Sclerotome-p2c9r5 | 1811432 | 79.69 | TRUE |
| Sclerotome-p2c9r6 | 1709090 | 80.25 | TRUE |
We next filtered out genes with low or undetectable expression by only considering genes with least 20 cells (across all 498 retained cells) showing a log2 (TPM+1) value of at least 10 for that gene. As with the data from the bulk-population RNA-seq, when performing analyses comparing cell types to one another, we additionally filtered out genes whose log2 (TPM+1) values did not vary by a difference of at least 2 (i.e., a 4-fold difference in expression) between the cell types with the highest and lowest expressions.
The raw data from the single-cell RNA-seq can be found in [Data Citation 1]. A spreadsheet of TPM values can be found in [Data Citation 2].
ATAC-seq
Library preparation and sequencing
ATAC-seq was performed as described previously9, with minor modifications. In brief, for each replicate, 50,000 cells were lysed in lysis buffer containing 0.01% IGEPAL CA-630 (Sigma, I8896) to obtain nuclei, which were directly used in the Tn5 transposition reaction (reagents from Nextera DNA Sample Preparation Kit; Illumina, FC-121–1030). Immediately following transposition, DNA fragments were purified (MinElute Kit, Qiagen) and PCR amplified for a total of 12–13 cycles using previously-designed primers that included Illumina compatible adapters and barcodes9. The resulting ATAC-seq libraries were purified (MinElute Kit, Qiagen) and pooled, and final library-pool concentrations were assessed (Bioanalyzer) prior to next-generation sequencing. The quality of ATAC-seq libraries was confirmed by a shallow sequencing run using a MiSeq v3 (Stanford Functional Genomics Facility, 2×75 bp reads) before deep sequencing was performed on a NextSeq 500 (2×75 bp reads). Two replicates were analyzed per cell-type.
Quantification and processing
We used the ATAqC pipeline20 to process the ATAC-seq reads, starting with adapter trimming and then alignment to hg19 (Bowtie2 (ref. 21)). While we used hg38 for RNA-seq alignment, we opted for hg19 for ATAC-seq because of the availability of a curated blacklist of artifactual regions in hg19 (ref. 13). We then filtered out reads based on a variety of criteria (excluding unmapped reads, mate-unmapped reads, secondary alignments, duplicates (using Picard's MarkDuplicates22), multi-mapping reads (MAPQ<30), and mitochondrial reads), retaining only high-read-quality, properly-paired reads.
Two biological replicates were assayed by ATAC-seq for each cell-type. As the post-filtering sequencing depth varied between replicates and cell types, we subsampled each replicate to a maximum of 35 M uniquely-mapping reads (post-filtering) to improve comparability between samples. We next used MACS2 (ref. 23) to call peaks for each replicate, with a relaxed false discovery rate (FDR) threshold of 0.01, and then created a unified peak list for each cell type by selecting only peaks that were reproducible between both replicates. This was done through an irreproducible discovery rate (IDR) analysis24, similar to what was previously described by the ENCODE Consortium25. In brief, the IDR method takes in peak calls from a pair of replicates, filters out all peaks that only appear in one replicate, and then uses a copula mixture model to model the remaining peaks as belonging to either a reproducible ‘signal’ population or an irreproducible ‘noise’ population’. We used an IDR threshold of 0.1, i.e., we only retained peaks that were deemed to have come from the ‘signal’ population with a probability of more than 0.9 after a multiple testing correction. Finally, we filtered out all peaks that appeared in the aforementioned blacklist of artifactual regions in hg19 (https://www.encodeproject.org/annotations/ENCSR636HFF/).
We note that this ATAC-seq analysis pipeline is an improved version of the one used for analysis in our related publication8. In particular, here we adjusted the IDR threshold, the shift size parameter for MACS2, and a multi-mapping parameter, resulting in increased sensitivity for peak detection.
To obtain a universal list of peaks across all cell-types, we used BEDtools26 to merge the lists of filtered, reproducible peaks for each cell-type, resulting in a total of 166,256 peaks. For each cell-type, we then pooled its two biological replicates together and called peaks (MACS2) on the pooled reads. To obtain a single measure of confidence at each peak P in the universal list for each cell-type C, we took the highest −log10 P-value out of all peaks in the pooled replicates for C that intersected with P.
The raw ATAC-seq data can be found in [Data Citation 1]. The peak calls can be found in [Data Citation 2]. ATAC-seq metadata is tabulated in Table 4 (available online only).
Table 4. ATAC-seq metadata and quality control statistics.
| Sample ID | Celltype | Date ATAC was performed | Date of library prep | Read count from sequencer | Read count successfully aligned | Read count after filtering for mapping quality | Read count after removing duplicate reads | Read count after removing mitochondrial reads | Non-Redundant Fraction (NRF) | PBC1 | PBC2 | Fraction of reads in NFR | NFR/mono-nuc reads | Presence of NFR peak | Presence of Mono-Nuc peak | Raw peaks | IDR peaks | TSS enrichment | Number of reads in universal DHS regions | Number of reads in promoter regions | Number of reads in enhancer regions | Number of reads in called peak regions |
|---|---|---|---|---|---|---|---|---|---|---|---|---|---|---|---|---|---|---|---|---|---|---|
| H7_hESC_ATAC1 | D0 hESC | 11/8/2015 | 13/8/2015 | 93261696 | 89445943 | 63427355 | 48401487 | 33057240 | 0.874173 | 0.877391 | 7.963726 | 0.672145531 | 4.48815287 | OK | OK | 348998 | 72107 | 5.677532655 | 7501297 | 2181218 | 9420055 | 7113974 |
| H7_hESC_ATAC2 | D0 hESC | 11/8/2015 | 13/8/2015 | 151825178 | 145741374 | 103141220 | 74914035 | 46080346 | 0.784357 | 0.780965 | 4.355791 | 0.594905988 | 3.111463078 | OK | OK | 254898 | 72107 | 5.417971046 | 8093722 | 2271676 | 10309049 | 6258218 |
| APS_ATAC3 | D1 APS | 4/8/2015 | 13/8/2015 | 88401812 | 83952797 | 60558447 | 42312884 | 23641140 | 0.589525 | 0.549898 | 1.940211 | 0.591169991 | 3.182374684 | OK | OK | 345846 | 59125 | 6.454679332 | 5428052 | 1625595 | 6652426 | 5366166 |
| APS_ATAC4 | D1 APS | 4/8/2015 | 13/8/2015 | 66716160 | 63482035 | 51529472 | 44238724 | 36710784 | 0.788187 | 0.778657 | 4.278458 | 0.647351136 | 4.050393391 | OK | OK | 243565 | 59125 | 5.615858894 | 7885350 | 2329280 | 10127389 | 6313436 |
| MPS_ATAC5 | D1 MPS | 4/8/2015 | 13/8/2015 | 129125340 | 123708067 | 86733447 | 60812283 | 34369150 | 0.737118 | 0.727553 | 3.416704 | 0.594271523 | 3.19534847 | OK | OK | 359273 | 57945 | 6.99517666 | 8210077 | 2525384 | 9790941 | 8632701 |
| MPS_ATAC6 | D1 MPS | 4/8/2015 | 13/8/2015 | 128802054 | 122229341 | 96453862 | 81570579 | 66255516 | 0.823556 | 0.818931 | 5.306797 | 0.678716288 | 4.711491841 | OK | OK | 258726 | 57945 | 4.580237486 | 7712954 | 2117515 | 10307394 | 5862319 |
| DLL1pPXm_ATAC7 | D2 DLL1+ PXM | 6/8/2015 | 13/8/2015 | 191702808 | 183718196 | 132414659 | 99511940 | 66060614 | 0.870262 | 0.875024 | 7.831789 | 0.6619457 | 4.286335569 | OK | OK | 276391 | 109250 | 7.628156666 | 9726101 | 3070226 | 11125097 | 10862818 |
| DLL1pPXm_ATAC8 | D2 DLL1+ PXM | 6/8/2015 | 13/8/2015 | 147291642 | 140788669 | 100167093 | 74377015 | 48138988 | 0.876385 | 0.882327 | 8.327058 | 0.648651946 | 4.078567409 | OK | OK | 277230 | 109250 | 6.923491809 | 9028293 | 2770033 | 10754812 | 9077103 |
| D2Ltm_ATAC9 | D2 LatM | 13/8/2015 | 26/8/2015 | 95742814 | 89161027 | 55998269 | 38367024 | 20466238 | 0.809605 | 0.81417 | 5.168049 | 0.645042836 | 3.413532025 | OK | OK | 276175 | 83109 | 10.03275293 | 5519359 | 1819707 | 6117321 | 5451176 |
| D2Ltm_ATAC10 | D2 LatM | 13/8/2015 | 26/8/2015 | 192134220 | 179733937 | 113070226 | 75469447 | 37284730 | 0.738965 | 0.735284 | 3.560357 | 0.618695962 | 3.008369035 | OK | OK | 271235 | 83109 | 9.294310086 | 9382874 | 3039301 | 10769509 | 9234041 |
| D6Sclrtm_ATAC11 | D6 Sclerotome | 13/8/2015 | 26/8/2015 | 328044572 | 305242787 | 181293318 | 101400785 | 20559368 | 0.35659 | 0.275679 | 1.094047 | 0.620269839 | 3.299242828 | OK | OK | 253472 | 100590 | 17.34139067 | 6701318 | 3110272 | 5575866 | 9432698 |
| D6Sclrtm_ATAC12 | D6 Sclerotome | 13/8/2015 | 26/8/2015 | 138904558 | 130498363 | 77296400 | 45578855 | 13471630 | 0.591614 | 0.570517 | 2.065099 | 0.622210362 | 3.106016386 | OK | OK | 273702 | 100590 | 22.34978045 | 5050293 | 2376784 | 3803650 | 7543825 |
| ESMT_ATAC13 | D3 Somite | 10/8/2015 | 26/8/2015 | 97028570 | 90293961 | 63339679 | 50618923 | 37539350 | 0.898727 | 0.903776 | 10.279185 | 0.603838363 | 2.810326908 | OK | OK | 282813 | 116312 | 12.47182107 | 11055518 | 4184717 | 10999339 | 14172891 |
| ESMT_ATAC14 | D3 Somite | 10/8/2015 | 26/8/2015 | 91342558 | 84065314 | 58377777 | 46807655 | 34919048 | 0.90416 | 0.90955 | 10.96564 | 0.63869863 | 3.207448669 | OK | OK | 269952 | 116312 | 11.90248274 | 10346635 | 3811873 | 10541840 | 12560254 |
| D3CrdcM_ATAC15 | D3 Cardiac | 10/8/2015 | 26/8/2015 | 191778720 | 183897391 | 125066804 | 80344503 | 35114474 | 0.817896 | 0.842331 | 6.475016 | 0.657794431 | 3.578035603 | OK | OK | 319458 | 180380 | 20.14099152 | 15988868 | 5748762 | 13938902 | 26578992 |
| D3CrdcM_ATAC16 | D3 Cardiac | 10/8/2015 | 26/8/2015 | 134871886 | 129649682 | 87780976 | 57145039 | 26151482 | 0.839505 | 0.863365 | 7.520129 | 0.670442227 | 3.796855645 | OK | OK | 286851 | 180380 | 19.13967334 | 11303563 | 4006843 | 10070805 | 16347057 |
| Drmmtm_ATAC19 | D5 Dermomytome | 12/8/2015 | 26/8/2015 | 152978836 | 144566390 | 108536158 | 84652575 | 60077794 | 0.79836 | 0.805027 | 5.208383 | 0.701894281 | 5.092762813 | OK | OK | 263326 | 48916 | 8.862852148 | 8300267 | 2617001 | 10695931 | 7189919 |
| Drmmtm_ATAC20 | D5 Dermomytome | 12/8/2015 | 26/8/2015 | 71382368 | 67502665 | 50296672 | 40140535 | 29655914 | 0.865341 | 0.871256 | 7.841101 | 0.688026099 | 4.642126486 | OK | OK | 285309 | 48916 | 8.873565459 | 6769259 | 2144352 | 8681073 | 5847726 |
| Smtmrs_ATAC21 | D2.25 Somitomere | 6/8/2015 | 26/8/2015 | 425477876 | 407097668 | 310085861 | 238535286 | 165584332 | 0.791969 | 0.797997 | 4.973526 | 0.730157497 | 5.929894484 | OK | OK | 280874 | 83545 | 9.602687176 | 9101861 | 2824194 | 11178718 | 8781283 |
| Smtmrs_ATAC22 | D2.25 Somitomere | 6/8/2015 | 26/8/2015 | 178465724 | 169037246 | 129385205 | 104336662 | 78489898 | 0.86589 | 0.870784 | 7.749138 | 0.70693823 | 4.987984435 | OK | OK | 277098 | 83545 | 9.442978111 | 9099713 | 2875813 | 11146695 | 9079702 |
High-throughput surface marker screening
High-throughput, antibody-based screening of surface markers expressed on various mesodermal progenitors was performed as described in our related publication8 and explained in further detail here. The following lineages, derived from the indicated embryonic stem cell lines, were screened using this approach: undifferentiated H7 hESCs (‘undifferentiated hESCs’), H7-derived day 2 paraxial mesoderm (‘paraxial mesoderm’), H7-derived day 3 early somite progenitors (‘early somite’), H7-derived day 5 dermomyotome (‘dermomyotome’), H7-derived day 6 sclerotome (‘sclerotome’), MIXL1-GFP reporter HES3 hESC-derived day 1 anterior primitive streak (‘primitive streak’) and finally, NKX2.5-GFP reporter HES3 hESC-derived day 3 cardiac mesoderm (‘cardiac mesoderm’). 10–70 million cells of each lineage were used in each surface-marker screen. Due to limited resources, we did not include mid primitive streak and lateral mesoderm in this screen.
Prior to antibody staining, hESCs or their differentiated mesodermal progeny were dissociated by brief 37 C incubation in TrypLE Express (Gibco). TrypLE Express was chosen as a dissociation reagent, as it has been previously shown to minimally cleave cell-surface epitopes27, which would otherwise confound surface marker screening data. After cell detachment, they were washed off plates in a large excess of DMEM/F12 to neutralize the dissociation reagent, filtered to remove large cell clumps, pelleted by centrifugation, and re-suspended in approximately 30 ml of Cell Suspension Buffer (Biolegend).
To conduct antibody screening, a multichannel pipette was used to plate the cell suspension into individual wells of four 96-well plates, each well containing a distinct PE-conjugated antibody against a human cell-surface antigen, altogether totaling 332 unique cell-surface markers across multiple 96-well plates (LEGENDScreen PE-Conjugated Human Antibody Plates; Biolegend, 700001). Cells were stained with respective antibodies for 30 min at 4 C, washed twice with Cell Staining Buffer and then finally re-suspended in Cell Staining Buffer containing 1.1 μM DAPI (Biolegend) as a viability dye before analysis on an LSR Fortessa (Stanford Stem Cell Institute FACS Core). Stained cells were not fixed prior to FACS analysis.
The percentage of viable (DAPI-negative cells) for each lineage that expressed each given surface marker was determined by rigorously gating the PE fluorescent signal such that no more than several percent of negative control cells (unstained cells or cells that were stained with an isotype control antibody directed against no known cellular antigen) were regarded positive. For analysis of surface-marker expression on MIXL1-GFP reporter HES3 hESC-derived primitive streak or NKX2.5-GFP reporter HES3 hESC-derived day 3 cardiac mesoderm, cells were respectively pre-gated on the MIXL1-GFP+ and NKX2.5-GFP+ fractions before analysis of PE signal intensity. Multicolor compensation was conducted to control for fluorescent bleedthrough between the PE and GFP channels.
A table with the percentage of viable cells in each lineage that expressed each given surface marker can be found in [Data Citation 4]. Metadata for the surface marker screen is tabulated in Table 5 (available online only).
Table 5. Surface marker screening metadata.
| Well | Antigen | Antibody Clone | Antibody Type | Catalog No. (Biolegend) |
|---|---|---|---|---|
|
LEGENDSCREEN PLATE #1 | ||||
| 1 | Blank | |||
| A2 | CD1a | HI149 | Mouse IgG1, κ | 300106 |
| A3 | CD1b | SN13 (K5- 1B8) | Mouse IgG1, κ | 329108 |
| A4 | CD1c | L161 | Mouse IgG1, κ | 331506 |
| A5 | CD1d | 51.1 | Mouse IgG2b, κ | 350306 |
| A6 | CD2 | RPA-2.10 | Mouse IgG1, κ | 300208 |
| A7 | CD3 | HIT3a | Mouse IgG2a, κ | 300308 |
| A8 | CD4 | RPA-T4 | Mouse IgG1, κ | 300508 |
| A9 | CD5 | UCHT2 | Mouse IgG1, κ | 300608 |
| A10 | CD6 | BL-CD6 | Mouse IgG1, κ | 313906 |
| A11 | CD7 | CD7-6B7 | Mouse IgG2a, κ | 343106 |
| A12 | CD8a | HIT8a | Mouse IgG1, κ | 300908 |
| B1 | CD9 | HI9a | Mouse IgG1, κ | 312106 |
| B2 | CD10 | HI10a | Mouse IgG1, κ | 312204 |
| B3 | CD11a | HI111 | Mouse IgG1, κ | 301208 |
| B4 | CD11b | ICRF44 | Mouse IgG1, κ | 301306 |
| B5 | CD11b (activated) | CBRM1/5 | Mouse IgG1, κ | 301406 |
| B6 | CD11c | 3.9 | Mouse IgG1, κ | 301606 |
| B7 | CD13 | WM15 | Mouse IgG1, κ | 301704 |
| B8 | CD14 | M5E2 | Mouse IgG2a, κ | 301806 |
| B9 | CD15 (SSEA-1) | W6D3 | Mouse IgG1, κ | 323006 |
| B10 | CD16 | 3G8 | Mouse IgG1, κ | 302008 |
| B11 | CD18 | TS1/18 | Mouse IgG1, κ | 302108 |
| B12 | CD19 | HIB19 | Mouse IgG1, κ | 302208 |
| C1 | CD20 | 2H7 | Mouse IgG2b, κ | 302306 |
| C2 | CD21 | Bu32 | Mouse IgG1, κ | 354904 |
| C3 | CD22 | HIB22 | Mouse IgG1, κ | 302506 |
| C4 | CD23 | EBVCS-5 | Mouse IgG1, κ | 338508 |
| C5 | CD24 | ML5 | Mouse IgG2a, κ | 311106 |
| C6 | CD25 | BC96 | Mouse IgG1, κ | 302606 |
| C7 | CD26 | BA5b | Mouse IgG2a, κ | 302706 |
| C8 | CD27 | O323 | Mouse IgG1, κ | 302808 |
| C9 | CD28 | CD28.2 | Mouse IgG1, κ | 302908 |
| C10 | CD29 | TS2/16 | Mouse IgG1, κ | 303004 |
| C11 | CD30 | BY88 | Mouse IgG1, κ | 333906 |
| C12 | CD31 | WM59 | Mouse IgG1, κ | 303106 |
| D1 | CD32 | FUN-2 | Mouse IgG2b, κ | 303206 |
| D2 | CD33 | WM53 | Mouse IgG1, κ | 303404 |
| D3 | CD34 | 581 | Mouse IgG1, κ | 343506 |
| D4 | CD35 | E11 | Mouse IgG1, κ | 333406 |
| D5 | CD36 | 5–271 | Mouse IgG2a, κ | 336206 |
| D6 | CD38 | HIT2 | Mouse IgG1, κ | 303506 |
| D7 | CD39 | A1 | Mouse IgG1, κ | 328208 |
| D8 | CD40 | HB14 | Mouse IgG1, κ | 313006 |
| D9 | CD41 | HIP8 | Mouse IgG1, κ | 303706 |
| D10 | CD42b | HIP1 | Mouse IgG1, κ | 303906 |
| D11 | CD43 | CD43-10G7 | Mouse IgG1, κ | 343204 |
| D12 | CD44 | BJ18 | Mouse IgG1, κ | 338808 |
| E1 | CD45 | HI30 | Mouse IgG1, κ | 304008 |
| E2 | CD45RA | HI100 | Mouse IgG2b, κ | 304108 |
| E3 | CD45RB | MEM-55 | Mouse IgG2b, κ | 310204 |
| E4 | CD45RO | UCHL1 | Mouse IgG2a, κ | 304206 |
| E5 | CD46 | TRA-2–10 | Mouse IgG1 | 352402 |
| E6 | CD47 | CC2C6 | Mouse IgG1, κ | 323108 |
| E7 | CD48 | BJ40 | Mouse IgG1, κ | 336708 |
| E8 | CD49a | TS2/7 | Mouse IgG1, κ | 328304 |
| E9 | CD49c | ASC-1 | Mouse IgG1, κ | 343804 |
| E10 | CD49d | 9F10 | Mouse IgG1, κ | 304304 |
| E11 | CD49e | NKI-SAM-1 | Mouse IgG2b, κ | 328010 |
| E12 | CD49f | GoH3 | Rat IgG2a, κ | 313612 |
| F1 | CD50 (ICAM-3) | CBR-IC3/1 | Mouse IgG1, κ | 330005 |
| F2 | CD51 | NKI-M9 | Mouse IgG2a, κ | 327910 |
| F3 | CD51/61 | 23C6 | Mouse IgG1, κ | 304406 |
| F4 | CD52 | HI186 | Mouse IgG2b, κ | 316006 |
| F5 | CD53 | HI29 | Mouse IgG1, κ | 325406 |
| F6 | CD54 | HA58 | Mouse IgG1, κ | 353106 |
| F7 | CD55 | JS11 | Mouse IgG1, κ | 311308 |
| F8 | CD56 (NCAM) | HCD56 | Mouse IgG1, κ | 318306 |
| F9 | CD57 | HCD57 | Mouse IgM, κ | 322312 |
| F10 | CD58 | TS2/9 | Mouse IgG1, κ | 330905 |
| F11 | CD59 | p282 (H19) | Mouse IgG2a, κ | 304708 |
| F12 | CD61 | VI-PL2 | Mouse IgG1, κ | 336406 |
| G1 | CD62E | HAE-1f | Mouse IgG1, κ | 336008 |
| G2 | CD62L | DREG-56 | Mouse IgG1, κ | 304806 |
| G3 | CD62P (P-Selectin) | AK4 | Mouse IgG1, κ | 304906 |
| G4 | CD63 | H5C6 | Mouse IgG1, κ | 353004 |
| G5 | CD64 | 10.1 | Mouse IgG1, κ | 305008 |
| G6 | CD66a/c/e | ASL-32 | Mouse IgG2b, κ | 342304 |
| G7 | CD66b | G10F5 | Mouse IgM, κ | 305106 |
| G8 | CD69 | FN50 | Mouse IgG1, κ | 310906 |
| G9 | CD70 | 113-16 | Mouse IgG1, κ | 355104 |
| G10 | CD71 | CY1G4 | Mouse IgG2a, κ | 334106 |
| G11 | CD73 | AD2 | Mouse IgG1, κ | 344004 |
| G12 | CD74 | LN2 | Mouse IgG1, κ | 326808 |
| H1 | CD79b | CB3-1 | Mouse IgG1, κ | 341404 |
| H2 | CD80 | 2D10 | Mouse IgG1, κ | 305208 |
| H3 | CD81 | 5A6 | Mouse IgG1, κ | 349506 |
| H4 | CD82 | ASL-24 | Mouse IgG1, κ | 342104 |
| H5 | CD83 | HB15e | Mouse IgG1, κ | 305308 |
| H6 | CD84 | CD84.1.21 | Mouse IgG2a, κ | 326008 |
| H7 | CD85a (ILT5) | MKT5.1 | Rat IgG2a, κ | 337704 |
| H8 | CD85d (ILT4) | 42D1 | Rat IgG2a, κ | 338706 |
| H9 | CD85g (ILT7) | 17G10.2 | Mouse IgG1, κ | 326408 |
| H10 | CD85h (ILT1) | 24 | Mouse IgG2b, κ | 337904 |
| H11 | CD85j (ILT2) | GHI/75 | Mouse IgG2b, κ | 333708 |
| H12 | CD85k (ILT3) | ZM4.1 | Mouse IgG1, κ | 333008 |
|
LEGENDSCREEN PLATE #2 | ||||
| A1 | Blank | |||
| A2 | CD86 | IT2.2 | Mouse IgG2b, κ | 305406 |
| A3 | CD87 | VIM5 | Mouse IgG1, κ | 336906 |
| A4 | CD88 | S5/1 | Mouse IgG2a, κ | 344304 |
| A5 | CD89 | A59 | Mouse IgG1, κ | 354104 |
| A6 | CD90 (Thy1) | 5E10 | Mouse IgG1, κ | 328110 |
| A7 | CD93 | VIMD2 | Mouse IgG1, κ | 336108 |
| A8 | CD94 | DX22 | Mouse IgG1, κ | 305506 |
| A9 | CD95 | DX2 | Mouse IgG1, κ | 305608 |
| A10 | CD96 | NK92.39 | Mouse IgG1, κ | 338406 |
| A11 | CD97 | VIM3b | Mouse IgG1, κ | 336308 |
| A12 | CD99 | HCD99 | Mouse IgG2a, κ | 318008 |
| B1 | CD100 | A8 | Mouse IgG1, κ | 328408 |
| B2 | CD101 (BB27) | BB27 | Mouse IgG1, κ | 331006 |
| B3 | CD102 | CBR-IC2/2 | Mouse IgG2a, κ | 328506 |
| B4 | CD103 | Ber-ACT8 | Mouse IgG1, κ | 350206 |
| B5 | CD104 | 58XB4 | Mouse IgG2a, κ | 327808 |
| B6 | CD105 | 43A3 | Mouse IgG1, κ | 323206 |
| B7 | CD106 | STA | Mouse IgG1, κ | 305806 |
| B8 | CD107a (LAMP-1) | H4A3 | Mouse IgG1, κ | 328608 |
| B9 | CD108 | MEM-150 | Mouse IgM, κ | 315704 |
| B10 | CD109 | W7C5 | Mouse IgG1, κ | 323306 |
| B11 | CD111 | R1.302 | Mouse IgG1, κ | 340404 |
| B12 | CD112 (Nectin-2) | TX31 | Mouse IgG1, κ | 337410 |
| C1 | CD114 | LMM741 | Mouse IgG1, κ | 346106 |
| C2 | CD115 | 9-4D2-1E4 | Rat IgG1, κ | 347304 |
| C3 | CD116 | 4H1 | Mouse IgG1, κ | 305908 |
| C4 | CD117 (c-kit) | 104D2 | Mouse IgG1, κ | 313204 |
| C5 | CD119 (IFN-g R α chain) | GIR-208 | Mouse IgG1, κ | 308606 |
| C6 | CD122 | TU27 | Mouse IgG1, κ | 339006 |
| C7 | CD123 | 6H6 | Mouse IgG1, κ | 306006 |
| C8 | CD124 | G077F6 | Mouse IgG2a, κ | 355004 |
| C9 | CD126 (IL-6Rα) | UV4 | Mouse IgG1, κ | 352804 |
| C10 | CD127 (IL-7Rα) | A019D5 | Mouse IgG1, κ | 351304 |
| C11 | CD129 (IL-9 R) | AH9R7 | Mouse IgG2b, κ | 310404 |
| C12 | CD131 | 1C1 | Mouse IgG1, κ | 306104 |
| D1 | CD132 | TUGh4 | Rat IgG2b, κ | 338606 |
| D2 | CD134 | Ber-ACT35 (ACT35) | Mouse IgG1, κ | 350004 |
| D3 | CD135 | BV10A4H2 | Mouse IgG1, κ | 313306 |
| D4 | CD137 (4-1BB) | 4B4-1 | Mouse IgG1, κ | 309804 |
| D5 | CD137L (4-1BB Ligand) | 5F4 | Mouse IgG1, κ | 311504 |
| D6 | CD138 | DL-101 | Mouse IgG1, κ | 352306 |
| D7 | CD140a | 16A1 | Mouse IgG1, κ | 323506 |
| D8 | CD140b | 18A2 | Mouse IgG1, κ | 323606 |
| D9 | CD141 | M80 | Mouse IgG1, κ | 344104 |
| D10 | CD143 | 5–369 | Mouse IgG1, κ | 344204 |
| D11 | CD144 | BV9 | Mouse IgG2a, κ | 348506 |
| D12 | CD146 | SHM-57 | Mouse IgG2a, κ | 342004 |
| E1 | CD148 | A3 | Mouse IgG1, κ | 328708 |
| E2 | CD150 (SLAM) | A12 (7D4) | Mouse IgG1, κ | 306308 |
| E3 | CD152 | L3D10 | Mouse IgG1, κ | 349906 |
| E4 | CD154 | 24–31 | Mouse IgG1, κ | 310806 |
| E5 | CD155 (PVR) | SKII.4 | Mouse IgG1, κ | 337610 |
| E6 | CD156c (ADAM10) | SHM14 | Mouse IgG1, κ | 352704 |
| E7 | CD158a/h | HP-MA4 | Mouse IgG2b, κ | 339506 |
| E8 | CD158b (KIR2DL2/L3, NKAT2) | DX27 | Mouse IgG2a, κ | 312606 |
| E9 | CD158d | mAb 33 (33) | Mouse IgG1, κ | 347006 |
| E10 | CD158e1 (KIR3DL1, NKB1) | DX9 | Mouse IgG1, κ | 312708 |
| E11 | CD158f | UP-R1 | Mouse IgG1, κ | 341304 |
| E12 | CD161 | HP-3G10 | Mouse IgG1, κ | 339904 |
| F1 | CD162 | KPL-1 | Mouse IgG1, κ | 328806 |
| F2 | CD163 | GHI/61 | Mouse IgG1, κ | 333606 |
| F3 | CD164 | 67D2 | Mouse IgG1, κ | 324808 |
| F4 | CD165 | SN2 (N6- D11) | Mouse IgG1, κ | 329010 |
| F5 | CD166 | 3A6 | Mouse IgG1, κ | 343904 |
| F6 | CD167a (DDR1) | 51D6 | Mouse IgG3, κ | 334006 |
| F7 | CD169 | 7–239 | Mouse IgG1, κ | 346004 |
| F8 | CD170 (Siglec-5) | 1A5 | Mouse IgG1, κ | 352004 |
| F9 | CD172a (SIRPa) | SE5A5 | Mouse IgG1, κ | 323806 |
| F10 | CD172b (SIRPb) | B4B6 | Mouse IgG1, κ | 323906 |
| F11 | CD172g (SIRPg) | LSB2.20 | Mouse IgG1, κ | 336606 |
| F12 | CD178 (Fas-L) | NOK-1 | Mouse IgG1, κ | 306407 |
| G1 | CD179a | HSL96 | Mouse IgG1, κ | 347404 |
| G2 | CD179b | HSL11 | Mouse IgG1, κ | 349804 |
| G3 | CD180 (RP105) | MHR73-11 | Mouse IgG1, κ | 312906 |
| G4 | CD181 (CXCR1) | 8F1/CXCR1 | Mouse IgG2b, κ | 320608 |
| G5 | CD182 (CXCR2) | 5E8/CXCR2 | Mouse IgG1, κ | 320706 |
| G6 | CD183 | G025H7 | Mouse IgG1, κ | 353706 |
| G7 | CD184 (CXCR4) | 12G5 | Mouse IgG2a, κ | 306506 |
| G8 | CD193 (CCR3) | 5E8 | Mouse IgG2b, κ | 310706 |
| G9 | CD195 (CCR5) | T21/8 | Mouse IgG1, κ | 321406 |
| G10 | CD196 | G034E3 | Mouse IgG2b, κ | 353410 |
| G11 | CD197 (CCR7) | G043H7 | Mouse IgG2a, κ | 353204 |
| G12 | CD200 (OX2) | OX-104 | Mouse IgG1, κ | 329206 |
| H1 | CD200 R | OX-108 | Mouse IgG1, κ | 329306 |
| H2 | CD201 (EPCR) | RCR-401 | Rat IgG1, κ | 351904 |
| H3 | CD202b ( Tie2/Tek) | 33.1 (Ab33) | Mouse IgG1, κ | 334206 |
| H4 | CD203c (E-NPP3) | NP4D6 | Mouse IgG1, κ | 324606 |
| H5 | CD205 (DEC- 205) | HD30 | Mouse IgG1, κ | 342204 |
| H6 | CD206 (MMR) | 15-2 | Mouse IgG1, κ | 321106 |
| H7 | CD207 (Langerin) | 10E2 | Mouse IgG1, κ | 352204 |
| H8 | CD209 (DC- SIGN) | 9E9A8 | Mouse IgG2a, κ | 330106 |
| H9 | CD210 (IL- 10 R) | 3F9 | Rat IgG2a, κ | 308804 |
| H10 | CD213a2 | SHM38 | Mouse IgG1, κ | 354404 |
| H11 | CD215 (IL- 15Rα) | JM7A4 | Mouse IgG2b, κ | 330208 |
| H12 | CD218a (IL-18Rα) | H44 | Mouse IgG1, κ | 313808 |
|
LEGENDSCREEN PLATE #3 | ||||
| A1 | Blank | |||
| A2 | CD220 | B6.220 | Mouse IgG2b, κ | 352604 |
| A3 | CD221 (IGF-1R) | 1H7/CD221 | Mouse IgG1, κ | 351806 |
| A4 | CD226 (DNAM-1) | 11A8 | Mouse IgG1, κ | 338306 |
| A5 | CD229 (Ly-9) | HLy-9.1.25 | Mouse IgG1, κ | 326108 |
| A6 | CD231 (TALLA) | SN1a (M3- 3D9) | Mouse IgG1, κ | 329406 |
| A7 | CD235ab | HIR2 | Mouse IgG2b, κ | 306604 |
| A8 | CD243 | UIC2 | Mouse IgG2a, κ | 348606 |
| A9 | CD244 (2B4) | C1.7 | Mouse IgG1, κ | 329508 |
| A10 | CD245 (p220/240) | DY12 | Mouse IgG1, κ | Inquire |
| A11 | CD252 (OX40L) | 11C3.1 | Mouse IgG1, κ | 326308 |
| A12 | CD253 (Trail) | RIK-2 | Mouse IgG1, κ | 308206 |
| B1 | CD254 | MIH24 | Mouse IgG1, κ | 347504 |
| B2 | CD255 (TWEAK) | CARL-1 | Mouse IgG3, κ | 308305 |
| B3 | CD257 (BAFF, BLYS) | T7–241 | Mouse IgG1, κ | 318606 |
| B4 | CD258 (LIGHT) | T5–39 | Mouse IgG2a, κ | 318706 |
| B5 | CD261 (DR4, TRAIL-R1) | DJR1 | Mouse IgG1, κ | 307206 |
| B6 | CD262 (DR5, TRAIL-R2) | DJR2–4 (7–8) | Mouse IgG1, κ | 307406 |
| B7 | CD263 (DcR1, TRAIL-R3) | DJR3 | Mouse IgG1, κ | 307006 |
| B8 | CD266 (Fn14, TWEAK Receptor) | ITEM-1 | Mouse IgG1, κ | 314004 |
| B9 | CD267 (TACI) | 1A1 | Rat IgG2a, κ | 311906 |
| B10 | CD268 (BAFF-R, BAFFR) | 11C1 | Mouse IgG1, κ | 316906 |
| B11 | CD270 (HVEM) | 122 | Mouse IgG1, κ | 318806 |
| B12 | CD271 | ME20.4 | Mouse IgG1, κ | 345106 |
| C1 | CD273 (B7- DC, PD-L2) | 24F.10C12 | Mouse IgG2a, κ | 329606 |
| C2 | CD274 (B7- H1, PD-L1) | 29E.2A3 | Mouse IgG2b, κ | 329706 |
| C3 | CD275 (B7- H2, B7-RP1, ICOSL) | 9F.8A4 | Mouse IgG1, κ | 329806 |
| C4 | CD276 | MIH42 | Mouse IgG1, κ | 351004 |
| C5 | CD277 | BT3.1 | Mouse IgG1, κ | 342704 |
| C6 | CD278 (ICOS) | C398.4A | Arm. Hamster IgG | 313508 |
| C7 | CD279 (PD-1) | EH12.2H7 | Mouse IgG1, κ | 329906 |
| C8 | CD282 (TLR2) | TL2.1 | Mouse IgG2a, κ | 309708 |
| C9 | CD284 (TLR4) | HTA125 | Mouse IgG2a, κ | 312806 |
| C10 | CD286 (TLR6) | TLR6.127 | Mouse IgG1, κ | 334708 |
| C11 | CD290 | 3C10C5 | Mouse IgG1, κ | 354604 |
| C12 | CD294 | BM16 | Rat IgG2a, κ | 350106 |
| D1 | CD298 | LNH-94 | Mouse IgG1, κ | 341704 |
| D2 | CD300e (IREM-2) | UP-H2 | Mouse IgG1, κ | 339704 |
| D3 | CD300F | UP-D2 | Mouse IgG1, κ | 340604 |
| D4 | CD301 | H037G3 | Mouse IgG2a, κ | 354704 |
| D5 | CD303 | 201A | Mouse IgG2a, κ | 354204 |
| D6 | CD304 | 12C2 | Mouse IgG2a, κ | 354504 |
| D7 | CD307 | 509f6 | Mouse IgG2a, κ | 340304 |
| D8 | CD307d (FcRL4) | 413D12 | Mouse IgG2b, κ | 340204 |
| D9 | CD314 (NKG2D) | 1D11 | Mouse IgG1, κ | 320806 |
| D10 | CD317 | RS38E | Mouse IgG1, κ | 348406 |
| D11 | CD318 (CDCP1) | CUB1 | Mouse IgG2b, κ | 324006 |
| D12 | CD319 (CRACC) | 162.1 | Mouse IgG2b, κ | 331806 |
| E1 | CD324 (E- Cadherin) | 67A4 | Mouse IgG1, κ | 324106 |
| E2 | CD325 | 8C11 | Mouse IgG1, κ | 350805 |
| E3 | CD326 (Ep- CAM) | 9C4 | Mouse IgG2b, κ | 324206 |
| E4 | CD328 (Siglec-7) | 6–434 | Mouse IgG1, κ | 339204 |
| E5 | CD334 (FGFR4) | 4FR6D3 | Mouse IgG1, κ | 324306 |
| E6 | CD335 (NKp46) | 9E2 | Mouse IgG1, κ | 331908 |
| E7 | CD336 (NKp44) | P44-8 | Mouse IgG1, κ | 325108 |
| E8 | CD337 (NKp30) | P30-15 | Mouse IgG1, κ | 325208 |
| E9 | CD338 (ABCG2) | 5D3 | Mouse IgG2b, κ | 332008 |
| E10 | CD340 (erbB2/ HER-2) | 24D2 | Mouse IgG1, κ | 324406 |
| E11 | CD344 (Frizzled-4) | CH3A4A7 | Mouse IgG1, κ | 326606 |
| E12 | CD351 | TX61 | Mouse IgG1, κ | 137306 |
| F1 | CD352 (NTB-A) | NT-7 | Mouse IgG1, κ | 317208 |
| F2 | CD354 (TREM-1) | TREM-26 | Mouse IgG1, κ | 314906 |
| F3 | CD355 (CRTAM) | Cr24.1 | Mouse IgG2a, κ | 339106 |
| F4 | CD357 (GITR) | 621 | Mouse IgG1, κ | 311604 |
| F5 | CD360 (IL- 21R) | 2G1-K12 | Mouse IgG1, κ | 347806 |
| F6 | β2- micro- globulin | 2M2 | Mouse IgG1, κ | 316306 |
| F7 | BTLA | MIH26 | Mouse IgG2a, κ | 344506 |
| F8 | C3AR | hC3aRZ8 | Mouse IgG2b | 345804 |
| F9 | C5L2 | 1D9-M12 | Mouse IgG2a, κ | 342404 |
| F10 | CCR10 | 5/1/6588 | Arm. hamster IgG | 341504 |
| F11 | CLEC12A | 50C1 | Mouse IgG2a, κ | 353604 |
| F12 | CLEC9A | 8F9 | Mouse IgG2a, κ | 353804 |
| G1 | CX3CR1 | 2A9-1 | Rat IgG2b, κ | 341604 |
| G2 | CXCR7 | 8F11-M16 | Mouse IgG2b, κ | 331104 |
| G3 | δ-Opioid Receptor | DOR7D2A4 | Mouse IgG2b, κ | 327206 |
| G4 | DLL1 | MHD1–314 | Mouse IgG1, κ | 346404 |
| G5 | DLL4 | MHD4–46 | Mouse IgG1, κ | 346506 |
| G6 | DR3 (TRAMP) | JD3 | Mouse IgG1, κ | 307106 |
| G7 | EGFR | AY13 | Mouse IgG1, κ | 352904 |
| G8 | erbB3/HER-3 | 1B4C3 | Mouse IgG2a, κ | 324706 |
| G9 | FcεRIα | AER-37 (CRA-1) | Mouse IgG2b, κ | 334610 |
| G10 | FcRL6 | 2H3 | Mouse IgG2b, κ | Inquire |
| G11 | Galectin-9 | 9M1-3 | Mouse IgG1, κ | 348906 |
| G12 | GARP (LRRC32) | 7B11 | Mouse IgG2b, κ | 352504 |
| H1 | HLA-A,B,C | W6/32 | Mouse IgG2a, κ | 311406 |
| H2 | HLA-A2 | BB7.2 | Mouse IgG2b, κ | 343306 |
| H3 | HLA-DQ | HLADQ1 | Mouse IgG1, κ | 318106 |
| H4 | HLA-DR | L243 | Mouse IgG2a, κ | 307606 |
| H5 | HLA-E | 3D12 | Mouse IgG1, κ | 342604 |
| H6 | HLA-G | 87G | Mouse IgG2a, κ | 335906 |
| H7 | IFN-g R b chain | 2HUB-159 | Hamster IgG | 308504 |
| H8 | Ig light chain k | MHK-49 | Mouse IgG1, κ | 316508 |
| H9 | Ig light chain λ | MHL-38 | Mouse IgG2a, κ | 316608 |
| H10 | IgD | IA6-2 | Mouse IgG2a, κ | 348204 |
| H11 | IgM | MHM-88 | Mouse IgG1, κ | 314508 |
| H12 | IL-28RA | MHLICR2a | Mouse IgG2a, κ | 337804 |
|
LEGENDSCREEN PLATE #4 | ||||
| A1 | Blank | |||
| A2 | Integrin α9β1 | Y9A2 | Mouse IgG1, κ | 351606 |
| A3 | integrin β5 | AST-3T | Mouse IgG2a, κ | 345204 |
| A4 | integrin β7 | FIB504 | Rat IgG2a, κ | 321204 |
| A5 | Jagged 2 | MHJ2–523 | Mouse IgG1, κ | 346904 |
| A6 | LAP | TW4-6H10 | Mouse IgG1, κ | 349704 |
| A7 | Lymphotoxin b Receptor (LT-bR) | 31G4D8 | Mouse IgG2b, κ | 322008 |
| A8 | Mac-2 (Ga- lectin-3) | Gal397 | Mouse IgG1, κ | 126705 |
| A9 | MAIR-II | TX45 | Mouse IgG1, κ | 334804 |
| A10 | MICA/MICB | 6D4 | Mouse IgG2a, κ | 320906 |
| A11 | MSC (W3D5) | W3D5 | Mouse IgG2a, κ | 327506 |
| A12 | MSC (W5C5) | W5C5 | Mouse IgG1, κ | 327406 |
| B1 | MSC (W7C6) | W7C6 | Mouse IgG1, κ | 327606 |
| B2 | MSC and NPC (W4A5) | W4A5 | Mouse IgG1, κ | 330806 |
| B3 | MSCA-1 (MSC, W8B2) | W8B2 | Mouse IgG1, κ | 327306 |
| B4 | NKp80 | 5D12 | Mouse IgG1, κ | 346706 |
| B5 | Notch 1 | MHN1–519 | Mouse IgG1, κ | 352106 |
| B6 | Notch 2 | MHN2–25 | Mouse IgG2a, κ | 348304 |
| B7 | Notch 3 | MHN3–21 | Mouse IgG1, κ | 345406 |
| B8 | Notch 4 | MHN4-2 | Mouse IgG1, κ | 349004 |
| B9 | NPC (57D2) | 57D2 | Mouse IgG1, κ | 327706 |
| B10 | Podoplanin | NC-08 | Rat IgG2a, λ | 337004 |
| B11 | Pre-BCR | HSL2 | Mouse IgG1, κ | 347904 |
| B12 | PSMA | LNI-17 | Mouse IgG1, κ | 342504 |
| C1 | Siglec-10 | 5G6 | Mouse IgG1, κ | 347604 |
| C2 | Siglec-8 | 7C9 | Mouse IgG1, κ | 347104 |
| C3 | Siglec-9 | K8 | Mouse IgG1, κ | 351504 |
| C4 | SSEA-1 | MC-480 | Mouse IgM, κ | 125606 |
| C5 | SSEA-3 | MC-631 | Rat IgM, κ | 330312 |
| C6 | SSEA-4 | MC-813-70 | Mouse IgG3, κ | 330406 |
| C7 | SSEA-5 | 8.00E+11 | Mouse IgG1, κ | 355204 |
| C8 | TCR g/d | B1 | Mouse IgG1, κ | 331210 |
| C9 | TCR Vβ13.2 | H132 | Mouse IgG1, κ | 333108 |
| C10 | TCR Vβ23 | αHUT7 | Mouse IgG1, κ | 349406 |
| C11 | TCR Vβ8 | JR2 (JR.2) | Mouse IgG2b, κ | 348104 |
| C12 | TCR Vβ9 | MKB1 | Mouse IgG2b, κ | 349204 |
| D1 | TCR Vδ2 | B6 | Mouse IgG1, κ | 331408 |
| D2 | TCR Vg9 | B3 | Mouse IgG1, κ | 331308 |
| D3 | TCR Vα24- Jα18 | 6B11 | Mouse IgG1, κ | 342904 |
| D4 | TCR Vα7.2 | 3C10 | Mouse IgG1, κ | 351706 |
| D5 | TCR α/β | IP26 | Mouse IgG1, κ | 306708 |
| D6 | Tim-1 | 1D12 | Mouse IgG1, κ | 353904 |
| D7 | Tim-3 | F38-2E2 | Mouse IgG1, κ | 345006 |
| D8 | Tim-4 | 9F4 | Mouse IgG1, κ | 354004 |
| D9 | TLT-2 | MIH61 | Mouse IgG1, κ | 351104 |
| D10 | TRA-1-60-R | TRA-1-60-R | Mouse IgM, κ | 330610 |
| D11 | TRA-1–81 | TRA-1–81 | Mouse IgM, κ | 330708 |
| D12 | TSLPR (TSLP-R) | 1B4 | Mouse IgG1, κ | 322806 |
| E1 | Ms IgG1, κ ITCL | MOPC-21 | Mouse IgG1, κ | 400112 |
| E2 | Ms IgG2a, κ ITCL | MOPC-173 | Mouse IgG2a, κ | 400212 |
| E3 | Ms IgG2b, κ ITCL | MPC-11 | Mouse IgG2b, κ | 400314 |
| E4 | Ms IgG3, κ ITCL | MG3–35 | Mouse IgG3, κ | 401320 |
| E5 | Ms IgM, κ ITCL | MM-30 | Mouse IgM, κ | 401609 |
| E6 | Rat IgG1, κ ITCL | RTK2071 | Rat IgG1, κ | 400408 |
| E7 | Rat IgG2a, κ ITCL | RTK2758 | Rat IgG2a, κ | 400508 |
| E8 | Rat IgG2b, κ ITCL | RTK4530 | Rat IgG2b, κ | 400636 |
| E9 | Rat IgM, κ ITCL | RTK2118 | Rat IgM, κ | 400808 |
| E10 | AH IgG, ITCL | HTK888 | Arm. Hamster IgG | 400907 |
| E11 | Blank | |||
| E12 | Blank | |||
| F1 | Blank | |||
| F2 | Blank | |||
| F3 | Blank | |||
| F4 | Blank | |||
| F5 | Blank | |||
| F6 | Blank | |||
| F7 | Blank | |||
| F8 | Blank | |||
| F9 | Blank | |||
| F10 | Blank | |||
| F11 | Blank | |||
| F12 | Blank | |||
| G1 | Blank | |||
| G2 | Blank | |||
| G3 | Blank | |||
| G4 | Blank | |||
| G5 | Blank | |||
| G6 | Blank | |||
| G7 | Blank | |||
| G8 | Blank | |||
| G9 | Blank | |||
| G10 | Blank | |||
| G11 | Blank | |||
| G12 | Blank | |||
| H1 | Blank | |||
| H2 | Blank | |||
| H3 | Blank | |||
| H4 | Blank | |||
| H5 | Blank | |||
| H6 | Blank | |||
| H7 | Blank | |||
| H8 | Blank | |||
| H9 | Blank | |||
|
Plate 4 | ||||
| Well ID | Specificity | Clone | Isotype | BioLegend Cat. No. |
| H10 | Blank | |||
| H11 | Blank | |||
| H12 | Blank | |||
Code availability
All custom code used in this work is available at https://github.com/kundajelab/mesoderm. This includes R Markdown files that reproduce the figures in this paper.
For RNA-seq processing and quantification, we used STAR 2.4 (ref. 14), RSEM 1.2.21 (ref. 15), and Skewer 0.1.127 (ref. 12). The full parameter settings for STAR and RSEM can be found in STAR_RSEM.sh and STAR_RSEM_prep.py in the Github repository above. For bulk-population RNA-seq read processing, we used the following parameters for Skewer:
-x
AGATCGGAAGAGCACACGTCTGAACTCCAGTCACNNNNNNATCTCGTATGCCGTCTTCTGCTTG
-y
AGATCGGAAGAGCGTCGTGTAGGGAAAGAGTGTAGATCTCGGTGGTCGCCGTATCATT
-t 16 -q 21 -l 21 -n -u -f sanger
For single-cell RNA-seq read processing, we used the following parameters for Skewer:
-x
CTGTCTCTTATACACATCTCCGAGCCCACGAGACNNNNNNNNATCTCGTATGCCGTCTTCTGCTTG
-y
CTGTCTCTTATACACATCTGACGCTGCCGACGANNNNNNNNGTGTAGATCTCGGTGGTCGCCGTATCATT
-t 16 -q 21 -l 21 -n -u -f sanger
For ATAC-seq processing, we used commit 9077b9... of the ATAqC pipeline20. In turn, this used MACS2 2.1.0 (ref. 23) and Bowtie2 2.2.6 (ref. 21).
Differentiation
Human pluripotent stem cell culture
H7, MIXL1-GFP HES3, NKX2.5-GFP HES3, SOX17-mCherry H9, pCAG-GFP H7, EF1A-BCL2-2A-GFP H9 and UBC-Luciferase-2A-tdTomato; EF1A-BCL2-2A-GFP H9 hESCs and BJC1 hiPSCs were routinely propagated feeder-free in mTeSR1 medium (StemCell Technologies)+1% penicillin/streptomycin (Gibco) on cell culture plastics coated with Geltrex basement membrane matrix (Gibco). Undifferentiated human pluripotent stem cells (hPSCs) were maintained at high quality with particular care to avoid any spontaneous differentiation, which would confound downstream differentiation. Unless otherwise indicated, the majority of experiments performed in this study were conducted using H7 hESCs, including all bulk-population RNA-seq, single-cell RNA-seq, and ATAC-seq experiments.
Directed differentiation in defined medium
Partially-confluent wells of undifferentiated hPSCs were dissociated into very fine clumps using Accutase (Gibco) and sparsely passaged 1:12-1:20 onto new Geltrex-coated cell culture plates in mTeSR1 supplemented with 1 μM thiazovivin (Tocris; a ROCK inhibitor to prevent cell death after dissociation) overnight. Seeding hPSCs sparsely prior to differentiation was critical to prevent cellular overgrowth during differentiation, especially during long-duration differentiation. hPSCs were allowed to plate overnight. The following morning, they were briefly washed (in DMEM/F12) before the addition of differentiation medium. All differentiation was conducted in serum-free, feeder-free and monolayer conditions in chemically-defined CDM2 basal medium.
The composition of CDM2 basal medium28 was as follows: 50% IMDM (+GlutaMAX, +HEPES, +Sodium Bicarbonate; Gibco, 31980-097)+50% F12 (+GlutaMAX; Gibco, 31765-092)+1 mgml−1 polyvinyl alcohol (Sigma, P8136-250G)+1% v/v concentrated lipids (Gibco, 11905-031)+450 μM monothioglycerol (Sigma, M6145)+0.7 μgml−1 insulin (Roche, 1376497)+15 μgml−1 transferrin (Roche, 652202)+1% v/v penicillin/streptomycin (Gibco). Polyvinyl alcohol was brought into solution by gentle warming and magnetic stirring in IMDM/F12 media before addition of additional culture supplements.
Primitive streak induction
As previously described8, after overnight plating, hPSCs were briefly washed (with DMEM/F12) and then differentiated into either anterior primitive streak (30 ngml−1 Activin A+4 μM CHIR99021+20 ngml−1 FGF2+100 nM PIK90; for subsequent paraxial mesoderm induction) or mid primitive streak (30 mgml−1 Activin A+40 ngml−1 BMP4+6 μM CHIR99021+20 ngml−1 FGF2+100 nM PIK90; for subsequent cardiac mesoderm induction) for 24 h. Though both types of primitive streak broadly expressed pan-primitive streak markers (e.g., MIXL1 and BRACHYURY), anterior and mid primitive streak lineages were distinguished by expression of distinct region-specific markers and differing developmental competence to develop into downstream lineages8.
Subsequently, day 1 anterior primitive streak was briefly washed (DMEM/F12) and differentiated towards day 2 paraxial mesoderm for 24 h (1 μM A-83-01+3 μM CHIR99021+250 nM LDN-193189 [DM3189]+20 ngml−1 FGF2). Separately, day 1 mid primitive streak was differentiated towards day 2 lateral mesoderm for 24 h (1 μM A-83-01+30 ngml−1 BMP4+1 μM C59; with 2 μM SB-505124 sometimes used instead of A-83-01)8.
Paraxial mesoderm downstream differentiation
Day 2 paraxial mesoderm was briefly washed (DMEM/F12) and further differentiated into day 3 early somite precursors for 24 hs (1 μM A-83-01+250 nM LDN-193189+1 μM C59+500 nM PD0325901). Subsequently, day 3 early somites were dorsoventrally patterned into either ventral somites/sclerotome (5 nM 21 K+1 μM C59) or dorsal somites/dermomyotome (3 μM CHIR99021+150 nM Vismodegib). Sclerotome induction was conducted for 48–72 h (leading to day 5–6 ventral somite progenitors). For dermomyotome induction, sometimes dermomyotome was induced in the presence of 50 ngml−1 BMP4 to upregulate PAX7 after 48 h of BMP4+CHIR99021+Vismodegib differentiation (leading to day 5 dermomyotome progenitors)8. Media was changed every 24 h for all steps. The small-molecule Hedgehog agonist 21 K29 was commercially synthesized.
Lateral/cardiac downstream differentiation
Day 2 lateral mesoderm was differentiated into day 4 cardiac mesoderm by treating them with 1 μM A8301+30 ngml−1 BMP4+1 μM C59+20 ngml−1 FGF2 for 48 h, or alternatively, with 1 μM A8301+30 ngml−1 BMP4+20 ngml−1 FGF2 for 24 h followed by 25 ngml−1 Activin+30 ngml−1 BMP4+1 μM C59 for the next 24 h. Subsequently, day 4 cardiac mesoderm was briefly washed (DMEM/F12) and treated with 30 ngml−1 BMP4+1 μM XAV939+200 μg/ml 2-phospho-ascorbic acid (Sigma) for 48–96 h to yield day 6–8 cardiomyocyte-containing populations. Spontaneously contracting cardiomyocyte foci were evident from day 8 onwards8.
Data Records
The raw RNA-seq data (bulk-population and single-cell) and ATAC-seq data can be found at SRA under BioProject PRJNA319573 (accession number SRP073808) [Data Citation 1].
Reproducible peak calls on our ATAC-seq data, as well as transcript per million (TPM) values for each gene and sample in our bulk-population and single-cell RNA-seq data, can be found at GEO under accession number GSE85066 [Data Citation 2]. Bulk-population RNA-seq metadata and mapping statistics can be found in Table 2, while single-cell RNA-seq mapping statistics are in Table 3 (available online only). ATAC-seq metadata can be found in Table 4 (available online only).
For ease of usage, the collated bulk-population RNA-seq data can be viewed at http://cs.stanford.edu/∼zhenghao/mesoderm_gene_atlas. As described above, an augmented spreadsheet with TPM values for each gene (for bulk-population RNA-seq data) and additional annotations about whether each gene corresponds to a potential cell surface marker and whether the gene was differentially expressed between conditions can be found on Figshare with DOI 10.6084/m9.figshare.3842835 [Data Citation 3].
Processed surface marker data (a table with the percentage of cells expressing each marker in each cell type) can be found on Figshare with DOI 10.6084/m9.figshare.3505817 [Data Citation 4]. Surface marker screening metadata is in Table 5 (available online only).
The full set of ATAC-seq quality control graphs for all of our samples can be found on Figshare with DOI 10.6084/m9.figshare.3507167 [Data Citation 5].
Technical Validation
Bulk-population RNA-seq
As mentioned above (see Methods), we only analyzed samples with at least 10,000,000 uniquely mapping reads and with at least 50% of reads uniquely mapping. On average, each sample had 45 M uniquely mapping reads with 69% of reads uniquely mapping; full numbers and percentages are in Table 2.
We used FastQC30 to measure the per-base sequence quality for each of our bulk-population RNA-seq experiments. All of the samples passed this quality check (i.e., for each base, the distribution of quality scores had a lower quartile of more than 10 and a median of more than 25). We show a representative FastQC plot (of the first sample we assayed) in Fig. 2a.
Figure 2. RNA-seq data quality and visualization.

(a). Bulk-population RNA-seq FastQC quality scores across read position, shown for a representative sample (D0 hESC). (b). PCA plot of bulk-population RNA-seq data, based on the top 500 genes by variance across all samples, and using log2 TPM values. (c). Single-cell RNA-seq FastQC quality scores across read position, shown for a representative sample (D2.25 somitomeres). (d). PCA plot of single-cell RNA-seq data, based on the top 500 genes by variance across all cells, and using log2 TPM values. (e). Black: Plot of density against standardized log2 TPM for single-cell RNA-seq data across all genes in all cells, after removing zeroes. Red: Fitted normal distribution. (f). Plot of single-cell variability (s.d.) against mean expression value for each gene, shown for a representative cell type (paraxial mesoderm).
We also used principal component analysis (PCA) to visually inspect how the samples were distributed in log2(TPM) space. Applying PCA to the 500 genes with highest variance across all samples revealed the presence of batch effects. After correcting for batch effects (see Methods), the PCA plot showed tight clustering (Fig. 2b) among samples and implicitly suggested the developmental trajectory of the cells, starting from human embryonic stem cells in the bottom left and moving upwards towards cardiac mesoderm and somites and their derivatives. An R Markdown script to reproduce Fig. 2b is provided in bulkDataViz.Rmd in our Github repository.
Lastly, in our related publication8, we independently validated our RNA-seq results by qPCR. Specifically, we conducted qPCR to measure the mRNA expression levels of key genes known to be lineage markers for the various cell types in our study (e.g., TBX6 and MSGN1 for paraxial mesoderm; PARAXIS, MEOX1, and FOXC2 in the somites). These qPCR expression patterns corroborated our RNA-seq results8.
Single-cell RNA-seq
Before sequencing, we used an automated microscope to image each of the cell-capture wells on our Fluidigm C1 chips and manually inspected each image; for subsequent single-cell RNA-seq library construction we only used libraries from wells that contained exactly one cell. After sequencing, we filtered out cells with fewer than 1 million uniquely mapping reads or with fewer than 70% of reads uniquely mapping. Unfortunately, under these stringent selection critera, all cardiac mesoderm cell RNA-seq libraries were discarded; we ultimately retained 498 single cells out of 651. Full statistics of the cells are provided in Table 3 (available online only).
As with the bulk-population RNA-seq data, we used FastQC30 to check the per-base sequence quality of each experiment. All of the cells passed this quality check (i.e., for each base, the distribution of quality scores had a lower quartile of more than 10 and a median of more than 25), with a representative FastQC plot in Fig. 2c.
To visualize the distribution of single cells, we once again used PCA on the 500 genes with highest variance (Fig. 2d) in log2(TPM) space. As expected, the single-cell RNA-seq libraries separated by cell type, with cell types that are closer to each other biologically (and temporally) tending to cluster together. We note that each cell type was loaded onto a different Fluidigm C1 chip, and due to resource constraints we were only able to use one chip per cell type. This means that cell type is perfectly confounded with chip in our single-cell RNA-seq experiments, and in particular, we cannot tell from the PCA the degree to which batch/chip effects are responsible for the observed separation between cell types.
To tackle this problem, for each cell type, we measured the overall Pearson correlation between the average expression in the single cells and the corresponding average expression in the bulk-population RNA-seq experiments, all in log2 TPM units. On average, correlation was 0.82, varying from 0.76 to 0.87 depending on cell type. To ensure that this behavior was not driven solely by housekeeping genes, we looked at key marker genes expressed across our cell types (e.g., MIXL1 and BRACHYURY in primitive streak; MSGN1 and DLL3 in paraxial mesoderm; HAND1 and FOXF1 in lateral mesoderm; HOPX in somitomeres; FOXC2 and PAX9 in sclerotome). Single-cell RNA-seq expression patterns of these archetypic marker genes were consistent with independent measures from bulk-population RNA-seq, qPCR, flow cytometry, and immunostaining (data in (ref. 8)).
As technical checks, we also examined the distribution of TPM values across all genes and cells. This followed a roughly log-normal distribution (Fig. 2e) after removing zeros, as expected. Finally, for each cell type, we plotted the standard deviation of each gene against its mean expression value (shown for paraxial mesoderm in Fig. 2f), obtaining for each cell type an expected curve where standard deviation is lowest when average expression is very low (because the expression of the gene in each cell is close to zero) or very high (because high expression translates into a large number of reads, allowing us to reduce technical variation from sampling error).
The script to reproduce Fig. 2d–f is provided
scDataViz.Rmd
. The correlation between average expression in single cells and the bulk population can be analyzed by running
scAverageCorrelation.r
.
ATAC-seq
Through the ATAqC pipeline20, we calculated a variety of quality metrics to validate our ATAC-seq data. First, we looked at how many reads remained in each replicate after removing reads that did not successfully align, multi-mapping reads, duplicate reads, and mitochondrial reads. We had two replicates per cell type, and on average, each replicate had 46 M reads remaining, enough to robustly call peaks.
We then looked at the fragment length distribution of the remaining reads; we show a representative plot from lateral mesoderm in Fig. 3a. A ‘good’ ATAC-seq experiment will have a majority of reads falling in the nucleosome-free region (NFR), with a mono-nucleosomal peak representing reads that cut on both sides of a nucleosome (≈200 bp in length). All of our samples displayed a mono-nucleosome peak, with 60–70% of reads falling in the NFR.
Figure 3. ATAC-seq data quality metrics.

(a). Enrichment of ATAC-seq signal around transcription start sites (TSS), shown for a representative sample (lateral mesoderm). Top: enrichment around individual TSS. Bottom: aggregated enrichment around all TSS's. (b). Fragment length distribution of ATAC-seq reads from a representative sample (lateral mesoderm). Most of the reads fall into the nucleosome-free region (<150 bp) and a clear mono-nucleosome peak can be seen. (c). Irreproducible rate (IDR) analysis of ATAC-seq peaks from lateral mesoderm. The scatter plot shows one point for every peak, with its location representing in rank in each replicate. For downstream analysis, we only consider peaks shown in black (reproducible at an IDR rate of 0.1), which have ranks that are consistent between replicates.
We also studied the enrichment of reads falling into transcription start sites (TSS), as TSS are known to be open chromatin sites (Fig. 3b; lateral mesoderm). On average, the enrichment of reads at TSS was 10.4x, with a range from 4.6x to 22.3x.
Next, we looked at the number of peaks called across each replicate. Because of the variability in quality across the experiments (e.g., some experiments had a higher TSS enrichment and/or more reads), we first subsampled each replicate to have a maximum of 35 M reads (post-filtering). We then used MACS2 (ref. 23) to call peaks on each replicate independently, before using an IDR analysis24 to identify peaks that were reproducible between the two replicates for each cell type (Fig. 3c). Using an IDR threshold of 0.1, we found an average of 91 K reproducible peaks per cell type.
Full statistics and metadata for each replicate is provided in Table 4 (available online only), including additional quality metrics such as library complexity metrics, the fraction of NFR to mono-nucleosome reads, and the number of reads falling in universal DNase-I hypersensitive regions, promoter regions, enhancer regions, and called peak regions. To compute these, we used putative promoter, enhancer, and DHS annotations from 127 cell types and tissues from the Roadmap Epigenomics Project. These annotations are provided in the flagship Roadmap Epigenomics Project publication31 and are available from the supplementary website http://compbio.mit.edu/roadmap in the ‘DNase-I accessible regulatory regions’ section. In brief, DNase-seq based chromatin accessible regions were labeled as promoter or enhancer based on chromatin state maps learned using 5 core histone modifications across the 127 cell types and tissues.
The graphs in Fig. 3 were taken from the output of the ATAqC pipeline for one representative sample (lateral mesoderm). The full set of graphs for all of our samples can be found in [Data Citation 5].
High-throughput surface marker screening
For validation, we focused on surface markers with lineage-specific expression (Fig. 4), and chose two surface markers for in-depth in vivo and in vitro validation: DLL1 (a marker of paraxial mesoderm) and GARP (a marker of cardiac mesoderm). In situ hybridization of zebrafish homologs of these genes (deltaC, the homolog of human DLL1 and lrrc32, the homolog of human GARP) was conducted in zebrafish embryos, which revealed fairly specific expression of deltaC in paraxial mesoderm and that of lrrc32 in the developing heart tube in vivo8. Additionally, fluorescence-activated cell sorting (FACS) of DLL1+ cells from hESC-derived day 2 paraxial mesoderm cultures followed by bulk-population and single-cell RNA-seq revealed that all DLL1+ cells essentially expressed paraxial mesoderm transcription factors at the single-cell level8. Collectively, this reaffirmed that DLL1 and GARP respectively mark human paraxial and cardiac mesoderm.
Figure 4. High-throughput surface marker screening.

We show here a heatmap of all surface markers whose expression varied considerably across cell types, filtering out markers where less than 30% or more than 70% of cells across all cell types expressed the marker. The % refers to the percentage of cells of a given type that expressed a marker.
Differentiation
Our related publication8 focused on establishing the identity and function of the derived cell types, and we refer readers interested in those details to that manuscript. In brief, we verified cellular function through in vivo transplantation experiments and we assessed cellular identity and purity through molecular analyses of marker expression (RNA-seq, ATAC-seq, immunostaining, and flow cytometry).
On the molecular side, for each cell type we identified archetypic genes and surface markers based on biological knowledge and prior literature. We confirmed that the key genes were expressed at a population level through bulk RNA-seq and qPCR; then, through single-cell RNA-seq, immunostaining, or flow cytometry, we verified that the population was suitably homogeneous for those genes and surface markers8. On the basis of those metrics, the cell populations we derived were generally between 80 and 99% pure. Motif enrichment analysis of the open chromatin regions in each cell type (as measured by ATAC-seq) also yielded results consistent with their cellular identity, e.g., GATA motifs were significantly enriched in lateral and cardiac mesoderm.
We conducted transplantation experiments in immunodeficient mice to further verify the function of two human mesodermal cell-types derived from our differentiation process, namely sclerotome and cardiac mesoderm8. Sclerotome cells subcutaneously injected into immunodeficient mice self-organized to form an ectopic human bone, undergoing ossification, displaying spatial structure expected of human bone, and even attracting and becoming vascularized by mouse blood vessels. For the cardiac mesoderm, we first further differentiated them into cardiomyocytes through WNT blockade and BMP inhibition for four days and engineered them to express a constitutively-expressed luciferase reporter gene. To further test the functionality of these ESC-derived human cardiomyocytes, we developed an experimental system wherein ventricular fragments from week 15–17 human fetal heart32 were subcutaneously implanted into the mouse ear. We then transplanted ESC-derived cardiomyocytes directly into the human fetal heart graft and found that they engrafted the human heart tissue for at least 10 weeks, as measured by bioluminescence imaging of luciferase-expressing cardiomyocytes in vivo.
Usage Notes
Researchers studying the single-cell RNA-seq data reported herein should note that inferences made from global comparisons (e.g., PCA or clustering) may be limited by experimental design, as each individual cell-type was processed on a separate Fluidigm C1 chip. Hence when comparing single-cell RNA-seq data from different cell-types it is difficult to account for batch effects arising from different chips. Our analysis, including comparisons of key lineage marker genes known to vary between distinct cell lineages, shows that the data are still valid. However, care should be taken in global comparisons that involve aggregating large numbers of genes, as the noise from batch effects could be substantial in that context; the bulk-population RNA-seq data could be used to verify results from such comparisons.
In our related publication8, we applied principal component analysis to the single-cell RNA-seq data to reconstruct the differentiation trajectory of paraxial mesoderm, somitomeres, and early somites in ‘pseudotime’, a concept first introduced in the context of single-cell RNA-seq by other groups (ref. 10 and ref. 33). Interested readers might want to apply these, and other more sophisticated trajectory reconstruction methods, to our single-cell data.
The variance in data quality across the ATAC-seq experiments, due to technical reasons (e.g., different numbers of starting reads or varying cell lysis) and biological reasons (e.g., distinct cell types may have different amounts of open chromatin), mean that care must also be taken when conducting global comparisons of ATAC-seq data. We found that rank-normalization (or, at one extreme, binarization) makes it easier to compare ATAC-seq data across cell-types, as opposed to using P-values, local IDR values, or measures of signal intensity to score each peak. Sub-sampling reads before peak-calling, as we did in our analysis, should only be done for global comparisons; researchers who are doing an in-depth study of one cell type should use all available reads that pass the filtering criteria for maximal information.
We are currently using this dataset to study the temporal changes in alternative splicing and long non-coding RNA expression as differentiation progresses. In addition, we are actively exploring the expression of repeat elements, including dormant retrotransposons, interspersed nuclear elements, Alu elements, and human endogenous retrovirus elements that may have a role in early human embryonic development. Readers who are interested in similar questions are welcome to contact us to discuss methods and collaborations.
Additional Information
How to cite this article: Koh, P. W. et al. An atlas of transcriptional, chromatin accessibility, and surface marker changes in human mesoderm development. Sci. Data 3:160109 doi: 10.1038/sdata.2016.109 (2016).
Publisher’s note: Springer Nature remains neutral with regard to jurisdictional claims in published maps and institutional affiliations.
Supplementary Material
Acknowledgments
We thank Jin-Wook Lee, Nathan Boley, and Daniel Kim for assistance with ATAC-seq analyses, Norma Neff and Olive Curreri for assistance with single-cell RNA-seq, Cole Trapnell and Dana Pe'er for advice on the computational pipeline for single-cell RNA-seq, and the Stanford Functional Genomics and Stem Cell Genomics Core Facilities for infrastructure support. K.M.L. was supported as a Siebel Investigator of the Siebel Stem Cell Institute with additional support from the Fannie and John Hertz Foundation, the U.S. National Science Foundation, and the Davidson Institute for Talent Development. A.K. was supported by the Sloan Foundation Research Fellowship. This study was also supported by the California Institute for Regenerative Medicine (RT2-02060, RT3-07683, TB1-01195 and a GC1R-06673-A Collaborative Research Program) and the U.S. National Institutes of Health (T32GM007365).
Footnotes
The authors declare no competing financial interests.
Data Citations
- 2016. NCBI Sequence Read Archive. SRP073808
- 2016. Gene Expression Omnibus. GSE85066
- Koh P. W. 2016. Figshare. https://dx.doi.org/10.6084/m9.figshare.3842835
- Loh K. 2016. Figshare. https://dx.doi.org/10.6084/m9.figshare.3505817.v3
- Koh P. W. 2016. Figshare. https://dx.doi.org/10.6084/m9.figshare.3507167.v2
References
- Lawson K. A., Meneses J. J. & Pedersen R. A. Clonal analysis of epiblast fate during germ layer formation in the mouse embryo. Development 113, 891–911 (1991). [DOI] [PubMed] [Google Scholar]
- Rosenquist G. C. Location and movements of cardiogenic cells in the chick embryo: the heart-forming portion of the primitive streak. Developmental Biology 22, 461–475 (1970). [DOI] [PubMed] [Google Scholar]
- Tam P. P. & Beddington R. S. The formation of mesodermal tissues in the mouse embryo during gastrulation and early organogenesis. Development 99, 109–126 (1987). [DOI] [PubMed] [Google Scholar]
- Pourquié O. Vertebrate segmentation: from cyclic gene networks to scoliosis. Cell 145, 650–663 (2011). [DOI] [PMC free article] [PubMed] [Google Scholar]
- Christ B. & Scaal M. Formation and differentiation of avian somite derivatives, vol. 638 of Adv Exp Med Biol 1–41 (Landes Bioscience, 2008). [DOI] [PubMed] [Google Scholar]
- Tanaka M. Molecular and evolutionary basis of limb field specification and limb initiation. Dev. Growth Differ 55, 149–163 (2013). [DOI] [PubMed] [Google Scholar]
- Später D., Hansson E. M., Zangi L. & Chien K. R. How to make a cardiomyocyte. Development 141, 4418–4431 (2014). [DOI] [PubMed] [Google Scholar]
- Loh K. M. et al. Mapping the pairwise choices leading from pluripotency to human bone, heart, and other mesoderm cell types. Cell 166, 451–467 (2016). [DOI] [PMC free article] [PubMed] [Google Scholar]
- Buenrostro J. D., Giresi P. G., Zaba L. C., Chang H. Y. & Greenleaf W. J. Transposition of native chromatin for fast and sensitive epigenomic profiling of open chromatin, dna-binding proteins and nucleosome position. Nature Methods 10, 1213–1218 (2013). [DOI] [PMC free article] [PubMed] [Google Scholar]
- Trapnell C. et al. The dynamics and regulators of cell fate decisions are revealed by pseudotemporal ordering of single cells. Nat. Biotech. 32, 381–386 (2014). [DOI] [PMC free article] [PubMed] [Google Scholar]
- Trapnell C. Defining cell types and states with single-cell genomics. Genome Res. 25, 1491–1498 (2015). [DOI] [PMC free article] [PubMed] [Google Scholar]
- Jiang H., Lei R., Ding S.-W. & Zhu S. Skewer: a fast and accurate adapter trimmer for next-generation sequencing paired-end reads. BMC Bioinformatics 15, 1–12 (2014). [DOI] [PMC free article] [PubMed] [Google Scholar]
- ENCODE Consortium. An integrated encyclopedia of DNA elements in the human genome. Nature 488, 57–74 (2012). [DOI] [PMC free article] [PubMed] [Google Scholar]
- Dobin A. et al. Star: ultrafast universal rna-seq aligner. Bioinformatics 29, 15–21 (2013). [DOI] [PMC free article] [PubMed] [Google Scholar]
- Li B. & Dewey C. N. Rsem: accurate transcript quantification from rna-seq data with or without a reference genome. BMC Bioinformatics 12, 323 (2011). [DOI] [PMC free article] [PubMed] [Google Scholar]
- Johnson W. E., Li C. & Rabinovic A. Adjusting batch effects in microarray expression data using empirical bayes methods. Biostatistics (Oxford, England) 8, 118–127 (2007). [DOI] [PubMed] [Google Scholar]
- Leek J. et al. sva: Surrogate variable analysis. r package version 3.18.0 (2015).
- Love M. I., Huber W. & Anders S. Moderated estimation of fold change and dispersion for RNA-seq data with DESeq2. Genome Biol. 15, 1–21 (2014). [DOI] [PMC free article] [PubMed] [Google Scholar]
- Tzur A., Moore J. K., Jorgensen P., Shapiro H. M. & Kirschner M. W. Optimizing optical flow cytometry for cell volume-based sorting and analysis. PLoS ONE 6, e16053 (2011). [DOI] [PMC free article] [PubMed] [Google Scholar]
- Kundaje Lab. Ataqc: Atac-seq processing pipeline. https://github.com/kundajelab/atac_dnase_pipelines (2016).
- Langmead B. & Salzberg S. L. Fast gapped-read alignment with bowtie 2. Nature Methods 9, 357–359 (2012). [DOI] [PMC free article] [PubMed] [Google Scholar]
- Broad Institute. Picard Tools. https://broadinstitute.github.io/picard/ (2016).
- Zhang Y. et al. Model-based analysis of chip-seq (macs). Genome Biol. 9, R137 (2008). [DOI] [PMC free article] [PubMed] [Google Scholar]
- Li Q., Brown J. B., Huang H. & Bickel P. J. Measuring reproducibility of high-throughput experiments. The Annals of Applied Statistics 5, 1752–1779 (2011). [Google Scholar]
- Gerstein M. B. et al. Architecture of the human regulatory network derived from encode data. Nature 488, 91–100 (2012). [DOI] [PMC free article] [PubMed] [Google Scholar]
- Quinlan A. R. & Hall I. M. Bedtools: a flexible suite of utilities for comparing genomic features. Bioinformatics 26, 841–842 (2010). [DOI] [PMC free article] [PubMed] [Google Scholar]
- Panchision D. M. et al. Optimized flow cytometric analysis of central nervous system tissue reveals novel functional relationships among cells expressing cd133, cd15, and cd24. Stem Cells 25, 1560–1570 (2007). [DOI] [PubMed] [Google Scholar]
- Loh K. M. et al. Efficient endoderm induction from human pluripotent stem cells by logically directing signals controlling lineage bifurcations. Cell Stem Cell 14, 237–252 (2014). [DOI] [PMC free article] [PubMed] [Google Scholar]
- Brunton S. A. et al. Potent agonists of the hedgehog signaling pathway. Bioorganic & Medicinal Chemistry Letters 19, 4308–4311 (2009). [DOI] [PubMed] [Google Scholar]
- Andrews S. FastQC: a quality control tool for high throughput sequence data. http://www.bioinformatics.babraham.ac.uk/projects/fastqc (2010).
- Roadmap Consortium et al. Integrative analysis of 111 reference human epigenomes. Nature 518, 317–330 (2015). [DOI] [PMC free article] [PubMed] [Google Scholar]
- Ardehali R. et al. Prospective isolation of human embryonic stem cell-derived cardiovascular progenitors that integrate into human fetal heart tissue. Proc Natl Acad Sci USA 110, 3405–3410 (2013). [DOI] [PMC free article] [PubMed] [Google Scholar]
- Bendall S. C. et al. Single-cell trajectory detection uncovers progression and regulatory coordination in human B cell development. Cell 157, 714–725 (2014). [DOI] [PMC free article] [PubMed] [Google Scholar]
Associated Data
This section collects any data citations, data availability statements, or supplementary materials included in this article.
Data Citations
- 2016. NCBI Sequence Read Archive. SRP073808
- 2016. Gene Expression Omnibus. GSE85066
- Koh P. W. 2016. Figshare. https://dx.doi.org/10.6084/m9.figshare.3842835
- Loh K. 2016. Figshare. https://dx.doi.org/10.6084/m9.figshare.3505817.v3
- Koh P. W. 2016. Figshare. https://dx.doi.org/10.6084/m9.figshare.3507167.v2