

Multiphoton autofluorescence shows that NAD(P)H is elevated in dopamine neurons. Much of the NAD(P)H is localized to the ER, and perturbing mitochondrial function alters ER NAD(P)H. The NAD(P)H coupling between neuronal ER and mitochondria provides a means for the two organelles to coordinate their redox stress responses.
Abstract
Pyridine nucleotides are redox coenzymes that are critical in bioenergetics, metabolism, and neurodegeneration. Here we use brain slice multiphoton microscopy to show that substantia nigra dopamine neurons, which are sensitive to stress in mitochondria and the endoplasmic reticulum (ER), display elevated combined NADH and NADPH (i.e., NAD(P)H) autofluorescence. Despite limited mitochondrial mass, organellar NAD(P)H is extensive because much of the signal is derived from the ER. Remarkably, even though pyridine nucleotides cannot cross mitochondrial and ER membranes, inhibiting mitochondrial function with an uncoupler or interrupting the electron transport chain with cyanide (CN−) alters ER NAD(P)H. The ER CN− response can occur without a change in nuclear NAD(P)H, raising the possibility of redox shuttling via the cytoplasm locally between neuronal mitochondria and the ER. We propose that coregulation of NAD(P)H in dopamine neuron mitochondria and ER coordinates cell redox stress signaling by the two organelles.
INTRODUCTION
The pyridine nucleotides NADH and NADPH are redox coenzymes that are essential for the function of mitochondria and endoplasmic reticulum (ER), metabolism, and the responses of neurons to axonal injury (Ying, 2007; Wang and He, 2009). For example, pyridine nucleotides are required for bioenergetics (i.e., glycolysis in the cytoplasm and oxidative phosphorylation in mitochondria), polyADP ribosylation (which is implicated in DNA damage in the nucleus and cell death), cholesterol synthesis in the ER, axonal responses to injury (Ying, 2007), and a wide variety of enzymatic reactions that affect neuronal function (e.g., by affecting the synthesis of monoamine transmitters). Reduced pyridine nucleotides produce spectrally identical autofluorescence, the NAD(P)H signal, which can be imaged in living tissue with two-photon microscopy (Huang et al., 2002). Such studies have demonstrated NAD(P)H responses in neurons and glia (Kasischke et al., 2004), but NAD(P)H has not been monitored in the living brain slice in dopamine (DA) neurons.
Substantia nigra (SN) DA neuron redox status is important because these neurons are subject to ongoing elevated redox stress, which, along with mitochondrial dysfunction and ER stress, may contribute to their death and Parkinson’s disease (PD; Mercado et al., 2013; Beilina and Cookson, 2015; De Rosa et al., 2015). In this light, interaction between the ER and mitochondria is of interest. Mitochondrial function and fission are controlled by the ER (Friedman et al., 2011; Richter et al., 2015). Similarly, ER–mitochondrial interaction may be important for the Pink1-Parkin pathway, which is implicated in PD (Erpapazoglou and Corti, 2015), and Ca2+ homeostasis (Bononi et al., 2012). In the latter case, Ca2+ released from ER via IP3 receptors into the cytoplasm is efficiently taken up by mitochondria. However, the hypothesis that there are redox interactions between ER and mitochondria has not been tested, although such coupling could be important for stress responses in DA neurons.
Here we use multiphoton microscopy in the brain slice to demonstrate marked NAD(P)H autofluorescence in SN DA neurons. We study this signal to discern its dependence on mitochondria. Surprisingly, a mitochondrial uncoupler and cyanide (CN−), which interrupts the electron transfer chain, alter NAD(P)H in both mitochondria and ER. Thus pyridine nucleotide redox is coordinated in different organelles implicated in cell stress and death.
RESULTS AND DISCUSSION
While conducting two-photon microscopy studies of an antipsychotic drug in SN-containing brain slices (Tucker et al., 2015), we noticed that large neuronal somas displayed marked autofluorescence. Quantification in slices made from different brain regions established that this neuronal signal was stronger in the SN pars compacta (SNc; 1.0 ± 0.04, n = 48) than in the SN pars reticulata (SNr; 0.60 ± 0.06, n = 28), the cortex (0.66 ± 0.06, n = 12), and the hippocampus (0.68 ± 0.05, n = 48; p < 0.01; Figure 1A). Filling single autofluorescent SN neurons with sulforhodamine B revealed that autofluorescence was punctate and distributed throughout ovoid neurons with multiple dendrites (Figure 1B). Because this slice localization and morphology are consistent with DA neurons, we investigated the hypothesis that SN DA neurons have high autofluorescence. First, autofluorescent cell bodies were patch clamped to assess their electrophysiological characteristics. As would be expected for SN DA neurons, these cells produced slow pacemaker activity with broad action potentials and, upon hyperpolarization by current injection, displayed a voltage sag indicative of Ih current (Figure 1C). Thus their electrophysiology is characteristic of SN DA neurons. Second, after imaging of autofluorescence, slices were treated with the fluorescent DA transporter (DAT) substrate IDT307, which is taken up by DA neurons and becomes fluorescent upon binding to intracellular membranes (Chang et al., 2012; Karpowicz et al., 2013). After removal of extracellular IDT307, SN neurons displaying autofluorescence were preferentially labeled by IDT307 (Figure 1D). Because the only neuronal cell bodies capable of taking up IDT307 in the SN are DA neurons, this dual labeling verifies that SN DA neuron cell bodies are autofluorescent. Furthermore, 75% of extrasomatic autofluorescent puncta in the SN (Figure 1B) were also IDT307 positive (Figure 1D), likely arising from puncta in the DA neuron dendrites that might include sites of vesicular DA release. Together, optical and electrophysiological experiments demonstrate that SN DA neurons display elevated autofluorescence.
FIGURE 1:

SN dopamine neurons display high autofluorescence. (A) Representative single-plane multiphoton images of SN pars compacta (SNc), substantia nigra pars reticulata (SNr), hippocampus (Hipp), and cortex (Cort) at matched depth and laser power. (B) Pseudocolored summed z-projection of a sulforhodamine B (magenta)–filled SN neuron. The insets are single-plane pseudocolored magnifications of autofluorescence (yellow; left) and sulforhodamine B/autofluorescence overlay (magenta/yellow; overlap indicated by white) in individual dendrites and the soma. (C) Somas of the SN with high autofluorescence exhibit electrophysiological characteristics of DA neurons. Representative single-plane image (C1) and current-clamp voltage traces of slow pacemaker activity (C2), broad action potentials (C3), and Ih voltage sag (held at −60 mV, followed by a 2-s, −250 pA current injection; C4) characteristic of DA neurons. (D) Representative single-plane pseudocolored images of autofluorescence (yellow) colocalization with monoamine neurons identified with IDT307 (fluorescent monoamine transporter substrate; magenta) in the SN. Scale bars, 10 μm (A–D), 5 μm (insets).
Autofluorescence optical properties suggest that it is derived from the reduced pyridine nucleotides NADH and NADPH. First, two-photon excitation spectra from SN neurons in slices and NADH in solution are similar (Figure 2A). Second, the empirical emission spectrum for DA neurons in SN slices estimated with short-pass filters and dichroic mirrors displayed fluorescence in the blue range (Figure 2B), consistent with NAD(P)H (Huang et al., 2002). Of note, these data are not compatible with a major contribution from flavin nucleotides, which have significant excitation at 800 nm and a peak emission at >525 nm (i.e., toward the right side of Figure 2B). Third, the slopes from log power versus log fluorescence plots are indistinguishable for NADH and SN DA neuron autofluorescence; both are subject to two-photon excitation (Figure 2C). Thus excitation and emission properties are consistent with autofluorescence in SN DA neurons being derived from NAD(P)H.
FIGURE 2:

Comparison of autofluorescence from DA neurons and NADH. (A) Multiphoton excitation spectra of SN soma autofluorescence (▪; N = 2) and 2.5 mM NADH (▫). (B) Autofluorescence emission spectrum of SN somas (N = 3). (C) Two-photon excitation of the autofluorescence and NADH. SN soma and 2.5 mM NADH were stimulated with increasing levels of power at 740 nm. The log of somatic F (▪; mean ± SEM for 12 cells) and of NADH F (▫; individual data points) is plotted against the log of laser power. The solid and dashed lines represent linear regression for autofluorescence (slope 2.09 ± 0.16) and NADH (slope 2.02 ± 0.17), respectively. (D) Representative two-photon single-plane images before (Pre) and after (Post) a 5-min treatment with vehicle (Cont), 1 μM FCCP, or 1 mM CN−. (E) Profile plots of NAD(P)H fluorescence of ROIs indicated by dashed lines in D (black, Pre; red, Post). (F) Quantification of percentage fluorescence change (ΔF) of soma autofluorescence in SN slices before (Pre) and after (Post) a 5-min treatment with vehicle (Cont), 1 μM FCCP, or 1 mM CN− (5–14 cells). *p < 0.05, **p < 0.01, ***p < 0.001. Scale bar, 10 μm.
Much of the NAD(P)H signal in living cells is derived from mitochondrial NADH, which is increased by interrupting the electron transport chain with CN− and decreased by uncoupling mitochondria with carbonyl cyanide 4-(trifluoromethoxy) phenylhydrazone (FCCP). Acute treatment of slices for 5 min showed that autofluorescence in SN DA neuron cell bodies was increased by CN− and decreased by FCCP (Figure 2, D–F). Although CN− could affect heme proteins outside of mitochondria, the decrease in two-photon autofluorescence induced by the uncoupler in concert with the CN−-induced increase are characteristic of mitochondrial pyridine nucleotides (Huang et al., 2002). Line intensity profiles (Figure 2, D and E) are consistent with an organellar contribution because changes induced by FCCP and CN− were not evenly distributed (as would be expected for a cytoplasmic increase superimposed on a heterogeneous background) but instead preferentially affected brighter structures. This trend is also evident in the optical sections (Figure 2D). Therefore optical properties (Figure 2, A–C) and dependence on mitochondrial function (Figure 2, D– F) together establish that elevated autofluorescence in SN DA neurons is derived from NAD(P)H, particularly from mitochondria.
However, the extensiveness of the organellar NAD(P)H signal was not expected because ultrastructure from brain tissue established that SN DA neurons have low mitochondrial mass (Liang et al., 2007). Therefore experiments were performed to compare localization of autofluorescence and mitochondria labeled with two mechanistically and spectrally distinct MitoTracker dyes—MitoTracker Green FM (Mito(G)) and MitoTracker Red chloromethyl-x-rosamine (Mito(R)). Imaging in living brain slice showed that mitochondria label similarly with either of the MitoTracker dyes and overlap with NAD(P)H in the soma, but the mitochondrial labeling was sparser and more punctate (Figure 3, A, B, E, and F). In fact, in IDT307-positive somas (n = 7), 96 ± 3.6% of the MitoTracker marker overlapped with NAD(P)H signal, but only 56 ± 10% of the NAD(P)H overlapped with the mitochondrial marker. Thus these experiments demonstrate that NAD(P)H must be abundant in an organelle with a distribution that overlaps with, but is more extensive than, mitochondria. Peroxisomes, which contain pyridine nucleotides, are not expected to be so widespread, reticular, and overlapping with mitochondria. Thus these results led us to test the hypothesis that ER contributes to the signal.
FIGURE 3:

Colocalization of NAD(P)H with mitochondria and ER. (A, B) Pseudocolored image of a neuron from SN slice for NAD(P)H (yellow, left). The slice was then treated with 500 nM Mito(G) (magenta; middle) for 30 min and reimaged. Right, NAD(P)H and Mito(G) overlay. (C, D) Pseudocolored image of a neuron from SN slice for NAD(P)H (yellow; left). The slice was then treated with 1 μM ER(BW) (middle; cyan) for 30 min and reimaged. Right, NAD(P)H and ER(BW) overlay. (E, F) Pseudocolored image of a neuron in SN slice treated with 0.5 μM Mito(R) for 30 min (middle, top; magenta) and simultaneously imaged for NAD(P)H (yellow; left, top). The slice was then treated with 1 μM (ER(G) (cyan; right, top) for 30 min and reimaged. B, D, and F are increased magnifications of the areas indicated by the white boxes in A, C, and E, respectively. Color code and labeling of B, D, and F are the same as in A, C, and E. Scale bar, 10 μm (A, C, E), 2.5 μm (B, D, F).
We imaged NAD(P)H autofluorescence in slices containing SN before treatment with ER-Tracker Blue/White DPX (ER(BW); labels lipids; Figure 3, C and D). Colocalization of autofluorescence with ER(BW) was extensive (Figure 3C,D). We then compared NAD(P)H autofluorescence distribution within the same cell to the distribution of Mito(R) and the mechanistically distinct ER-Tracker Green (ER(G); labels a protein). NAD(P)H and Mito(R) were imaged simultaneously, followed by ER(G) treatment and imaging. Mitochondria (Mito) displayed limited, punctate overlap with the ER (Figure 3, E and F). Furthermore, NAD(P)H showed incomplete overlap with Mito(R) and extensive but incomplete colocalization with ER(G) alone. However, overlap by Mito(R) and ER(G) together was almost complete (Figure 3, E and F). Therefore the organellar NAD(P)H pool includes mitochondria but, surprisingly, is dominated by ER.
Pyridine nucleotides do not permeate mitochondrial and ER membranes. Therefore it was expected that CN− and FCCP would alter mitochondrial NAD(P)H selectively (i.e., changes in autofluorescence should be punctate akin to and colocalized with the labeling by MitoTracker dyes; Figure 3, A and B, middle, and E and F, top, middle). However, the CN−-induced NAD(P)H increase in SN DA neurons was not spatially limited to mitochondria (Figure 4A) but also increased in areas colocalized with ER (Figure 4B). Similarly, the FCCP-induced decrease in NAD(P)H was not limited to mitochondria (Figure 4C) but did so in areas localized to the ER as well (Figure 4D). Because these changes cannot be attributed to a global change in cytoplasm (Figure 2F), the organellar responses indicate that the NAD(P)H in ER is coupled to known changes in mitochondria.
FIGURE 4:

Propagation of mitochondrial NAD(P)H changes in DA neurons. Representative before and after images of neurons from SN slices treated for 5 min with (A, B) 1 mM CN− or (C, D) 1 μM FCCP, followed by a 30-min treatment with (A, C) 500 nM Mito(G) (yellow) or (B, D) 1 μM (ER(BW) (yellow) for 30 min. NAD(P)H signal before (Pre) and after treatment is shown in magenta. Right, overlay of the MitoTracker or ER Tracker signal with the NAD(P)H signal after treatment. Scale bar, 10 μm.
Redox equivalents are transferred from the lumen of mitochondria to the cytoplasm by a variety of shuttle mechanisms. Because nuclear pores are always permeable to small molecules, cytoplasmic NAD(P)H changes would be expected to equilibrate in the nucleus. All of the foregoing figures show that NAD(P)H in the nucleus of DA neurons is extremely low, although quantification shows that it is not zero. Of interest, very low nuclear NAD(P)H levels also changed in response to mitochondrial function: in the nucleus, NAD(P)H increased by 44 ± 5.8% (N = 18) in response to CN− and decreased by −10 ± 0.4% (N = 13) in response to FCCP. Therefore there is likely a similar low-concentration pool of NAD(P)H in the cytoplasm of DA neurons that changes because of mitochondrial shuttles.
If a global change in free nucleocytoplasmic NAD(P)H drives the detected responses in ER, then all cells showing the latter effect would be expected to display a nuclear NAD(P)H response to CN−. To explore this prediction, we loaded PC12 neuroendocrine cells with Mito(R), imaged NAD(P)H and Mito(R) simultaneously before and after CN− treatment, and finally stained the cells with ER(G). Consistent with DA neurons in the slice, mitochondria were punctate and limited compared with ER (Figure 5, A and B; Mito(R) in magenta; ER(G) in cyan) and CN− increased NAD(P)H (Figure 5, A–C; NAD(P)H in yellow). Also consistent with the ER response in the slice, the latter effect was far more extensive than for mitochondria (Figure 5, A and B). However, the increases in autofluorescence produced in Mito and ER occurred without a detectable change in the nucleus (Figure 5C, Nuc). Therefore regulation of NAD(P)H in ER and Mito does not have to be accompanied by a change in the nucleus. This conclusion is further supported by experiments with ventral tegmental area DA neurons (K.R.T. and E.S.L., unpublished data). These experiments therefore suggest that nucleocytoplasmic NAD(P)H changes below the level of detection can drive ER responses to mitochondrial perturbations, or, reminiscent of the preferential passing of Ca2+ from ER to mitochondria through the cytoplasm at contact points, avid redox shuttling between each organelle and the local cytoplasm might be sufficient for coupling pyridine nucleotide redox in two organelles without producing a detectable change in the nucleus. In the future, it will be of interest to explore the contributions of these two possibilities in different cell types by disrupting mitochondrial–ER contacts.
FIGURE 5:
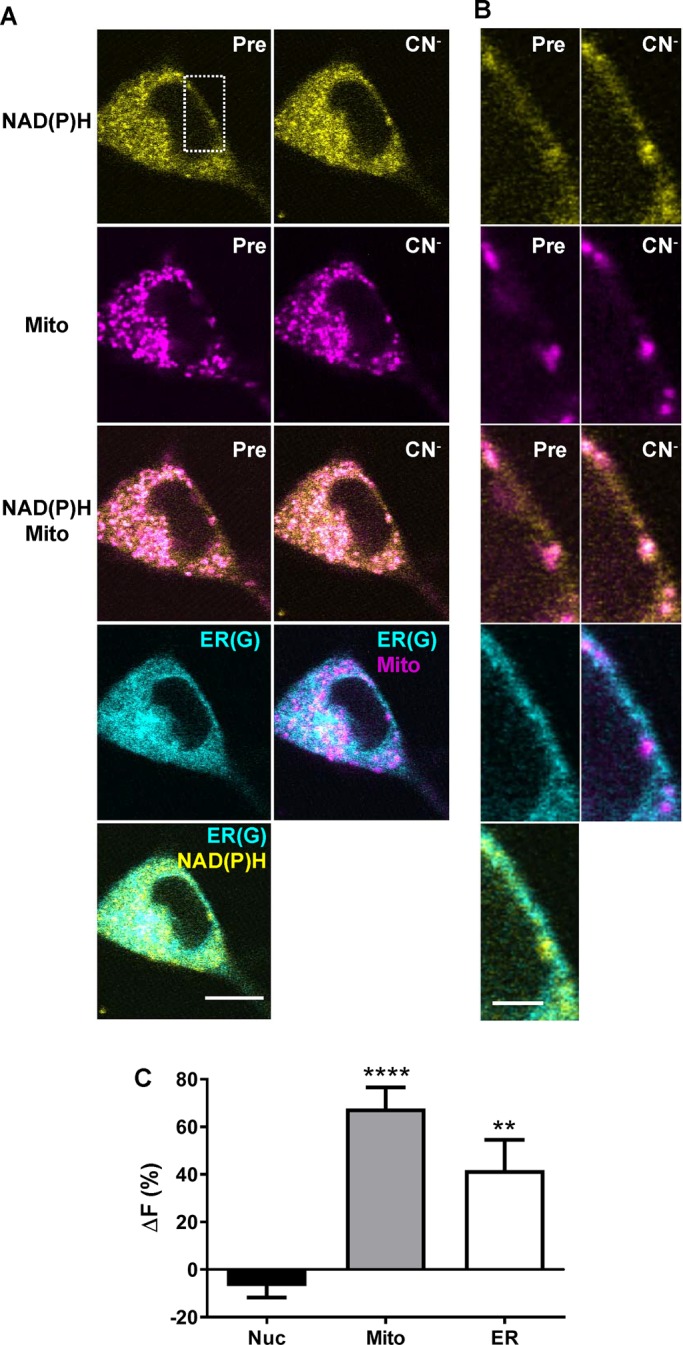
Propagation of mitochondrial NAD(P)H changes in PC12 cells. Representative images of a PC12 cell pretreated with 500 nM MitoTracker Red (Mito) for 30 min before a 1-min 1 mM CN− treatment, followed by incubation with 1 μM (ER(G)). (A, B) Pseudocolored single images of NAD(P)H (top, yellow), Mito (magenta, row 2), and Mito/NAD(P)H overlay (row 3) before and after CN− treatment. ER(G) is pseudocolored in cyan in row 4, left, overlaid with Mito in row 4, right, and NAD(P)H, bottom. Scale bar, 10 μm. (B) Magnifications of the area indicated by the white box in A. Color coding and labels are the same as in A. Scale bar, 2.5 μm. (C) Quantification of the percentage difference in autofluorescence (ΔF) before and after CN− treatment in the nucleus (Nuc), Mito, and ER. Mito ROIs were measured using masks generated from the MitoTracker Red images simultaneously imaged with the autofluorescence. ER ROIs were created by subtracting the MitoTracker Red masks from the mask made from the ER(G) image collected after treatment; 12 cells. ****p < 0.0001 and **p < 0.01 indicate significant difference from 0 determined with a one-sample t test.
The results presented here demonstrate that NAD(P)H is elevated in SN DA neurons. This may reflect a compensatory mechanism to deal with the ongoing redox stress faced by these neurons because DA is reactive and their Ca2+ dynamics affects mitochondria (Chinta and Andersen, 2008). The low mitochondrial mass in SN DA neurons (Liang et al., 2007) further allowed us to discover that much of the somatic NAD(P)H signal is, surprisingly, derived from ER. Finally and most unexpected, we found coupling of ER and mitochondrial NAD(P)H. Regardless of the specific mechanism (see earlier discussion), coregulation of ER and mitochondrial NAD(P)H may serve two purposes. First, spatially separated mitochondria with different energy demands and microenvironments could share redox equivalents by having the ER act as a pyridine nucleotide redox wire between mitochondria. This mechanism would be advantageous, given the redox load and limited mitochondrial mass found in SN DA neurons (Liang et al., 2007; Chinta and Andersen, 2008). Second, the redox state of the ER, which affects cholesterol synthesis and the unfolded protein response, is influenced by mitochondria. Therefore NAD(P)H coupling would provide a mechanism for coordinating redox in two stress-associated organelles. The present results therefore open up new avenues of study on pyridine nucleotide redox regulation and shuttles in ER and mitochondria.
MATERIALS AND METHODS
Slice preparation
All experiments were conducted according to University of Pittsburgh Institutional Animal Care and Use Committee–approved protocols and National Institutes of Health guidelines. Postnatal day 13 male Sprague Dawley rat pups and mother were received from Harlan Laboratories (Frederick, MD). Rats were housed in the University of Pittsburgh vivarium, maintained on a 12:12 h light cycle, and had ad libitum access to food and water.
Brain slice preparations were performed as previously described (Tucker et al., 2012, 2015) with the addition of sectioning the striatum, hippocampus, and cortex. In brief, postnatal day 14–28 male Sprague Dawley rats were anesthetized with isoflurane and decapitated. The brain was then quickly removed and placed in ice-cold, 95% O2 and 5% CO2-saturated, sucrose-modified artificial cerebral spinal fluid (s-aCSF) containing the following (in mM): 87 NaCl, 75 sucrose, 2.5 KCl, 25 NaHCO3, 1.25 NaH2PO4, 0.5 CaCl2, 7 MgSO4, 25 glucose, 0.15 ascorbic acid, and 1 kynurenic acid, pH 7.4. Coronal slices (250 μm) containing the SN, hippocampus, and cortex were cut using a Vibratome 3000 (Vibratome Company, St. Louis, MO) in ice-cold s-aCSF and then held in room temperature s-aCSF for 30 min. The slices were then held in 95% O2 and 5% CO2-saturated aCSF containing the following (in mM): 124 NaCl, 4 KCl, 25.7 NaHCO3, 1.25 NaH2PO4, 2.45 CaCl2, 1.2 MgSO4, 11 glucose, and 0.15 ascorbic acid, pH 7.4.
Imaging
Multiphoton imaging experiments were conducted on an Olympus (Tokyo, Japan) FluoView FV1000 upright confocal scanning microscope equipped with a Coherent (Santa Clara, CA) Chameleon Ultra titanium:sapphire laser that was previously described in detail (Tucker et al., 2015). Data were acquired with an Olympus LUMPlanFLN 60×, 1.0W water immersion objective at 10 μs/pixel with an axial spacing of 1.5 μm in slices and 1 μm in PC12 cell cultures at room temperature.
To compare the multiphoton excitation spectrum of the autofluorescence to NADH, SN somas and 2.5 mM NADH (Sigma-Aldrich, St. Louis, MO) were imaged with increasing excitation wavelengths from 710 to 900 nm (T525LPXR dichroic; OD4-525SP emission filter). The data were background subtracted and normalized to the peak fluorescence at 720 nm but not corrected for changes in laser output with wavelength. Although peak fluorescence was found to be 720 nm for the autofluorescence, slices were imaged with an excitation wavelength of 740 nm.
The empirical emission spectrum of the SN soma autofluorescence was determined using an excitation wavelength of 740 nm and comparing the autofluorescence collected with the following dichroic mirrors and emission filters: T470LPXR, T525LPXR, T635LPXR, OD4-450SP, and OD4-425SP. The percentage of the total signal with each optic was determined without correcting for the spectral response of the detector.
To compare the number of photons required to excite the autofluorescence and NADH, SN somas and 2.5 mM NADH in solution were stimulated with increasing levels of laser power at 740 nm. The log of somatic autofluorescence and NADH fluorescence was plotted against the laser power log, and the slope was calculated by linear regression.
Colocalization experiments
To determine the identity of the cells containing the autofluorescence puncta, the fluorescent monoamine transporter substrate IDT307 (also known as APP+) was used (Karpowicz et al., 2013). Colocalization with IDT307 in the SN would indicate the cells were DA neurons. Because the emission spectrum of IDT307 overlaps with the autofluorescence signal, two-photon images of the autofluorescence were taken before a 10-min bath application of 0.5–1 μM IDT307 (a generous gift from Randy Blakely, Vanderbilt University, Nashville, TN). Two-photon images of IDT307 were then taken with an excitation wavelength of 850 nm and an FF01-535/150 band-pass emission filter.
Mitochondrial autofluorescence was evaluated using two distinct MitoTracker dyes from ThermoFisher Scientific (Pittsburgh, PA). Mito(R) labels active mitochondria in a mitochondria membrane–potential dependent manner. Live brain slices were incubated for 30 min with 500 nM Mito(R) and rinsed for 5 min before simultaneous imaging of autofluorescence by using 740-nm excitation with a T525LPXR mirror to separate the autofluorescence from the Mito(R) signals. Mito(G) labels all mitochondria, independent of membrane potential (Pendergrass et al., 2004). Autofluorescence was imaged before a 30-min incubation with 500 nM Mito(G) at room temperature. Mito(G) was then imaged with an excitation of 850 nm and the signal collected with an FF01-535/150 band-pass emission filter.
The ER autofluorescence was evaluated using two distinct ER-Tracker dyes from ThermoFisher Scientific. ER(BW) has a two-photon excitation peak at 728 nm and a secondary peak at 800 nm with a broad emission spectrum (400–700 nm) that overlaps that of the autofluorescence (Bestvater et al., 2002). Autofluorescence was imaged before a 30-min treatment with 0.5–1 μM ER(BW) and a 5-min wash. ER(BW) was then excited with 800 nm and the signal collected with an FF01-535/150 band-pass emission filter. ER(G) was used to confirm the staining of ER(BW). ER(G) and autofluorescence or Mito(R) colocalization was performed by first imaging autofluorescence and Mito(R) in SN sections incubated for 30 min with 500 nM Mito(R) and rinsed for 5 min before a 30-min treatment with 0.5–1 μM ER(G) and a 5-min wash. ER(G) was then imaged with 930-nm excitation and an FF01-535/150 band-pass emission filter.
Electrophysiology
Whole-cell current-clamp recordings were performed as previously described (Tucker et al., 2015). The pipette solution contained the following (in mM): 120 potassium gluconate, 20 KCl, 10 4-(2-hydroxyethyl)-1-piperazineethanesulfonic acid, 2 MgCl2, 0.1 ethylene glycol tetraacetic acid, and 1.2 ATP disodium salt, pH 7.3. Room temperature oxygenated aCSF was used for bath superfusion of midbrain slices at a rate of 2 ml/min. Somas were chosen for patching based on location in the SN (lateral to the medial lemniscus or at the SN/SNr boarder for clarity of individual cells) and prominent autofluorescence. Individual neurons were filled via the whole-cell recording configuration through the patch pipette with 15 μM sulforhodamine B (sRh; Sigma) in pipette solution. DA neurons were identified by well-defined electrophysiological characteristics (Grace and Bunney, 1983; Lacey et al., 1989; Richards et al., 1997), that is, the presence of an Ih-dependent sag in membrane potential upon hyperpolarization, spontaneous pacemaker-like activity of 1–10 Hz, and broad (2–3 ms) action potentials, as previously described (Tucker et al., 2012, 2015). Autofluorescence and sRh were simultaneously imaged at 740 nm. The signals were separated with a T525LPXR dichroic. The autofluorescence signal was collected with an OD4 525SP filter and the sRh with an hq615/75m band-pass filter. Images of autofluorescence and sRh fluorescence were taken in stacks of ten to fourteen 1.5-μm z-plane sections after 5–10 min of sRh dialysis.
Drug treatments
NAD(P)H levels in midbrain slices were manipulated by blocking Complex IV of the electron transport chain with CN− and uncoupling the proton-motive force of oxidative phosphorylation with FCCP. SN-containing midbrain slices were imaged for autofluorescence before and after a 5-min incubation at room temperature with 1 μM FCCP, 1 mM sodium cyanide, or potassium cyanide (no significant difference; data were pooled) or vehicle control. Exposures were reduced to 1 min for PC12 cells, which were cultured in FluoroBright DMEM (ThermoFisher Scientific) with 10% fetal bovine serum.
Analysis
Image analysis was performed with the MacBiophotonics suite of plug-ins for ImageJ. The stacks from before (Pre) and after (Post) treatment were compared by visual inspection, relying on anatomical landmarks (cell bodies, nuclei, and vessels) to choose single optical sections from each stack that represent the same focal plane before and after treatment. In areas where somas were analyzed, a single equatorial optical section of the soma and nucleus were selected. Pre and Post stimulation images were then aligned with the “align slices in stack” plug-in from the MacBiophotonics suite of plug-ins for ImageJ.
Line profile analysis of the CN− and FCCP experiments was performed using the Plot Profile function of ImageJ. For organellar structures of SNc cell bodies (single optical plane, not summed), the line tool was used to select the region through which to measure the fluorescence intensity profile. Those intensities were then plotted as a function of position before and after treatment.
PC12 somatic autofluorescence was subdivided into three compartments: the dark ovoid nucleus, mitochondria, and ER. The region of interest (ROI) for the soma and nucleus were selected and circumscribed manually in both slices and PC12 cultures. The mitochondrial ROIs were selected by creating a mask of Pre and Post mitochondrial images. Because the ER Tracker staining is extensive and overlaps with the MitoTracker staining, the Pre and Post mitochondrial masks were subtracted individually from the ER Tracker mask to produce mitochondria-free Pre and Post masks of the ER. Both Pre and Post values were background subtracted. The background fluorescence was measured in empty cells. Background was always lower than the nuclear pool.
Percentage fluorescence change was calculated from the equation
A positive fluorescence change indicates an increase in fluorescence. All values reported throughout this article are mean ± SEM, and N represents the number of somas measured per treatment. Statistical significance was determined in GraphPad Prism (v5.04) with a two-tailed Student’s t test or one sample t test when determining whether a percentage difference value is significantly different from 0, where 0 indicates no change. Significance was set at p < 0.05 and is indicated by an asterisk (**p < 0.01, ***p < 0.001, ****p < 0.0001).
Acknowledgments
We thank Randy Blakely (Florida Atlantic University, Jupiter, FL) for providing IDT307. This research was supported by National Institutes of Health Grant R21DA038384 to E.S.L.
Abbreviations used:
- CN−
cyanide
- DA
dopamine
- ER
endoplasmic reticulum
- ER(BW)
ER-Tracker Blue/White DPX
- ER(G)
ER-Tracker Green
- FCCP
carbonyl cyanide 4-(trifluoromethoxy) phenylhydrazone
- Mito
mitochondria
- Mito(G)
MitoTracker Green FM
- Mito(R)
MitoTracker Red chloromethyl-x-rosamine
- NAD(P)H
reduced pyridine nucleotides
- SN
substantia nigra.
Footnotes
This article was published online ahead of print in MBoC in Press (http://www.molbiolcell.org/cgi/doi/10.1091/mbc.E16-07-0479) on August 31, 2016.
REFERENCES
- Beilina A, Cookson MR. Genes associated with Parkinson’s disease: regulation of autophagy and beyond. J Neurochem. 2015 doi: 10.1111/jnc.13266. doi: 10.1111/jnc.13266. [DOI] [PMC free article] [PubMed] [Google Scholar]
- Bestvater F, Spiess E, Stobrawa G, Hacker M, Feurer T, Porwol T, Berchner-Pfannschmidt U, Wotzlaw C, Acker H. Two-photon fluorescence absorption and emission spectra of dyes relevant for cell imaging. J Microscopy. 2002;208:108–115. doi: 10.1046/j.1365-2818.2002.01074.x. [DOI] [PubMed] [Google Scholar]
- Bononi A, Missiroli S, Poletti F, Suski JM, Agnoletto C, Bonora M, De Marchi E, Giorgi C, Marchi S, Patergnani S. Mitochondria-associated membranes (MAMs) as hotspot Ca2+ signaling units. Adv Exp Med Biol. 2012;740:411–437. doi: 10.1007/978-94-007-2888-2_17. [DOI] [PubMed] [Google Scholar]
- Chang JC, Tomlinson ID, Warnement MR, Ustione A, Carneiro AMD, Piston DW, Blakely RD, Rosenthal SJ. Single molecule analysis of serotonin transporter regulation using antagonist-conjugated quantum dots reveals restricted, p38 MAPK-dependent mobilization underlying uptake activation. J Neurosci. 2012;32:8919–8929. doi: 10.1523/JNEUROSCI.0048-12.2012. [DOI] [PMC free article] [PubMed] [Google Scholar]
- Chinta SJ, Andersen JK. Redox imbalance in Parkinson’s disease. Biochim Biophys Acta. 2008;1780:1362–1367. doi: 10.1016/j.bbagen.2008.02.005. [DOI] [PMC free article] [PubMed] [Google Scholar]
- De Rosa P, Marini ES, Gelmetti V, Valente EM. Candidate genes for Parkinson disease: lessons from pathogenesis. Clin Chim Acta. 2015;449:68–76. doi: 10.1016/j.cca.2015.04.042. [DOI] [PubMed] [Google Scholar]
- Erpapazoglou Z, Corti O. The endoplasmic reticulum/mitochondria interface: a subcellular platform for the orchestration of the functions of the PINK1–Parkin pathway. Biochem Soc Trans. 2015;43:297–301. doi: 10.1042/BST20150008. [DOI] [PubMed] [Google Scholar]
- Friedman JR, Lackner LL, West M, DiBenedetto JR, Nunnari J, Voeltz GK. ER tubules mark sites of mitochondrial division. Science. 2011;334:358–362. doi: 10.1126/science.1207385. [DOI] [PMC free article] [PubMed] [Google Scholar]
- Grace A, Bunney B. Intracellular and extracellular electrophysiology of nigral dopaminergic neurons–1. Identification and characterization. Neuroscience. 1983;10:301–315. doi: 10.1016/0306-4522(83)90135-5. [DOI] [PubMed] [Google Scholar]
- Huang S, Heikal AA, Webb WW. Two-photon fluorescence spectroscopy and microscopy of NAD(P)H and flavoprotein. Biophys J. 2002;82:2811–2825. doi: 10.1016/S0006-3495(02)75621-X. [DOI] [PMC free article] [PubMed] [Google Scholar]
- Karpowicz RJ, Dunn M, Sulzer D, Sames D. APP+, a fluorescent analogue of the neurotoxin MPP+, is a marker of catecholamine neurons in brain tissue, but not a fluorescent false neurotransmitter. ACS Chem Neurosci. 2013;4:858–869. doi: 10.1021/cn400038u. [DOI] [PMC free article] [PubMed] [Google Scholar]
- Kasischke KA, Vishwasrao HD, Fisher PJ, Zipfel WR, Webb WW. Neural activity triggers neuronal oxidative metabolism followed by astrocytic glycolysis. Science. 2004;305:99–103. doi: 10.1126/science.1096485. [DOI] [PubMed] [Google Scholar]
- Lacey M, Mercuri N, North R. Two cell types in rat substantia nigra zona compacta distinguished by membrane properties and the actions of dopamine and opioids. J Neurosci. 1989;9:1233–1241. doi: 10.1523/JNEUROSCI.09-04-01233.1989. [DOI] [PMC free article] [PubMed] [Google Scholar]
- Liang C-L, Wang TT, Luby-Phelps K, German DC. Mitochondria mass is low in mouse substantia nigra dopamine neurons: implications for Parkinson’s disease. Exp Neurol. 2007;203:370–380. doi: 10.1016/j.expneurol.2006.08.015. [DOI] [PubMed] [Google Scholar]
- Mercado G, Valdés P, Hetz C. An ERcentric view of Parkinson’s disease. Trends Mol Med. 2013;19:165–175. doi: 10.1016/j.molmed.2012.12.005. [DOI] [PubMed] [Google Scholar]
- Pendergrass W, Wolf N, Poot M. Efficacy of MitoTracker Green and CMXrosamine to measure changes in mitochondrial membrane potentials in living cells and tissues. Cytometry A. 2004;61A:162–169. doi: 10.1002/cyto.a.20033. [DOI] [PubMed] [Google Scholar]
- Richards C, Shiroyama T, Kitai S. Electrophysiological and immunocytochemical characterization of GABA and dopamine neurons in the substantia nigra of the rat. Neuroscience. 1997;80:545–557. doi: 10.1016/s0306-4522(97)00093-6. [DOI] [PubMed] [Google Scholar]
- Richter V, Singh AP, Kvansakul M, Ryan MT, Osellame LD. Splitting up the powerhouse: structural insights into the mechanism of mitochondrial fission. Cell Mol Life Sci. 2015;72:3695–3707. doi: 10.1007/s00018-015-1950-y. [DOI] [PMC free article] [PubMed] [Google Scholar]
- Tucker KR, Block ER, Levitan ES. Action potentials and amphetamine release antipsychotic drug from dopamine neuron synaptic VMAT vesicles. Proc Natl Acad Sci USA. 2015;112:4485–4494. doi: 10.1073/pnas.1503766112. [DOI] [PMC free article] [PubMed] [Google Scholar]
- Tucker KR, Huertas MA, Horn JP, Canavier CC, Levitan ES. Pacemaker rate and depolarization block in nigral dopamine neurons: a somatic sodium channel balancing act. J Neurosci. 2012;32:14519–14531. doi: 10.1523/JNEUROSCI.1251-12.2012. [DOI] [PMC free article] [PubMed] [Google Scholar]
- Wang J, He Z. NAD and axon degeneration: from the Wlds gene to neurochemistry. Cell Adh Migr. 2009;3:77–87. doi: 10.4161/cam.3.1.7483. [DOI] [PMC free article] [PubMed] [Google Scholar]
- Ying W. NAD+/NADH and NADP+/NADPH in cellular functions and cell death: Regulation and biological consequences. Antioxid Redox Signal. 2007;10:179–206. doi: 10.1089/ars.2007.1672. [DOI] [PubMed] [Google Scholar]