

ABSTRACT
The dissolution is one of the critical quality attributes (CQAs) of oral solid dosage forms because it relates to the absorption of drug. In this paper, the influence of raw materials, granules and process parameters on the dissolution of paracetamol tablet was analyzed using latent variable modeling methods. The variability in raw materials and granules was understood based on the principle component analysis (PCA), respectively. A multi-block partial least squares (MBPLS) model was used to determine the critical factors affecting the dissolution. The results showed that the binder amount, the post granulation time, the API content in granule, the fill depth and the punch tip separation distance were the critical factors with variable importance in the projection (VIP) values larger than 1. The importance of each unit of the whole process was also ranked using the block importance in the projection (BIP) index. It was concluded that latent variable models (LVMs) were very useful tools to extract information from the available data and improve the understanding on dissolution behavior of paracetamol tablet. The obtained LVMs were also helpful to propose the process design space and to design control strategies in the further research.
KEYWORDS: dissolution, multi-block partial least squares, Paracetamol, principle component analysis, quality by design
Introduction
Tablet is a preferred oral solid dosage to the public.1 Generally, the production process of tablet mainly consists of several steps: blending, granulating, drying and compaction.2 The target of tablet production process is to get desired quality. According to quality by design (QbD) principles evolved with the International Conference on Harmonization of Technical Requirements for Registration of Pharmaceuticals for Human Use (ICH) Q8 guidance,3 it is of great significance to realize that the quality should be designed into the product. QbD is a systemic approach for drug development that begins with the predefined object and emphasizes product and process understandings based on sound science and quality risk management.3 On the basis of the view point of FDA, a pharmaceutical process is considered to be well understood when all sources of variability are identified and explained, and variability is managed by the process while product quality attributes can be accurately and reliably predicted.4
However, pharmaceutical production processes are complex and multivariate by nature. The relationships between the critical quality attributes (CQAs) and the critical process parameters (CPPs) are complicated. It is necessary to implement appropriate methodologies to develop the production process of tablet under the QbD paradigm. From the perspective of pharmaceutical engineers, mathematical modeling methods play a prominent role in implementing the QbD initiative to develop a pharmaceutical process.5 In recent years, several contributions have been reported to develop new processes under the framework of QbD using modeling methods including first-principle models,6,7 response surface models based on design of experiments8,9,10 and multivariate statistical models.2,11,12 For developing a tablet production process which consists of multiple units, it is difficult to establish a deterministic model to describe the process comprehensively. However, multivariate statistical models are useful tools to improve understandings via identifying the critical material attributes (CMAs) and critical process parameters affecting the quality of the final product, and identifying the most important mechanisms of the production process.13
Among multivariate statistical models, latent variable models (LVMs) may be a better choice. LVMs are statistical models aiming at analyzing a massive amount of data correlated. In general, LVMs include principal component analysis (PCA), projection on latent structures (PLS) and their extended algorithms such as multi-way PCA (MPCA),14 multi-way PLS (MPLS),15 multi-block PLS (MBPLS),16 etc.. The basic idea behind LVMs is that the number of latent variables (LVs) selected is much smaller than that of measurements taken on the system.17 LVMs can be beneficial to identify the driving force contributing to the process system, which are accountable for the data variability by combining the measured variables to form LVs which characterize the main variability in the data.
Dissolution is the CQAs of the tablet and also other oral solid dosage forms because it relates to the effectiveness of medicine.18 The active pharmaceutical ingredient (API) can be absorbed well to take rapid effect in the body when dissolved quickly into blood. Therefore, the dissolution test need to be perform by pharmaceutical administrators to ensure that a specified amount of API is dissolved at predefined time point.19 A drug's solubility is determined by many factors, such as molecular weight, lipophilicity, crystal or amorphous state and pKa.20 But the dissolution of a dosage depends not only on the solubility of the drug itself, but also on the production process when the formulation of the dosage is defined. So the critical process parameters affecting the dissolution should be identified.
In this paper, the paracetamol tablet was taken as an example to illustrate how to use LVMs to assist analyzing the effects of process parameters on the dissolution of pharmaceutical tablet. The functional relationship that linked CPPs to CQAs was determined by the MBPLS model. Based on the variable importance in projection (VIP) index,21 the potential critical process parameters (pCPPs) were identified. Based on the BIP index,2 the critical process units (CPUs) in the production system could also be well defined. The aim of this research is to gain the thorough understanding of the dissolution behavior for an immediate release tablet with limited data collected at the early pharmaceutical development stage. It is an essential step toward the formulation and process design, as well as the definition of the process design space and proposal of control strategy to make sure that the API is dissolved as desired. Furthermore, this paper proposed a rational science-based and quantitative tool to execute a robust quality risk assessment, integrating the modeling understanding with the personal experience on the production process.
Materials and methods
Materials and chemicals
Paracetamol was purchased from the Jiheng Pharmaceutical co., Ltd (China, Batch No. 71404229 and 71407001). Mannitol was purchased from Nanning Chemical & Pharmaceutical co., Ltd (China) and Mingyue Haizao Group co., Ltd (China), respectively. Microcrystalline cellulose (MCC) was purchased from Zhanwang Parmaceutical co., Ltd (China) and Guangda Technology Development co., Ltd respectively (China), respectively. Both Croscarmellose sodium (CCNa) and Magnesium Stearate (MgSt) were purchased from Shanhe Medicinal Materials co., Ltd (China,). The HPLC-grade methanol was purchased from Fisher (the USA). Other reagents were of analytical grade.
Theory of LVMs
Given a data matrix X (m × n) in which the rows represent m samples and the columns stand for n variables, LVMs (e.g. PCA) can decompose the matrix X into a loading matrix P (k × n) and a score matrix T (m × k), where k is the number of principal components which are used to describe the systematic variation of the original data. The function is expressed as follows:
| (1) |
where E (m × n) represents the residual, and k is determined by cross validation or cumulative percent variances.
If the aim is to study the relationship between the input variables and output variables, the regression model can be used. Assuming that X is the input matrix, and Y (m × i) is the corresponding output matrix including m samples and i measurements, LVMs like PLS can decompose X and Y into a reduced latent space in which the covariance between the projection of original samples is maximized. The functions are described as follows:
| (2) |
| (3) |
| (4) |
where P (n × k) and Q (i × k) are loading matrices of X and Y, respectively. W* (n × k) is the weight matrix. EX (m × n) and FY (m × i) are the residual matrices of X and Y, respectively. k is the number of LVs chosen to build the model and it is usually determined by cross validation.
Formulation and preparation of powder mixture
The formulation of paracetamol tablet was composed of 15% paracetamol, 55.3% mannitol, 23.7% MCC, 4% CCNa and 2% MgSt. The paracetamol, mannitol, MCC and CCNa were blended together in ZNW-10 type 3-D blender for 10 min to get a homogeneous powder mixture. Because API and excipients were collected from different sources, binary variables (0,1) were used to characterize source-to-source differences according to whether the raw materials were used to prepare the powder mixture or not. If the API or excipient was used, it was indicated by 1 and on contrary it was indicated by 0 if not.
Production process of paracetamol tablet
Five hundred grams of powder mixture were fed to the SHK-4 type high shear granulator which was bottom driven and granulated at the impeller speed 500 rpm and the chopper speed 500 rpm, while the water was added by a spray nozzle. After that, the wet mass was granulated at the impeller speed 1000 rpm and the chopper speed 1000 rpm. The granules were dried in an infrared oven at the temperature of 60°C and sieved through a 2 mm sieve. Four hundreds gram granules were taken and admixed with extra-granular excipients (MgSt) in 3D blender for 5 min. Finally, the granules were compressed into flat-faced tablets (I.D. 9.0 mm) at the compression force of 55 kN on ZP-10 type rotary tablet press at the speed of 9 rpm/min. A total of 15 experiments were conducted.
Measurement of properties of powder mixture, granule and tablet
Bulk and tapped density
The results of bulk density (Db) and tapped density (Dt) of powder mixture (or granule) were obtained based on the method described in the United States Pharmacopoeia.22 Measurements were conducted in triplicates.
Particle size distribution
The particle size of powder mixture (or granule) was determined by laser diffraction (BT 2001, Dandong Bettersize instrument Ltd., China). The particle size (D10, D50 and D90) was automatically determined. The particle size distribution (Span) was subsequently calculated as follows:
| (5) |
Where D10, D50 and D90 were diameters of powder mixture (or granule) at the 10th, 50th and 90th percentiles of the cumulative percent undersize plot, respectively.
Angle of repose
The angle of repose of powder mixture (or granule) was measured with powder flow ability tester (Copley BEP2, UK).The samples were poured slowly through a funnel onto a platform until a stable heap whose cone base diameter was 100 mm was formed. The angle of repose (α) was measured as the angle made by the inclined plane of the heap with the horizontal.
Hausner ratio
The Hausner ratio (IH) was calculated as follows:
| (6) |
Carr index
The Carr index (IC) was calculated as follows:
| (7) |
Inter-particle porosity
The inter-particle porosity (Ie) was calculated as follows:
| (8) |
Loss on drying
The samples (1∼2 g) were tested with the Sartorius MA35 rapid moisture analyzer (Sartorius scientific Instrument, Germany). Each sample was placed on an aluminum pan at 105°C for 15 min. Then the percentage of loss on drying (HR) of powder mixture (or granules) was recorded until the weight was constant.
API content in granule
The content of paracetamol in granule was determined by HPLC method which is briefly described as follows: the HPLC Agilent 1100 series separation module (Agilent Technologies, Germany) was equipped with a DAD spectrophotometric detector. The separations were carried out at 25°C on ZORBAX SB-C18 (Analytical, Agilent Technologies, 250 mm × 4.6 mm, 5 μm) column using methanol and water (20:80, v/v) as mobile phase. The flow rate was 1.0 mL·min−1 and the detection was performed at wavelength of 245 nm. The injection volume was 10 μL.
Dissolution
The dissolution test was ascertained as directed in USP Pharmacopoeia,19 using Apparatus I (paddle) at 37 ± 0 .5°C in 900 mL 0.24% (v/v) HCl solution with a rotation of 100 rpm. Six tablets were placed in 6 vessels. The samples were then manually removed at the 30th minute and assayed for the paracetamol content by HPLC method.
Data analysis
All data before analysis were pre-processed using mean center and unit variance method. The exploratory analysis with PCA algorithm on data matrices M and G highlighted the correlations among variables within each processing unit. The comprehensive analysis is to understand how variables in different blocks are interacted and how the blocks are related through MBPLS model. All models are built using ProMV software package developed by the ProSensus Inc. (Canada).
Results
The available data are organized in different data blocks according to the unit operation of paracetamol tablet production process. A summary of variables included in each block is listed in Table 1. The powder mixture properties including formulation compositions (API1, API2, Mannitol1, Mannitol2, MCC1 and MCC2), bulk density (Dbm), tapped density (Dtm), particle size distribution (D10m, D50m, D90m, Spanm), angle of repose (αm), Hausner ratio (IHm), Carr index (ICm), inter-particle porosity (Iem) and loss on drying (HRm), the granulation parameters consisting of binder amount and post granulation time, the granule properties incorporating bulk density (Db), tapped density (Dt), particle size distribution (D10, D50, D90, Span), Hausner ratio (IH), Carr index (IC), angle of repose (α) loss on drying (HR) and inter-particle porosity (Ie), API content in granule (API content), the compression parameters containing fill depth and punch tip separation distance (S-Dis) and the tablet quality attributes were organized in the block M, P1, G, P2 and Y, respectively.
Table 1.
A summary of variables included in each data block.
| Block name | Dimensions | Variables included |
|---|---|---|
| M | 15 × 17 | API 1, API 2, MCC 1, MCC 2, Mannitol 1, Mannitol 2, Dtm, Dbm, HRm, IHm, αm, Iem, D10m, D50m, D90m, Spanm, ICm |
| P1 | 15 × 2 | Binder amount, Post granulation time |
| G | 15 × 12 | Dt, Db, HR, IH, α, Ie, D10, D50, D90, Span, IC, API content, |
| P2 | 15 × 2 | Fill depth, Punch tip separation distance (S-Dis) |
| Y | 15 × 1 | Dissolution |
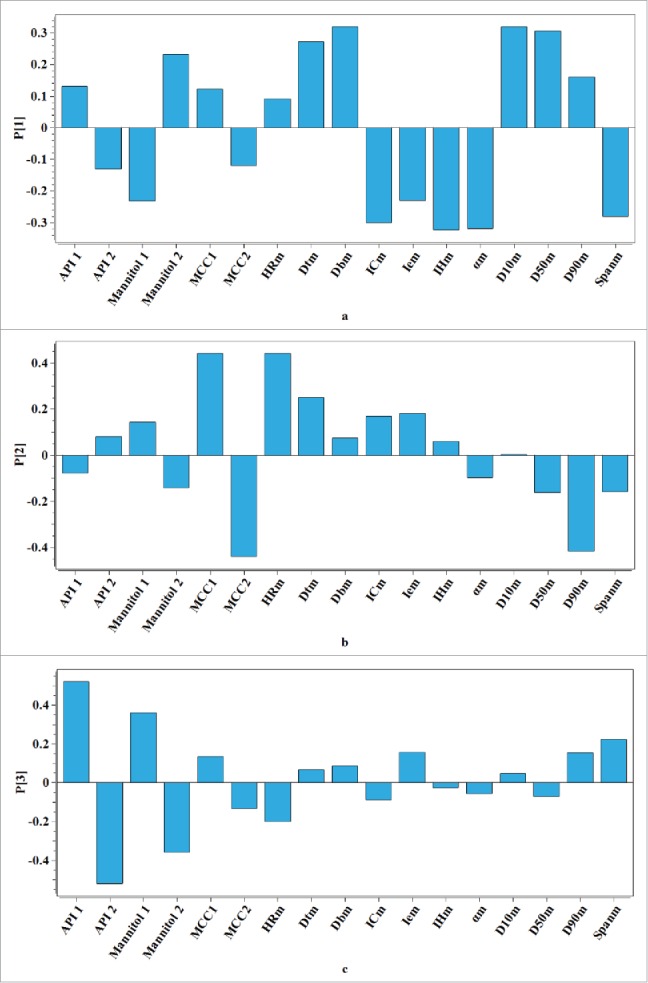
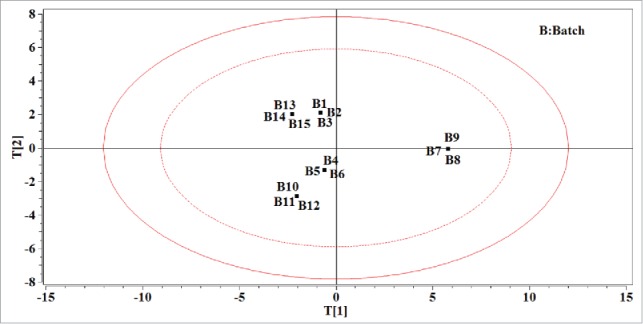
Using a PCA model analyzes the data in the matrix M. A summary of the model diagnostics including the eigenvalues, the explained variance (R2) for principle component (PC) and the cumulative explained variance per PC (R2cum) is shown in Table 2. The number of PCs selected to build the model were chosen according to the rule that eigenvalues of the PC were larger than one. Therefore, the PCA model on matrix M was then built by first 3 PCs. The loading bar plot of the PCA model on matrix M is shown in Fig. 1 A–C. Based on the results obtained, it could be seen that the bar corresponding to Dbm is similar to that of D10m, whereas the bars corresponding to αm and IHm are also similar on the opposite side of them in Fig. 1A. The first PC explained about 55% of the total variability in matrix M mainly describing the differences in the bulk density, the particle size, the angle of repose and the Hausner ratio. The angle of repose and the Hausner ratio reflect the flowability of the powder mixture from different points of view. The Hausner ratio was negatively correlated with the bulk density and there was also a negative correlation relationship between the particle size and the angle of repose. It could be concluded that the powder with better flowability might have larger particle size and smaller bulk density. In Fig. 1B, it indicates that the source of variability explained by the second PC is mainly related to the moisture content of powder mixture and different kinds of MCC which consist of the powder mixture. Fig. 1C indicates that the last of 3 PCs primarily describes the batch difference of the paracetamol. The score plot in Fig. 2 reflects the loading structure of the model and indicates the similarities between the available data in the matrix M. In Fig. 2, powder mixtures B7∼B9 are projected on the right of the diagram, separating from others that are located on the left of the diagram. It showed that the PC1 could separate the powder mixture with larger particle size and bulk density than others. On the other hand, if the API and excipients of the powder mixture were from the same source, their projection on the diagram may stay closely to each other like powder mixtures B1, B2 and B3.
Table 2.
Diagnostics of the PCA model on the data matrix M.
| PCs | Eigenvalues | R2 (%) | R2cum (%) |
|---|---|---|---|
| 1 | 9.40 | 55.28 | 55.28 |
| 2 | 3.98 | 23.41 | 78.70 |
| 3 | 2.87 | 16.91 | 95.61 |
| 4 | 0.747 | 4.39 | 100.00 |
Figure 1.
(A–C) Loading bar plots from the PCA model on the data matrix of powder mixture properties (A refers to the first loading of the PCA model, B refers to the second loading of the PCA model, C refers to the third loading of the PCA model).
Figure 2.
The score plot using the first 2 PCs of the PCA model on data matrix of the powder mixture properties. The ellipse in solid line refers to the confidence limits of 99% and the ellipse in dotted line refers to the confidence limits of 95%.
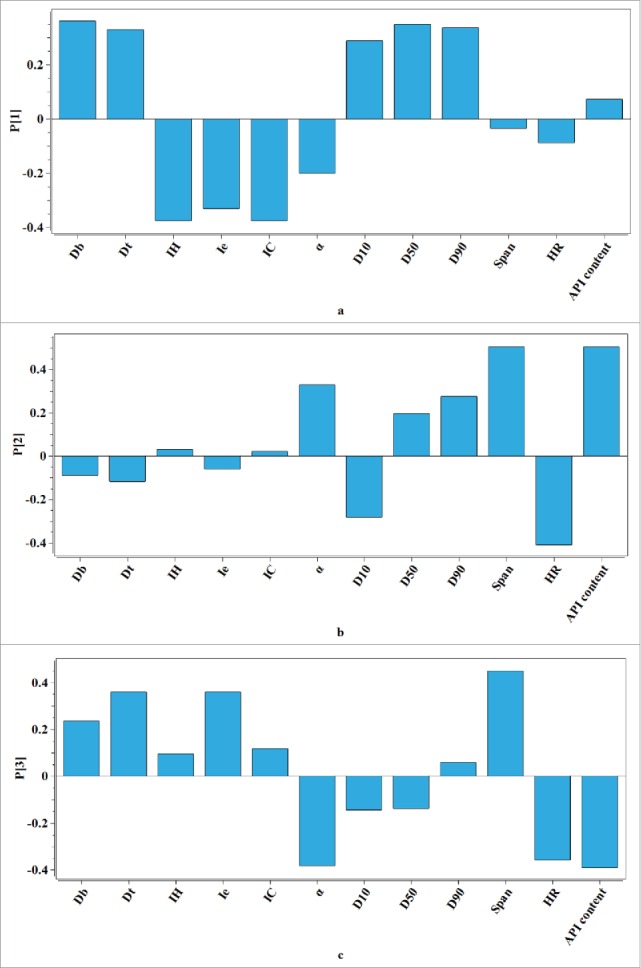
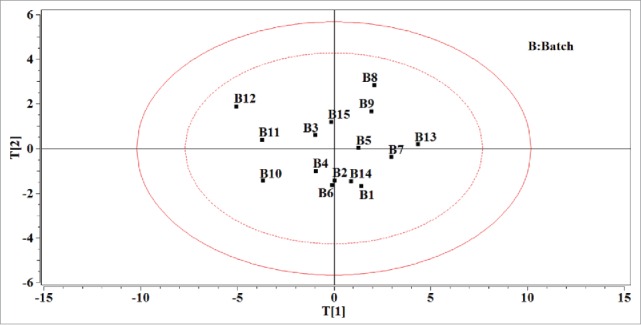
Fifteen batches of granules were processed due to different granulation parameters. A PCA model was built on the matrix G. As can be seen in Table 3, the PCA model on data matrix G is built with 3 PCs that accounts for 84.85% of the total variance. The loading bar plots of the PCA model on matrix G are depicted in Fig. 3 A–C and the score plot based on the first 2 PCs is illustrated in Fig. 4. Analysis of the loading plot in Fig. 4A shows that most of the variability in matrix G results from Db, D50, IC and IH. It could be seen that the particle size had a positive correlation with the bulk density and there was a positive correlation between the Hausner ratio and Carr index as well. The Haunser ratio reflected the flowability of the granule while the Carr index affected the compressibility of the granule. They were both negatively related with the bulk density and the particle size. Hence, when the flowability and compressibility of granule need to be modified, it was useful to adjust the particle size of granule. Figure 3B denotes that the second source of variability for the data matrix G is mainly related to API content. The third PC describes the difference caused by the particle size distribution. As the direction of the first PC, the particle size of different batch increases. The particle size had crucial impact on many properties of the granule, such as the flowability and compressibility, and eventually the dissolution of the tablet. For this reason, 15 batches of granules could be divided into 3 categories according to the particle size. Batches 10, 11 and 12 were in the first category whose D50 ranged from 200 to 350 μm. And the second category's D50 was in the range of 350∼600 μm, where the particle size of batches 1, 2, 3, 4, 5, 6, 14 and 15 spread. The remaining batches were in the third category whose D50 was larger than 800 μm. As a result of the difference of particle size among different batches, a further process parameters optimization research could be necessarily considerable.
Table 3.
Diagnostics of the PCA model on the data matrix G.
| PCs | Eigenvalues | R2 (%) | R2cum (%) |
|---|---|---|---|
| 1 | 6.75 | 56.28 | 56.28 |
| 2 | 2.09 | 17.39 | 73.68 |
| 3 | 1.34 | 11.17 | 84.85 |
| 4 | 0.758 | 6.32 | 91.16 |
Figure 3.
(A–C) Loading bar plots from the PCA model on the data matrix of granule properties. (A refers to the first loading of the PCA model, B refers to the second loading of the PCA model, C refers to the third loading of the PCA model.)
Figure 4.
The score plot using the first 2 PCs of the PCA model on the data matrix of granule properties. The ellipse in solid line refers to the confidence limits of 99% and the ellipse in dotted line refers to the confidence limits of 95%.
The variables manipulated in different process units were used as independent variables, and were organized as data matrix [M, P1, G, P2]. The dissolution of tablet was taken as the response variable. The MBPLS model was then emplyed to predict the dissolution. The diagnostics of the MBPLS model on the basis of explained variance per LV both for the independent variables (R2X) and for the response variable (R2Y) are reported in Table 4. The corresponding cumulative values (R2Xcum and R2Ycum) and the variances explained by the model in cross validation (Q2Y and Q2Ycum) are also shown in Table 4. When the number of LV is over 7, the variance explained by the model was no longer significant. So six LVs were used to build the MBPLS model. The MBPLS model is more useful in predicting the response from the input data. The predictive ability will be primarily influenced by the variables which have a vital impact on the response. The VIP index can be used to measure the importance of the variable i. The function of VIP is defined as follows.21
| (9) |
Table 4.
Diagnostics of the multi-block PLS model.
| LVs | R2X (%) | R2Xcum (%) | R2Y (%) | R2Ycum (%) | Q2Y (%) | Q2Ycum (%) |
|---|---|---|---|---|---|---|
| 1 | 19.89 | 19.89 | 83.33 | 83.33 | 32.79 | 32.79 |
| 2 | 34.17 | 54.06 | 6.09 | 89.42 | 29.83 | 62.62 |
| 3 | 15.28 | 69.34 | 3.71 | 93.13 | 8.53 | 71.16 |
| 4 | 5.34 | 74.68 | 3.56 | 96.69 | 1.11 | 72.27 |
| 5 | 10.89 | 85.47 | 0.77 | 97.46 | 5.81 | 78.08 |
| 6 | 4.96 | 90.43 | 0.61 | 98.07 | 2.70 | 80.78 |
| 7 | 2.50 | 92.93 | 0.92 | 98.99 | 2.51 | 83.29 |
In Eq. (1), n is the total number of the variables considered, is the variance of the response explained by the k-th LV of the model, while is the weight of i-th variable on the k-th LV calculated from the MBPLS model. A variable could be considered to be indispensable in prediction of the response if its VIP value was larger than 1.22 Figure 5 reports the VIP indexes for variables in the MBPLS model. Five variables have VIP values above the threshold 1. The key variables for predicting the dissolution were the S-Dis, the fill depth, the binder amount, the post granulation time, and the API content. Results suggested that further process optimization experiment should pay more attention to these variables. The importance of each data block can be determined by the value of BIP index, which can be calculated by Eq. 2.2
| (10) |
Figure 5.
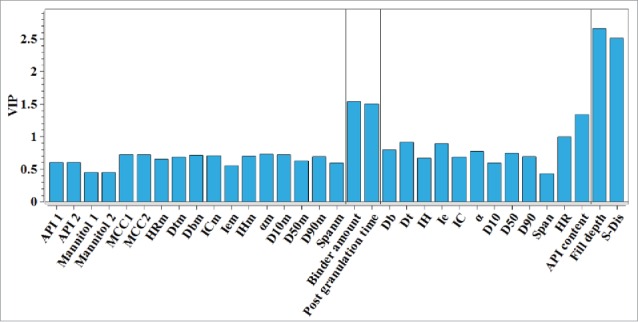
Variable importance in the projection (VIP) indexes of the input variables in the MBPLS model for the whole manufacturing process of the paracetamol tablet.
Where m is the number of blocks, and is the weight of the i-th block on the k-th LV of the MBPLS model. As the same to VIP, a threshold equal to 1 was applied to assess whether a block was important in prediction of the response.2 The bar plot of BIP indexes of the 4 blocks used to build the MBPLS model is reported in Fig. 6. In Fig. 6, it is found that the P2 block (i.e. the compression unit) is the most crucial in determining the CQAs, and the contribution of the G block (i.e., the granule properties) is also significant.
Figure 6.
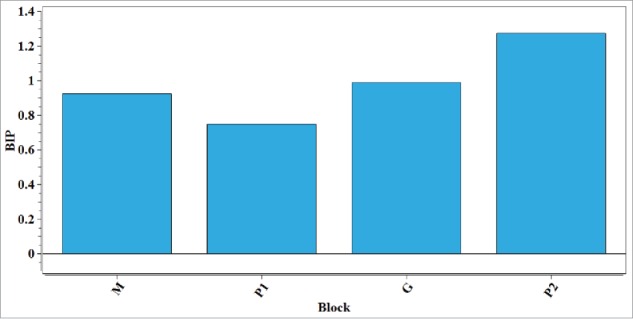
BIP indexes of the blocks of the MBPLS model on the production process of the paracetamol tablet. (Block M refers to the powder mixture properties, Block P1 refers to the granulation parameters, Block G refers to the granule properties and Block P2 refers to the compression parameters.)
Discussions
In this paper, the application of LVMs to analyzing the dissolution of the paracetamol tablet was presented. Principle component analysis was used to identify the important variables manifesting the variability in the data of powder mixtures and intermediate granules' properties. A MBPLS model was built on the whole tablet manufacture process. Based on the results of multivariate data analysis, it was found that the critical process parameters affecting the dissolution of paracetamol tablet were the binder amount, the post granulation time, the fill depth, the punch tip separation distance and the API content in granule. These results indicated that not only the tablet compression parameters but also the intermediate granule properties affected the dissolution behavior of the paracetamol tablet. In order to control the quality of paracetamol tablet, on one hand, the compression parameters including the fill depth and S-Dis should be investigated in detail further to analyze how these parameters would affect the dissolution. On the other hand, since the critical quality attributes of intermediate granules influenced the tablet dissolution, the granulation process parameters including the binder amount and the post granulation time should also be investigated. However, the dissolution of paracetamol was only determined at the single time point of 30 min, which was not enough to capture the complete dissolution dynamics. Therefore, in order to achieve a profound understanding on the dissolution behavior of the paracetamol tablet, the in vitro dissolution curve and dissolution rate will be studied in further experiments.
Disclosure of potential conflicts of interest
No potential conflicts of interest were disclosed.
Funding
We would like to thank the National Natural Science Foundation of China (No.81403112) and the special project for Beijing Key Laboratory of TCM Manufacturing Process Control and Quality Evaluation supported by Beijing Municipal Science & Technology Commission (No.Z151100001615065) for general financial supports.
References
- [1].Pore M. Pharmaceutical tablet compaction: product and process design [Dissertation]. [Massachusetts: ]: Massachusetts Institute of Technology; 2007. 210p. [Google Scholar]
- [2].Liu Z, Bruwer MJ, MacGregor JF, Rathore SS, Reed DE, Champagne MJ. Modeling and optimization of a tablet manufacturing line. J Pharm Innova 2011; 6:170-80; http://dx.doi.org/ 10.1007/s12247-011-9112-8 [DOI] [Google Scholar]
- [3].ICH Expert Working Group Q8 Guideline: Pharmaceutical development. In: ICH Harmonised Tripartite Guideline, ed. Geneva: International Conference on Harmonisation of Technical Requirements for Registration of Pharmaceuticals for Human Use, 2009:1. [Google Scholar]
- [4].Lawrence XY, Amidon G, Khan MA, Hoag SW, Polli J, Raju GK, Woodcock J. Understanding pharmaceutical quality by design. AAPS J 2014; 16:771-83; PMID:24854893; http://dx.doi.org/ 10.1208/s12248-014-9598-3 [DOI] [PMC free article] [PubMed] [Google Scholar]
- [5].Tomba E, Facco P, Bezzo F, Barolo M. Latent variable modeling to assist the implementation of Quality-by-Design paradigms in pharmaceutical development and manufacturing: A review. Int J Pharm 2013; 457:283-97; PMID:24016743; http://dx.doi.org/ 10.1016/j.ijpharm.2013.08.074 [DOI] [PubMed] [Google Scholar]
- [6].Wechselberger P, Seifert A, Herwig C. PAT method to gather bioprocess parameters in real-time using simple input variables and first principle relationships. Chem Eng Sci 2010; 65:5734-46; http://dx.doi.org/ 10.1016/j.ces.2010.05.002 [DOI] [Google Scholar]
- [7].Adam S, Suzzi D, Radeke C, Khinast JG. An integrated Quality by Design (QbD) approach towards design space definition of a blending unit operation by Discrete Element Method (DEM) simulation. Eur J Pharm Sci 2011; 42:106-15; PMID:21056102; http://dx.doi.org/ 10.1016/j.ejps.2010.10.013 [DOI] [PubMed] [Google Scholar]
- [8].Luo G, Xu B, Sun F, Cui XL, Shi XY, Qiao YJ. Quality by design based high shear wet granulation process development for the microcrystalline cellulose. Acta Pharmaceutica Sinica A 2015; 50:355-9. [PubMed] [Google Scholar]
- [9].Xie LIN, Wu H, Shen M, Augsburger LL, Lyon RC, Khan MA, Hoag SW. Quality by design (QbD): Effects of testing parameters and formulation variables on the segregation tendency of pharmaceutical powder measured by the ASTM D 6940-04 segregation tester. J Pharm Sci 2008; 97:4485-97; PMID:18271036; http://dx.doi.org/ 10.1002/jps.21004 [DOI] [PubMed] [Google Scholar]
- [10].Souihi N, Josefson M, Tajarobi P, Gururajan B, Trygg J. Design space estimation of the roller compaction process. Ind Eng Chem Res 2013; 52:12408-19; http://dx.doi.org/ 10.1021/ie303580y [DOI] [Google Scholar]
- [11].Huang J, Kaul G, Cai C, Chatlapalli R, Hernandez-Abad P, Ghosh K, Nagi A. Quality by design case study: an integrated multivariate approach to drug product and process development. Int J Pharm 2009; 382:23-32; PMID:19664698; http://dx.doi.org/ 10.1016/j.ijpharm.2009.07.031 [DOI] [PubMed] [Google Scholar]
- [12].Zacour BM, Drennen JK, Anderson CA. Development of a fluid bed granulation design space using critical quality attribute weighted tolerance intervals. J Pharm Sci 2012; 101:2917-29; PMID:22570275; http://dx.doi.org/ 10.1002/jps.23185 [DOI] [PubMed] [Google Scholar]
- [13].Tomba E, De Martin M, Facco P, Robertson J, Zomer S, Bezzo F, Barolo M. General procedure to aid the development of continuous pharmaceutical processes using multivariate statistical modeling-An industrial case study. Int J Pharm 2013; 444:25-39; PMID:23337630; http://dx.doi.org/ 10.1016/j.ijpharm.2013.01.018 [DOI] [PubMed] [Google Scholar]
- [14].Kosanovich KA, Piovoso MJ, Dahl KS, MacGregor JF, Nomikos P. Multi-way PCA applied to an industrial batch process. In American Control Conference 1994; 2:1294-8. [Google Scholar]
- [15].Nomikos P, MacGregor JF. Multi-way partial least squares in monitoring batch processes. Chemometr Intell Lab 1995; 30:97-108; http://dx.doi.org/ 10.1016/0169-7439(95)00043-7 [DOI] [Google Scholar]
- [16].MacGregor JF, Jaeckle C, Kiparissides C, Koutoudi M. Process monitoring and diagnosis by multiblock PLS methods. AIChE J 1994; 40:826-38; http://dx.doi.org/ 10.1002/aic.690400509 [DOI] [Google Scholar]
- [17].Rajalahti T, Kvalheim OM. Multivariate data analysis in pharmaceutics: a tutorial review. Int J Pharm 2011; 417:280-90; PMID:21335075; http://dx.doi.org/ 10.1016/j.ijpharm.2011.02.019 [DOI] [PubMed] [Google Scholar]
- [18].Yu DG, Li XY, Wang X, Yang JH, Bligh SA, Williams GR. Nanofibers fabricated using triaxial electrospinning as zero order drug delivery systems. ACS Appl Mater Interfaces 2015; 7:18891-7; PMID:26244640; http://dx.doi.org/ 10.1021/acsami.5b06007 [DOI] [PubMed] [Google Scholar]
- [19].Pharmacopeia of USA USP chapter 711: dissolution. 2016:295-301. [Google Scholar]
- [20].Almukainzi M, Okumu A, Wei H, Löbenberg R. Simulation of In Vitro Dissolution Behavior Using DDDPlus™. AAPS PharmSciTech 2015; 16:217-21; PMID:25409918; http://dx.doi.org/ 10.1208/s12249-014-0241-5 [DOI] [PMC free article] [PubMed] [Google Scholar]
- [21].Chong IG, Jun CH. Performance of some variable selection methods when multi-collinearity is present. Chemometr Intell Lab 2005; 78:103-12; http://dx.doi.org/ 10.1016/j.chemolab.2004.12.011 [DOI] [Google Scholar]
- [22].Pharmacopeia of USA USP chapter 616: bulk density and tapped density. 2016:255-8. [Google Scholar]