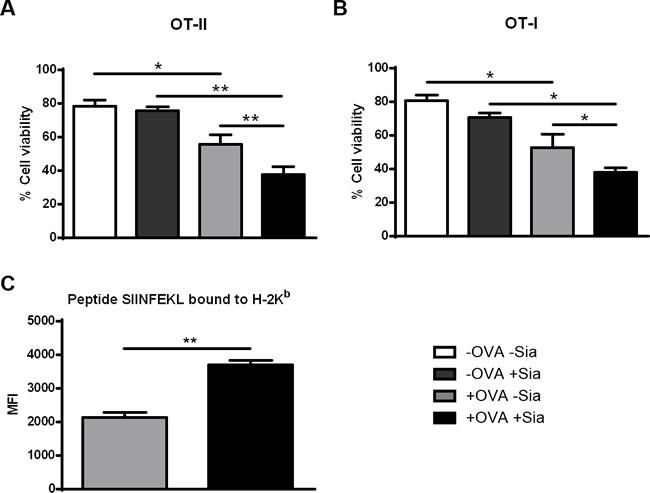
Figure 6. Sialidase treatment of murine sDCs loaded with OVA improves T cell cytotoxicity against tumor cells.

Induction of cytolysis of tumor cells was tested by co-culturing untreated (grey light bars) or sialidase treated (black bars) OVA-pulsed DCs and splenocytes from either OT-II (A.) or OT-I (B.) splenocytes for 72h. After, primed T cells and OVA-expressing B16 mouse melanoma cells (B16-OVA) were co-cultured for 24h. B16-OVA tumor cell death was assessed by staining with Annexin-V and 7-AAD and analysed by flow cytometry. Graph values represent the percentage ± SEM of viable tumor cells of 2 independent assays. Statistical significance (*P < 0.05 or **P < 0.001) refers to the difference between fully sialylated and desialylated sDCs (n = 2). (C.) Desialylated sDCs show improved presentation of endocytosed ovalbumin-derived peptide SIINFEKL, bound to MHC class I. Murine splenic DCs were first incubated with OVA and treated (black bars) or not (grey bars) with sialidase. After these treatments, the presentation of the ovalbumin-derived peptide SIINFEKL bound to H-2Kb (murine MHC class I) epitopes was analysed by flow cytometry, using the 25-D1.16 monoclonal mAb. Graphs show the MFI ± SEM of 2 independent assays. Statistical significance (**P < 0.001) refers to the difference between fully sialylated and desialylated sDCs and it was determined using t-test.
