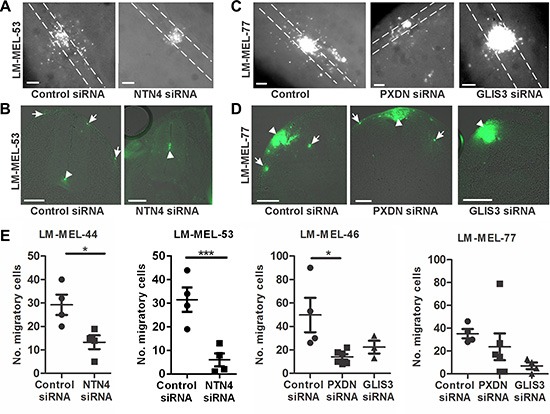
Figure 7. Depletion of PXDN, NTN4 and GLIS3 inhibits melanoma invasion in the chicken transplantation model.

Melanoma cells were treated with CM-Dio and transfected with either 10 nM control siRNA, PXDN, NTN4 or GLIS3 specific siRNA. Cells were cultured as hanging drops and introduced into the trunk neural tube of 2 day chicken embryos (Hamburger-Hamilton stages 11 to 14). (A) Whole mount images of embryos transplanted with control or NTN4 siRNA treated LM-MEL-53. White dotted lines show the outline of the neural tube. (B) Cross section of embryos showing motility of melanoma cells after control or NTN4 siRNA treatment. Arrows indicate motile melanoma cells, arrowheads show melanoma cells that remain in the neural tube. (C) Whole mount images of embryos transplanted with control or GLIS3 or PXDN siRNA in LM-MEL-77. White dotted lines show the outline of the neural tube. (D) Cross-section of embryos showing motility of melanoma cells after control or PXDN or GLIS3 siRNA treatment. Arrows indicate the motile melanoma cells, and arrowheads show melanoma cells that remain at the site of transplantation. (E) The number of cells outside the neural tube from each embryo was counted and plotted for LM-MEL-44 and -53 after NTN4 or control siRNA treatment. The same controls were used in the Slug and Snail siRNA treatments (Figure 2E) and these data were analysed together using ANOVA with post-hoc Tukey test (*p <.05). The number of cells outside the neural tube from each embryo was counted and plotted for LM-MEL-77 and -46 after GLIS3, PXDN or control siRNA treatments. Lines indicate mean +/− SEM, (Anova with post-hoc Tukey test, *p <.05). Scale bars = 100 μm.
