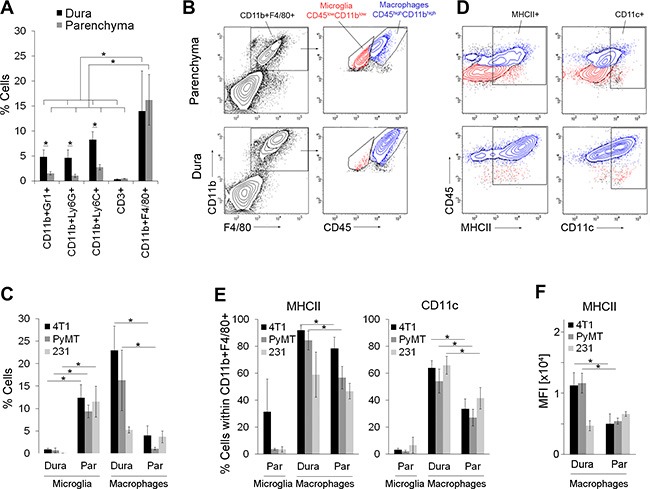
Figure 2. Inflammatory tumor microenvironment in dural and parenchymal brain metastases.

(A) Infiltration of immune cells into dural (dura) and parenchymal 4T1 cancer lesions (parenchyma) in intracarotid artery model; n = 5. (B) Representative flow cytometry analysis of microglia and macrophages within parenchymal (top) and dural lesions (bottom) in 4T1 breast cancer model. Microglia were identified as CD45lowCD11blow cells (red) and macrophages as CD45highCD11bhigh cells (blue) within the CD11b+F4/80+ gate. (C) Quantification of microglia and macrophages in 4T1, PyMT and MDA-MB-231 (231) models based on the flow cytometry analysis shown in Figure 2B, Supplementary Figure S5A–S5B; n = 4. (D) Representative flow cytometry analysis of MHCII and CD11c expression in the microglia (red) and macrophages (blue) within parenchymal (top) and dural (bottom) 4T1 metastases. The contour plots were gated on the CD11b+F4/80+ population shown in B. (E) Quantification of MHCII+ and CD11c+ cells within the microglia and macrophage populations in 4T1, PyMT and MDA-MB-231 models based on the flow cytometry analysis shown in Figure 2D, Supplementary Figure S5A–S5B; n = 4. (F) Mean fluorescent intensity (MFI) for MHCII expression in dural and parenchymal MAMs; n = 4. Statistical significance in A, C, E and F was determined using one-tailed Student's T-test with unequal variance (p ≤ 0.05). Error bars represent standard deviations (SD).
