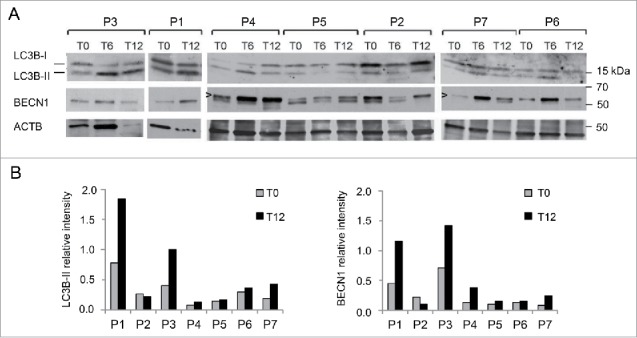
Figure 6.

Analysis of autophagy in blood leukocytes of BM and UCMD patients before and after the LPD trial. (A) Western blot of MAP1LC3B/LC3B and BECN1 levels in protein lysates of blood leukocytes at T0, T6 and T12. For patient 1, blood sample at T6 was not available. ACTB was used as a loading control. Arrowheads point at the specific band of BECN1. Data are representative of 2 technical replicates. (B) Densitometric quantification of western blot for LC3B and BECN1 in leukocyte fractions at T0 and T12. LC3B-II and BECN1 protein levels were calculated as relative intensity with respect to ACTB. Data represent mean value at T0 and T12 for each patient (2 experiments). P = 0.042 and P = 0.062, respectively for the comparison of LC3B-II and BECN1 values between T0 and T12 (Wilcoxon signed rank test for paired data).
