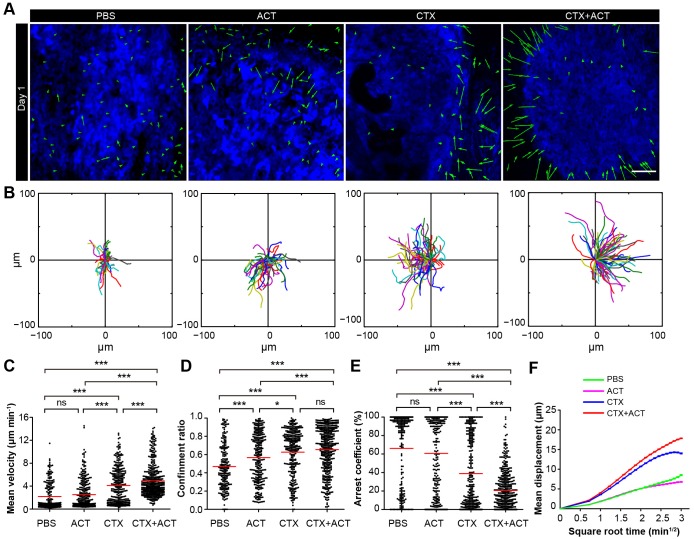
Figure 6. Migratory behavior of the TIIs following different treatments.
(A) In vivo time-lapse images of the EGFP TIIs in the CFP-B16 tumor area on Day 1. Mice were treated with ACT, CTX, CTX-ACT or PBS control. Green arrows represent TIIs displacement, and blue areas represent CFP-B16 tumors. Scale bar: 100 µm. (B) The trajectories of individual EGFP TIIs in different treated groups were plotted following the alignment of their starting positions. (C–E) Scatter plots of the (C) mean velocity, (D) confinement ratio, and (E) arrest coefficient of the EGFP TIIs in the differently treated groups. Each data point represents a single cell, and the red bars indicate mean values. *p<0.05, **p<0.01, ***p<0.001; ns, not significant (Figure 6—source data 1). (F) Random walking analysis of the TIIs in the different groups. Mean displacement (μm) versus the square root of time (min1/2) of TIIs in different treatment groups ( Figure 6—source data 2–6). The data from 12–15 mice in three independent experiments were pooled.
DOI: http://dx.doi.org/10.7554/eLife.14756.044


