Abstract
Atypical protein kinase Cι (PKCι) is an oncogene in lung and ovarian cancer. The PKCι gene PRKCI is targeted for frequent tumor-specific copy number gain (CNG) in both lung squamous cell carcinoma (LSCC) and ovarian serous carcinoma (OSC). We recently demonstrated that in LSCC cells PRKCI CNG functions to drive transformed growth and tumorigenicity by activating PKCι-dependent cell autonomous Hedgehog (Hh) signaling. Here, we assessed whether OSC cells harboring PRKCI CNG exhibit similar PKCι-dependent Hh signaling. Surprisingly, we find that whereas PKCι is required for the transformed growth for OSC cells harboring PRKCI CNG, these cells do not exhibit PKCι-dependent Hh signaling or Hh-dependent proliferation. Rather, transformed growth of OSC cells is regulated by PKCι-dependent nuclear localization of the oncogenic transcription factor, YAP1. Lentiviral shRNA-mediated knock down (KD) of PKCι leads to decreased nuclear YAP1 and increased YAP1 binding to angiomotin (AMOT), which sequesters YAP1 in the cytoplasm. Biochemical analysis reveals that PKCι directly phosphorylates AMOT at a unique site, Thr750, whose phosphorylation inhibits YAP1 binding. Pharmacologic inhibition of PKCι decreases YAP1 nuclear localization and blocks OSC tumor growth in vitro and in vivo. Immunohistochemical analysis reveals a strong positive correlation between tumor PKCι expression and nuclear YAP1 in primary OSC tumor samples, indicating the clinical relevance of PKCι-YAP1 signaling. Our results uncover a novel PKCι-AMOT-YAP1 signaling axis that promotes OSC tumor growth, and provide a rationale for therapeutic targeting of this pathway for treatment of OSC.
Keywords: Ovarian serous cancer, Protein Kinase Cι, Yes-associated Protein 1, angiomotin, nuclear localization, tumorigenesis
INTRODUCTION
Ovarian cancer is the most deadly gynecological cancer, accounting for >14,000 death in the United States annually.1 The most common ovarian cancer sub-type, ovarian serous cancer (OSC), frequently responds to initial treatment with platinum-based chemotherapy, but often relapses with platinum-resistant disease. Given the poor prognosis of OSC patients, new therapeutic strategies are needed to more effectively treat this disease. Unfortunately, few oncogenic drivers have been identified in OSC that can form the basis of new therapeutic strategies. We previously discovered that PKCι is an oncogene in lung squamous cell carcinoma (LSCC), a major form of non-small cell lung cancer (NSCLC).2–4 LSCC tumors harbor frequent CNGs in the PKCι gene, PRKCI. PRKCI is a critical target of the chromosome 3q26 amplicon,2 one of the most frequently amplified genomic regions in human cancers.5 We recently demonstrated that PRKCI CNG drives PKCι expression and establishes a novel PKCι-dependent Hh signaling axis that controls the transformed growth of LSCC cells.3 Interestingly, ~80% of OSCs also exhibit PRKCI CNGs, which is associated with elevated PKCι expression.6, 7 We and others have demonstrated that PKCι is required for the transformed growth and tumorigenicity of ovarian cancer cell lines,6, 7 however, the molecular mechanism(s) by which PKCι drives OSC tumor growth remain unclear. We now report that PKCι regulates the activity of the oncogenic transcription factor YAP1 by modulating binding of YAP1 to AMOT130. We further demonstrate that pharmacologic inhibition of PKCι-AMOT-YAP1 signaling inhibits OSC growth and tumor formation in vivo.
RESULTS
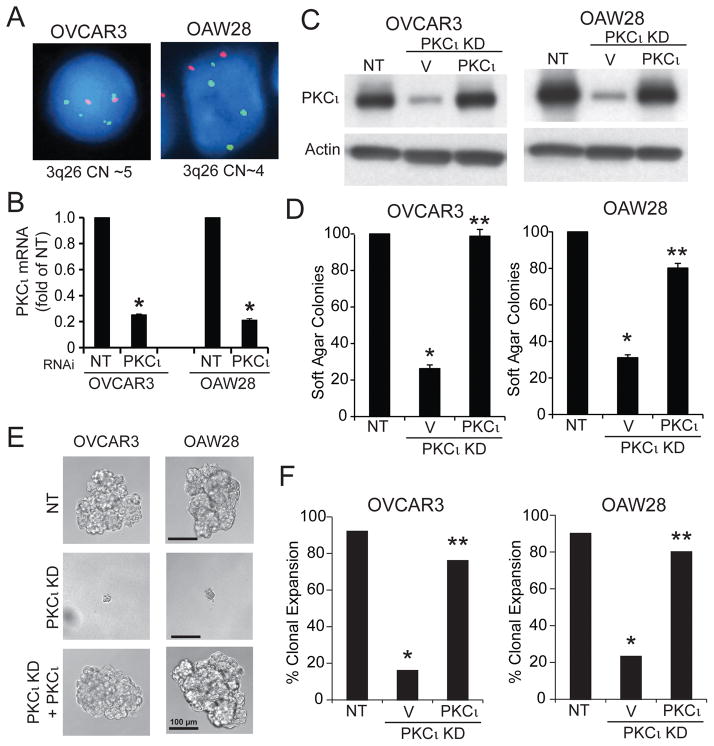
PKCι is required for the transformed growth of both NSCLC and ovarian cancer cells.2, 3, 6–10 PKCι is often activated in human tumors through recurrent gains in PRKCI copy number as part of a 3q26 amplicon.3, 11 In LSCC cells harboring PRKCI CNG, we recently showed that PKCι drives tumorigenesis by activating a PKCι-SOX2-Hh signaling axis.3 Since ovarian serous carcinoma (OSC) also harbors frequent PRKCI CNG, we assessed whether PKCι activates a similar Hh signaling pathway in OSC cells. We first characterized two human OSC cell lines reported to harbor PRKCI CNG by GISTIC analysis,12 OVCAR3 and OAW28. These cells also exhibit high genetic similarity to high grade serous ovarian tumors,13 making them ideal for this study. Fluorescence in-situ hybridization (FISH) analysis confirmed that both cell lines harbor 3q26 CNG (Fig 1A). Lentiviral shRNA-mediated knock down (KD) of PKCι using a previously characterized and validated shRNA targeting the 3′UTR of PKCι3 led to a significant depletion of PKCι mRNA (Fig 1B). Transfection of PKCι KD cells with either a PKCι or empty control expression plasmid allowed efficient control of PKCι expression (Fig 1C). PKCι KD cells exhibited a significant decrease in soft agar colony formation (Fig 1D), oncosphere growth (Fig 1E) and clonal expansion efficiency (Fig 1F) that was reversed by expression of exogenous PKCι. Thus, PKCι is important for transformed growth of OSC cells harboring PRKCI CNG.
Figure 1. PKCι is required for the transformed growth of Ovarian Serous Carcinoma (OSC) Cells.
A. FISH analysis demonstrating CNG of the 3q26 locus in OVCAR3 (CN=5) and OAW28 (CN=4) OSC cells. B. QPCR showing RNAi-mediated knockdown of PKCι (PKCι KD) expression in OVCAR3 and OAW28 cells. Results are presented as fold of NT +/−SEM. N=3. *p<0.05 compared to NT. C. Immunoblot analysis for PKCι and Actin in NT cells, and PKCι KD cells expressing either a control vector (V) or exogenous PKCι. D. Effect of PKCι KD on soft agar colony formation. Results are presented as fold of NT control. N=5. *p<0.05 compared to NT; **p<0.05 compared to PKCι KD. E. Micrographs of single NT KD cells, and PKCι KD cells expressing control vector or exogenous PKCι grown in non-adherent culture. Results are representative of the cell populations. F. Effect of PKCι KD on clonal expansion efficiency of OSC cells in non-adherent culture. Results presented as % clonal expansion. *p<0.05 compared to NT; **p<0.05 compared to PKCι KD by Chi-square analysis. N=25 (OVCAR3) and 30 (OAW28).
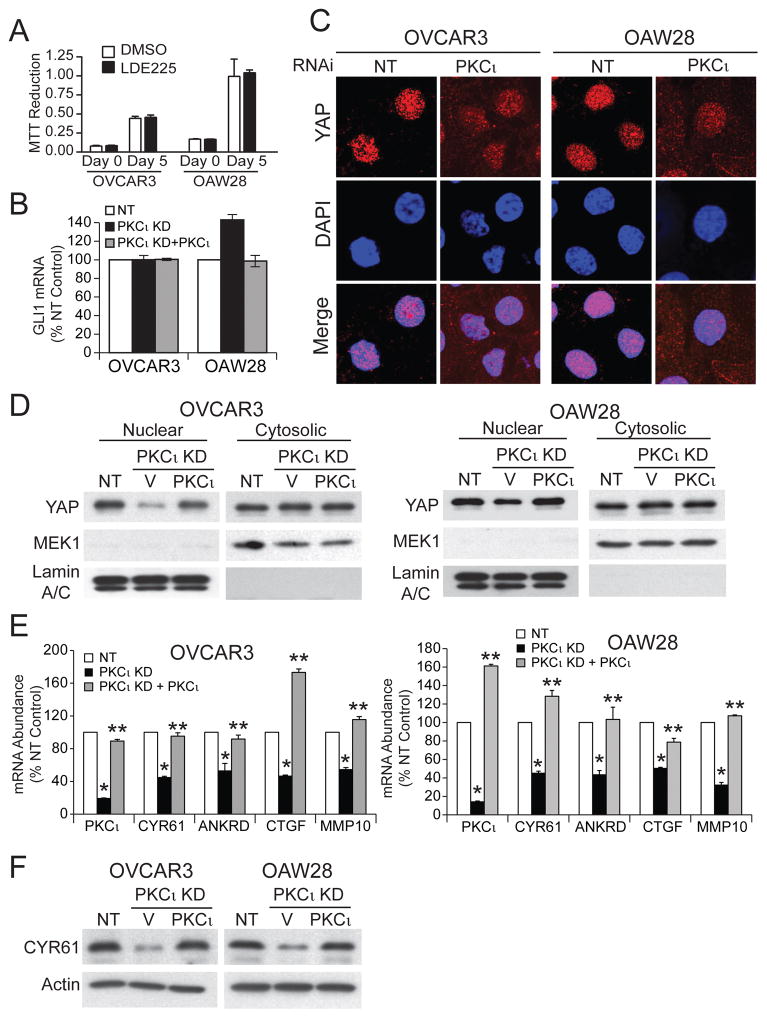
PKCι drives transformed growth of LSCC cells by activating Hh signaling.3 Thus, we assessed whether OSC cells also exhibit Hh-dependent growth. Interestingly, treatment of OSC cells with the SMO inhibitor LDE225 had no effect on oncosphere growth (Fig 2A), in sharp contrast to the potent growth inhibitory effect of LDE225 on LSCC cells.3 Furthermore, PKCι KD in OSC cells did not inhibit expression of the major Hh transcriptional regulator GLI1, whose expression is PKCι-dependent in LSCC cells (Fig 2B).3 These data indicate that PKCι drives OSC growth through a distinct Hh-independent mechanism.
Figure 2. PKCι modulates nuclear YAP1.
A. Effect of the SMO inhibitor LDE225 (1 μM) on growth of OSC cells was assessed by MTT assay. Results presented as MTT reduction +/−SEM. N=5. B. Effect of PKCι KD and exogenous PKCι on GLI1 expression in OSC cells. Results represent GLI1 RNA abundance expressed % NT control +/− SEM. N=3. C. Immunofluorescence detection of YAP1 (red) and nuclei (DAPI; blue) in NT and PKCι KD OSC cells. D. Immunoblot analysis of nuclear and cytoplasmic extracts of NT, and PKCι KD cells expressing control vector or PKCι for YAP1. MEK1 and Lamins A/C serve as cytoplasmic and nuclear controls respectively. Results are representative of three independent experiments. E. QPCR analysis for expression of PKCι, CYR61, ANKRD1, CTGF and MMP10 mRNA in NT and PKCι KD cells expressing either control vector or PKCι. Results expressed as % NT control. N=3. *p<0.05 compared to NT; **p<0.05 compared to PKCι KD. F. Immunoblot analysis of total cell lysates from NT, and PKCι KD cells expressing control vector or PKCι for CYR61. Actin serves as a loading control. Results are representative of two independent experiments.
YAP1 is an oncogene required for transformed growth of OSC cells.14, 15 Interestingly, PKCι can regulate nuclear YAP activity in non-transformed epithelial cells.16 Therefore, we assessed the effect of PKCι KD on YAP1 nuclear localization in OSC cells. Immunofluorescence microscopy revealed decreased nuclear YAP1 and increased cytoplasmic YAP1 staining in PKCι KD OSC cells (Fig 2C). Cellular fractionation and immunoblot analysis confirmed decreased nuclear YAP1 and increased cytoplasmic YAP1 in PKCι KD cells compared to NT control cells that was reversed by expression of exogenous PKCι (Fig 2D). QPCR revealed that PKCι KD significantly inhibited expression of the YAP1 target genes CYR61, ANKRD1 and CTGF, and the PKCι-MEK-ERK target gene MMP104 (Fig 2E). Expression of each gene was restored by expression of exogenous PKCι (Fig 2E). Immunoblot analysis confirmed PKCι-dependent expression of CYR61 (Fig 2F), a protein implicated in oncogenic YAP1 signaling in ovarian cancer.17–20
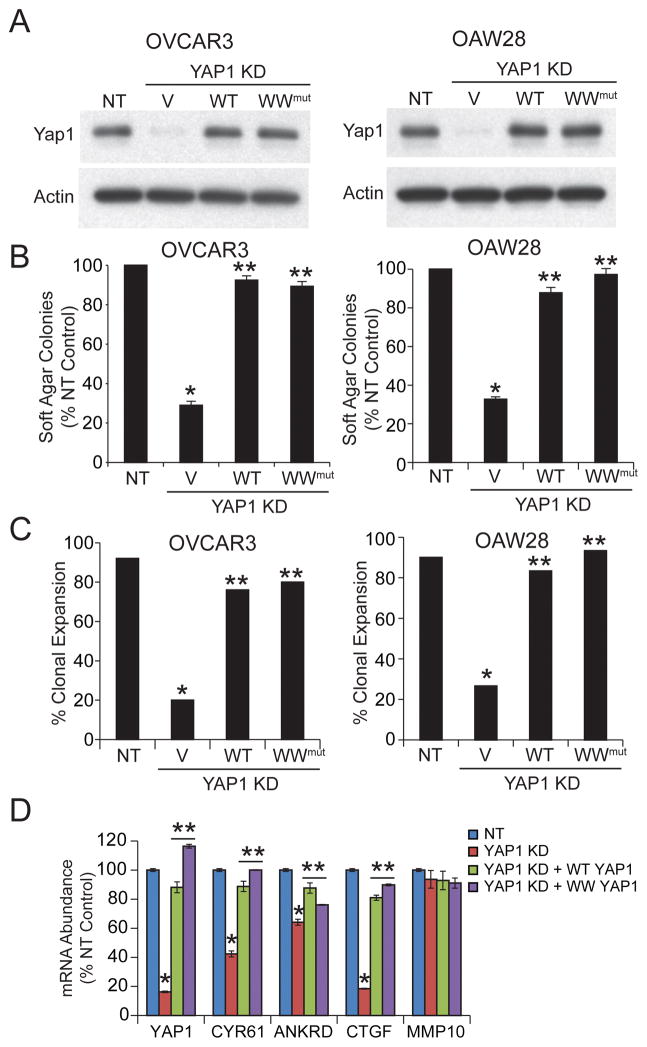
To validate the role of YAP1 in OSC cell proliferation, OSC cells were stably transduced with lentiviral shRNA targeting YAP1 (Fig 3A). Consistent with published results, YAP1 KD inhibited OSC cell soft agar colony formation (Fig 3B) and clonal expansion (Fig 3C). The effects of YAP1 KD were reversed by expression of exogenous wild-type YAP1 (Fig 3B and C). Two major mechanisms regulate YAP1 subcellular localization.21 Multi-site YAP1 phosphorylation, mediated by multiple kinases including PKCζ, an atypical PKC isozyme closely related to PKCι, induce cytoplasmic retention of YAP1.21, 22 Therefore, we assessed the phosphorylation status of YAP1 in NT and PKCι KD OSC cells by mass spectrometry. Our analysis provided complete coverage of all known YAP1 phosphorylation sites and revealed no effect of PKCι KD on YAP1 phosphorylation. The second major mechanism regulating cytoplasmic retention of YAP1 involves binding to angiomotin (AMOT).21 As expected, expression of a constitutively active WW domain YAP1 mutant, which is incapable of binding AMOT,23 rescues clonal expansion and soft agar colony formation in YAP1 KD OSC cells (Fig 3B and C). QPCR analysis revealed that YAP1 KD decreased expression of the YAP1 target genes CYR61, ANKRD1 and CTGF while having no effect on PKCι or MMP10 expression (Fig 3D). As expected, expression of either wild-type YAP1 or WW mutant YAP1 restored expression of these YAP1 target genes (Fig 3D).
Figure 3. YAP1 is required for transformed growth of OSC cells.
A. Immunoblot analysis of NT, and YAP1 KD OSC cells expressing either control vector (V), wild-type YAP1 (WT) or a constitutive active WW domain YAP1 mutant (WW) for YAP1. Actin serves as a control for loading. B. Effect of YAP1 KD and reconstitution with WT or WW mutant YAP1 on soft agar colony formation. Results are expressed as % NT control +/−SEM. N=5. *p<0.05 compared to NT; **p<0.05 compared to YAP1 KD. C. Effect of YAP1 KD and reconstitution with WT or WW mutant YAP1 on clonal expansion. Results are expressed as % clonal expansion. *p<0.05 compared to NT; **p<0.05 compared to YAP1 KD by Chi-square analysis. N=25 (OVCAR3) and 30 (OAW28). D. QPCR analysis for expression of YAP1, CYR61, ANKRD1, CTGF and MMP10. Results expressed as % NT control. N=3. *p<0.05 compared to NT; **p<0.05 compared to YAP1 KD.
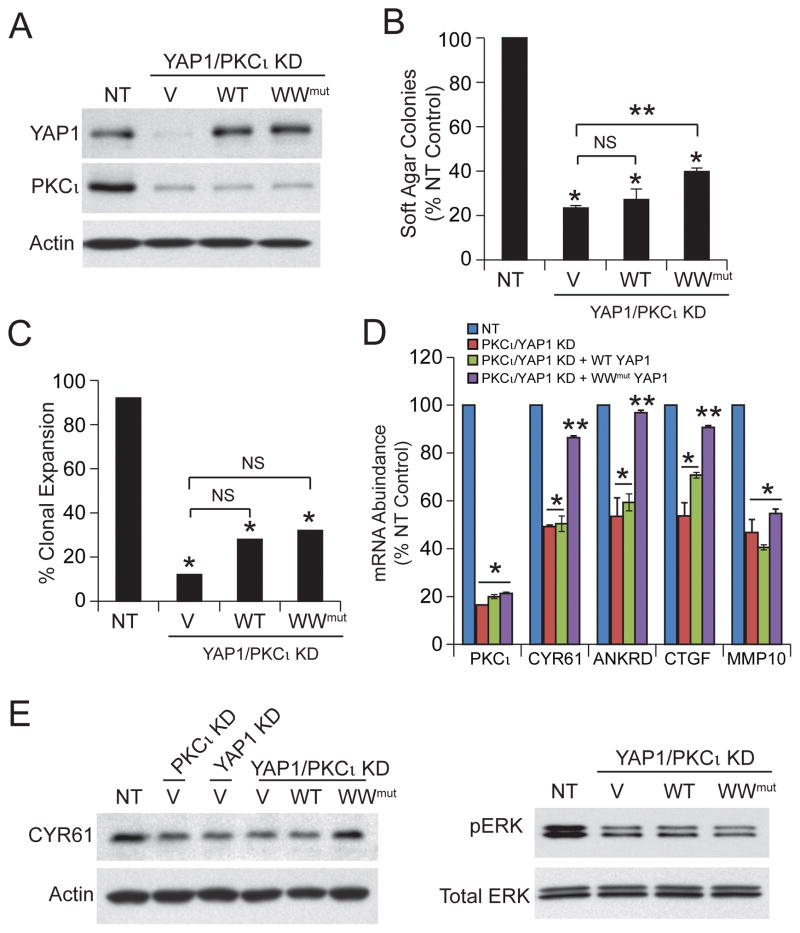
Our data demonstrate that PKCι-regulated nuclear YAP1 activity is necessary for transformed growth of OSC cells. To assess whether YAP1 is sufficient downstream of PKCι to maintain transformed growth we knocked down PKCι in YAP1 KD OVCAR3 cells (PKCι/YAP1 KD), and then expressed wild-type YAP1, WW mutant YAP1 or an empty control vector in these cells (Fig 4A). As expected, PKCι/YAP1 KD cells exhibited significantly decreased clonal expansion (Fig 4B) and soft agar colony formation (Fig 4C). Expression of wild-type YAP1 was unable to rescue soft agar growth or clonal expansion, whereas constitutively active WW mutant YAP1 led to a partial rescue of these phenotypes. These results are not surprising since PKCι also activates a MEK-ERK-MMP10 signaling axis which, like PKCι-mediated YAP1 activation, is necessary for transformed growth of OSC cells.4 QPCR revealed that PKCι KD inhibits expression of CYR61, ANKRD1, CTGF and MMP10, whereas YAP1 KD inhibits CTGF, ANKRD1 and CYR61 but not MMP10 (Fig 4D). Interestingly, expression of exogenous WW mutant YAP1, but not wild-type YAP1, in PKCι/YAP1 KD cells restores expression of CYR61, ANKRD1, and CTGF; furthermore, neither YAP1 allele restores expression of MMP10 (Fig 4D). Immunoblot analysis confirmed that PKCι/YAP1 KD inhibits expression of CYR61 which is restored by the WW mutant YAP1 (Fig 4E, upper panels). PKCι/YAP1 KD also led to inhibition of phospho-ERK, a biomarker PKCι-MEK-ERK-MMP10 signaling; however, pERK levels were not restored by expression of either wild-type YAP1 or WW mutant YAP1 (Fig 4E, lower panels). Taken together, these data demonstrate that YAP1 is a critical PKCι target that is necessary but not sufficient to completely confer PKCι-mediated transformed growth of OSC cells.
Figure 4. YAP1 is necessary but not sufficient for PKCι-dependent growth of OSC cells.
A. Immunoblot analysis of NT and PKCι/YAP1 KD expressing control vector (V), wild-type YAP1 (WT) or WW domain YAP1 mutant (WW) OVCAR3 cells for YAP1 and PKCι expression. Actin serves as a loading control. Effect of YAP1 KD, PKCι/YAP1 KD and expression of exogenous wild-type YAP1 and WW YAP1 mutant on soft agar colony formation (B) and clonal expansion (C) of OSC cells. Results are expressed as described in Fig. 3. NS=not significant. D. QPCR analysis for expression of PKCι, CYR61, ANKRD1, CTGF and MMP10. Results are as described in Fig. 3. E. Immunoblot analysis for expression of CYR61 (left panel). Actin is used as a loading control. Immunoblot analysis for expression of phospho-ERK (right panel). Total ERK is used as a loading control. Results are representative of two independent experiments.
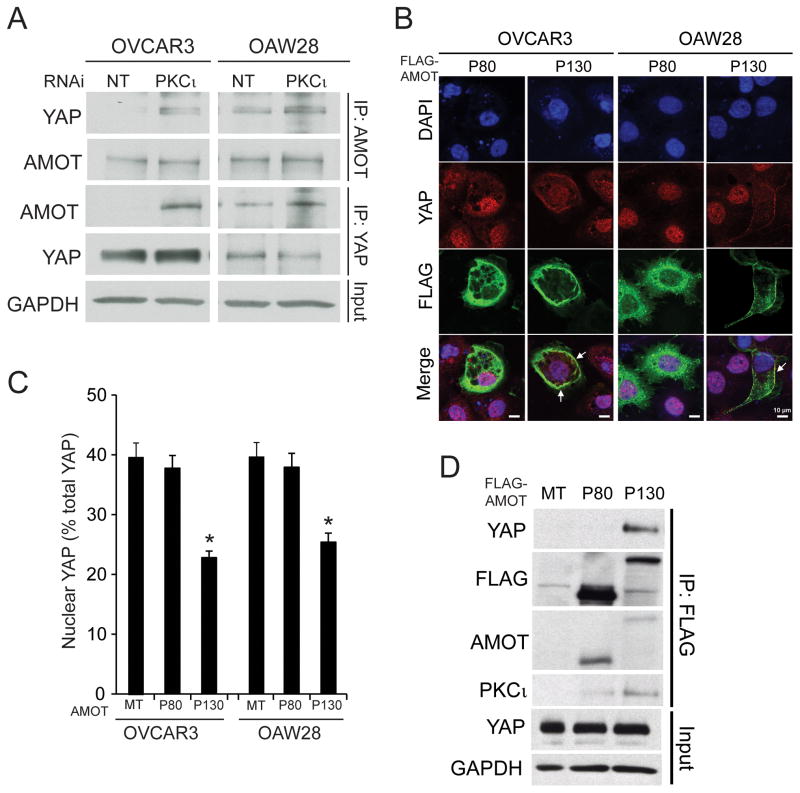
Forced overexpression of aPKC in Madin-Darby canine kidney (MDCK) epithelial cells can induce morphological transformation by suppressing AMOT expression.16 Therefore, we explored the role of AMOT in PKCι-dependent YAP1 activity. Immunoprecipitation and immunoblot analysis reveals that OSC cells express low, but detectable, levels of the 130 kD AMOT isoform (AMOT130) that are not altered appreciably by PKCι KD (Fig 5A, upper panels). However, PKCι KD cells exhibit a demonstrable increase in YAP1 bound to AMOT130 when compared to NT cells (Fig 5A, upper panels). Reciprocal immunoprecipitation-immunoblot analysis using YAP1 antibody confirmed the enhanced binding of AMOT130 and YAP1 in PKCι KD cells (Fig 5A, lower panels). The increase in AMOT130-bound YAP1 was not a result of increased YAP1 expression since NT and PKCι KD cells express similar amounts of total YAP1. Thus, PKCι modulates binding of YAP1 to AMOT130.
Figure 5. PKCι modulates binding between YAP1 and AMOT130.
A. NT and PKCι KD OVCAR3 and OAW28 cells were subjected to immunoprecipitation using AMOT (upper panels) or YAP1 (lower panels) antibody followed by immunoblot analysis for AMOT and YAP1. GAPDH immunoblot of input served as a loading control. B. OVCAR3 and OAW28 cells were transiently transfected with either FLAG-AMOT80 (P80) or FLAG-AMOT130 (P130) and subjected to immunofluorescence analysis for YAP1 (red) and FLAG-AMOT (green). DAPI was used to identify nuclei (blue). Expression of AMOT130 induced loss of nuclear YAP1 and co-localization of YAP1 and AMOT in the cell periphery (arrows). C. Quantification of nuclear YAP1 immunofluorescence. OVCAR3 and OAW28 cells transfected with AMOT80 or AMOT130 as in B. were subjected to quantitative analysis of the YAP1 staining as described in Materials and Methods. MT= empty control vector. D. YAP1 binds to AMOT130 but not AMOT80. FLAG antibody immunoprecipitates from OVCAR3 and OAW28 cells transfected with FLAG-AMOT80 and FLAG-AMOT130 were subjected to immunoblot analysis for YAP1, FLAG, AMOT and PKCι. YAP1 and GAPDH immunoblot in input lysates serve as loading controls.
We next assessed the effect of AMOT on nuclear YAP1 localization. Expression of FLAG-tagged AMOT130 significantly decreased nuclear YAP1 and induced co-localization of FLAG-AMOT130 and YAP1 at the cell membrane of OSC cells (Figure 5B). Quantitative analysis revealed a significant decrease in nuclear YAP1 in AMOT130-expressing cells (Fig. 5C). The effect of AMOT130 on nuclear YAP1 was specific since only cells expressing Flag-tagged AMOT130 exhibited decreased nuclear YAP1 staining. Interestingly, expression of the 80 kDa form of AMOT (AMOT80), which does not bind YAP1,24 had no demonstrable effect on nuclear YAP1 (Fig 5B and C). Finally, FLAG immunoprecipitation revealed that AMOT130 binds YAP1 whereas AMOT80 does not (Fig 5D) consistent with published reports.24 Interestingly, we also detected PKCι in AMOT130 but not AMOT80 immunoprecipitates, suggesting that PKCι can associate with AMOT130 (Fig. 5D).
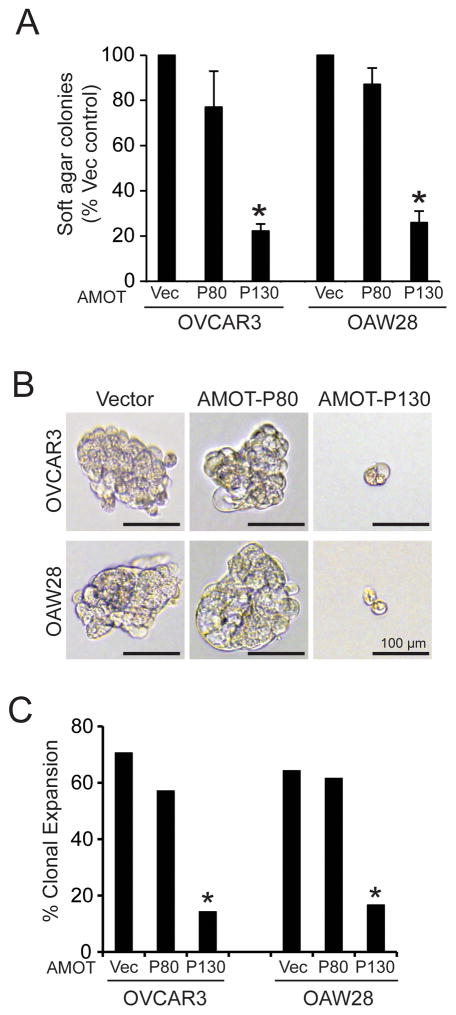
Since AMOT130, like PKCι KD, inhibits nuclear YAP1 localization, we next assessed the effect of AMOT130 on transformed growth. Expression of AMOT130, but not AMOT80, led to significant inhibition of soft agar colony formation (Fig 6A), oncosphere growth (Fig 6B) and clonal expansion (Fig 6C) of OSC cells. Therefore, AMOT130, but not AMOT80, can phenocopy the biochemical and cellular effects of PKCι KD.
Figure 6. AMOT130 but not AMOT80 inhibits transformed growth of OSC cells.
A. OVCAR3 and OAW28 OSC cells transfected with FLAG-AMOT80, FLAG-AMOT130 or empty control vector (Vec) were plated in soft agar and assessed for soft agar colony formation. Results represent % vector control +/− SEM. N=3. *p<0.05 compared to vector control. B. Effect of FLAG-AMOT130 and FLAG-AMOT80 on growth of OSC cells in non-adherent oncosphere culture. OVCAR3 and OAW28 transfectants expressing FLAG-AMOT80, FLAG-AMOT130 or empty control vector were grown in oncosphere culture. Micrographs show representative colonies. C. Quantitative analysis of clonal expansion efficiency of OVCAR3 and OAW28 transfectants expressing FLAG-AMOT80, FLAG-AMOT130 or empty control vector. Results represent clonal expansion expressed as percent of total cells expanding. *p<0.05 compared to control vector cells using Chi-square analysis.
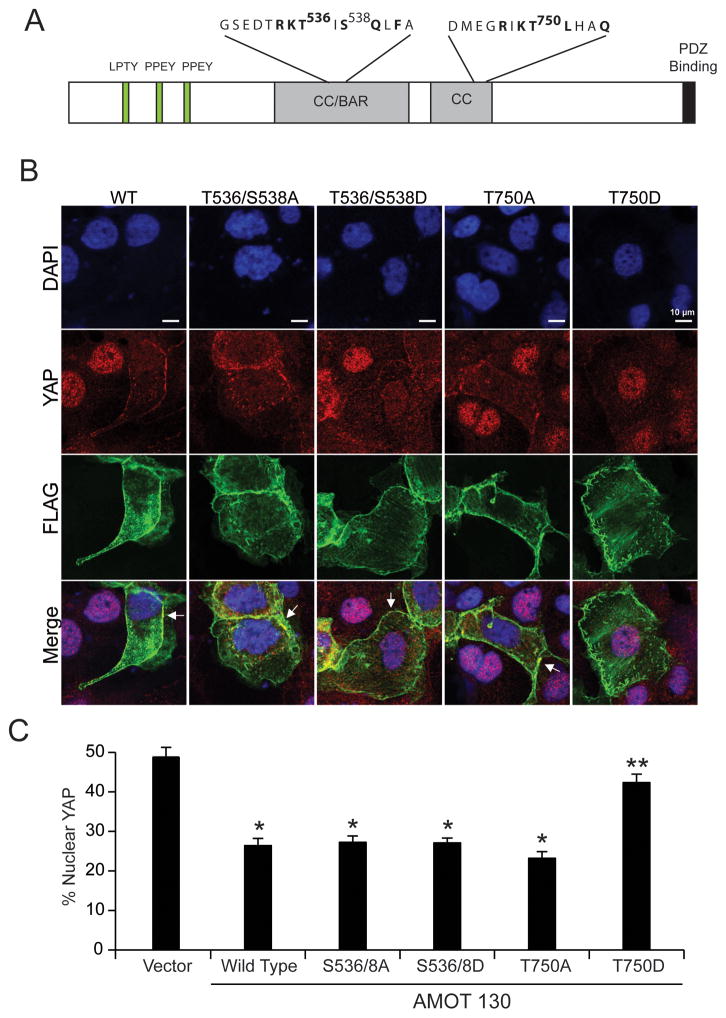
Since PKCι co-immunoprecipitates with AMOT130 and regulates YAP1 binding to AMOT130, we next assessed whether PKCι phosphorylates AMOT130. Recombinant PKCι and AMOT were combined in a PKCι kinase assay, followed by mass spectrometry to identify potential PKCι-mediated phosphorylation sites. Analysis revealed three phosphorylated sites on PKCι-phosphorylated AMOT, Thr536, Ser538 and Thr750 (Fig 7A), that were not detected in AMOT in the absence of PKCι. To assess the functional role of these phosphorylation sites, we generated Flag-tagged AMOT130 mutants in which both T536 and S538, or T750, were mutagenized to alanine to ablate phosphorylation (T536/S538A and T750A), or aspartic acid to mimic phosphorylation (T536/538D and T750D). AMOT130 mutants, as well as wild-type AMOT130, were expressed in OSC cells and assessed for localization of Flag-AMOT and YAP1 (Fig 7B). As expected, expression of WT AMOT130 induced a loss of nuclear YAP1 (Figure 7B, left panels). Interestingly, T536A/S538A, T536D/S538D and T750A AMOT130 mutants induced loss of nuclear YAP1 indistinguishable from wild-type AMOT130 (Figure 7B, middle three panels). In cells expressing these AMOT130 mutants, YAP1 co-localized with Flag-AMOT130 at the cell periphery. In contrast, expression of T750D AMOT130 failed to induce loss of nuclear YAP1 (Fig 7B, right panels). Quantitative analysis confirmed significant loss of nuclear YAP1 in cells expressing WT, S536/T538A, S536/T538D and T750A AMOT mutants, and the continued presence of nuclear YAP1 in cells expressing the T750D AMOT mutant (Fig 7C). Thus, PKCι-mediated phosphorylation of AMOT130 at T750 modulates nuclear YAP1 localization.
Figure 7. PKCι-mediated phosphorylation of AMOT regulates YAP1 nuclear localization.
A. Schematic diagram showing the structure of AMOT130 including the identified PKCι phosphorylation sites T536, S538 and T750. B. PKCι-mediated T750 AMOT phosphorylation modulates nuclear YAP1. OAW28 cells transfected with FLAG-tagged WT AMOT130, T536/S538A AMOT130, T536/S538D AMOT130, T750A AMOT130 or T750D AMOT130 were subjected to immunofluorescence detection of FLAG-AMOT (green), YAP1 (red) and nuclei (DAPI;blue). Arrows indicate the co-localization of YAP1 and FLAG-tagged AMOT at the cellular periphery. C. Quantitative analysis of nuclear YAP1 immunofluorescence. Results expressed as % nuclear YAP1 +/− SEM. *p<0.05 compared to control vector. **p<0.05 compared to wild-type AMOT130.
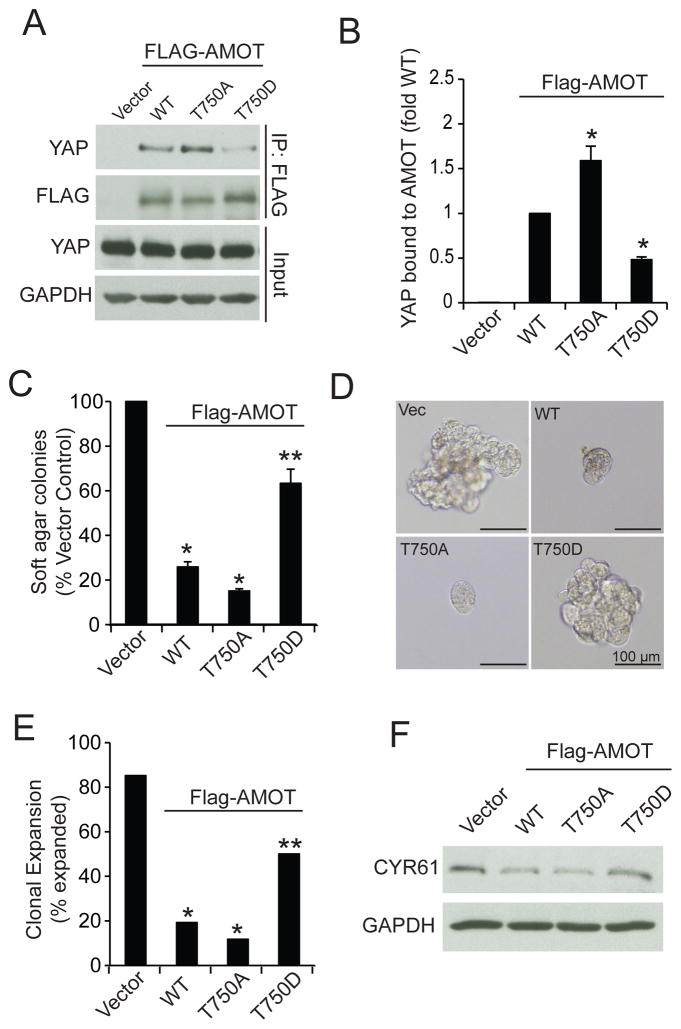
We next determined the effect of PKCι-mediated T750 phosphorylation on AMOT-YAP1 binding and transformed growth. Immunoprecipitation of WT, T750A and T750D AMOT130 followed by immunoblot analysis for YAP1 revealed that whereas all three AMOT130 alleles bound YAP1, T750A AMOT130 bound significantly more YAP1, and T750D AMOT130 bound significantly less YAP1, than WT AMOT130 (Fig. 8A and B). Consistent with these results, expression of either WT or T750A AMOT130 significantly inhibited soft agar colony formation (Fig. 8C) and oncosphere growth (Fig. 8D and E), but T750D AMOT130 was much less effective. Immunoblot analysis demonstrated that both WT and T750A AMOT130 inhibited CYR61 expression whereas T750D AMOT did not (Fig. 8F). Thus, PKCι-mediated T750 AMOT130 phosphorylation inhibits YAP1 binding, induces nuclear YAP1 localization and activity, and promotes YAP1-dependent transformed growth.
Figure 8. PKCι-mediated phosphorylation regulates AMOT130 binding to YAP1 and transformed growth of OSC cells.
A. OAW28 cells transfected with Flag-tagged WT-AMOT130, T750A AMOT130, T750D-AMOT130 or empty vector were subjected to immunoprecipitation using FLAG antibody followed by immunoblot analysis for YAP1 and FLAG. YAP1 and GAPDH immunoblot of input served as loading control. B. Quantitative analysis of binding of YAP1 to AMOT mutants. Results represent YAP1 bound to the indicated AMOT mutant expressed as fold of YAP1 bound to WT-AMOT. Data represent the mean +/− SEM. N=3. *p<0.05 compared to WT. C. Soft agar colony formation in OAW28 cells transfected with the indicated expression vector. Results are expressed as percent of vector control and represent the mean +/− SEM. N=3. *p<0.05 compared to vector. **p<0.05 compared to WT. D. Effect of AMOT130 mutants on clonal expansion of OAW28 cells in non-adherent culture. Representative micrographs are shown. E. Quantitative analysis of clonal expansion of OAW28 cell transfectants. Results are expressed as percent of total cells expanded. *p<0.05 compared to Vector control. **p<0.05 compared to WT using Chi-square analysis. F. Immunoblot analysis of OAW28 cell transfectants for CYR61. GAPDH serves as a loading control.
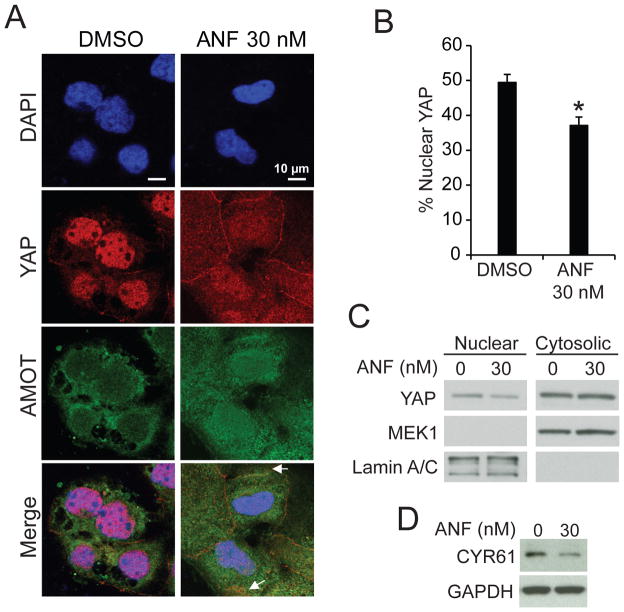
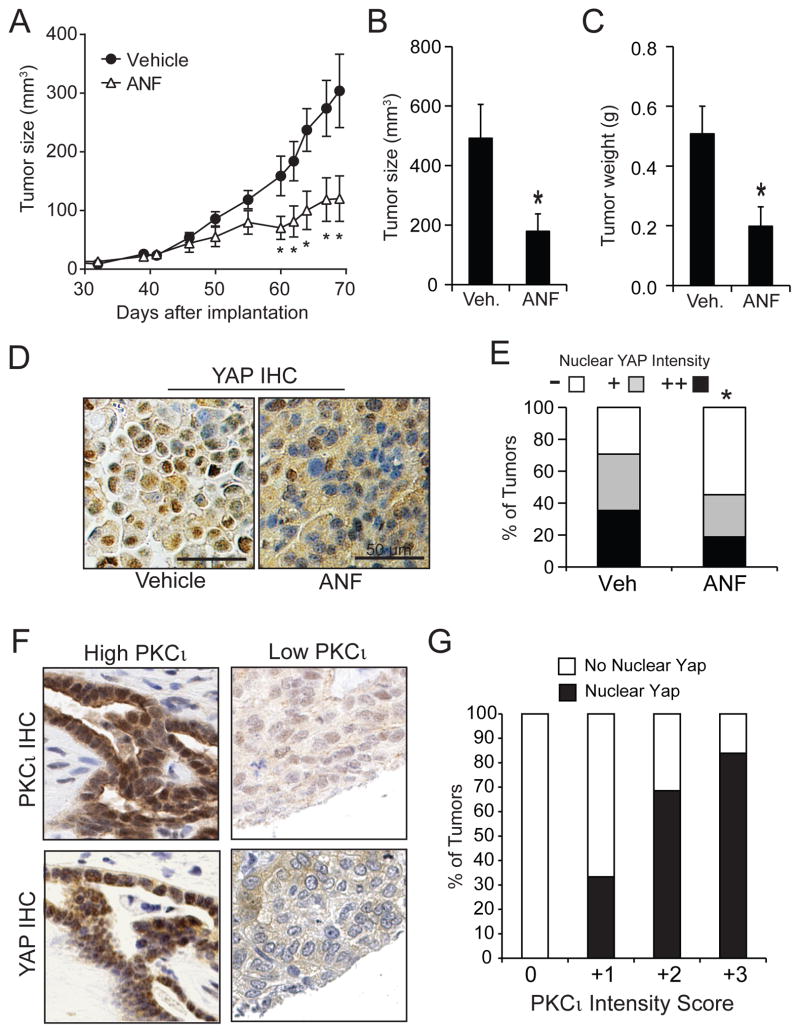
We next assessed whether pharmacologic inhibition of PKCι induces a similar loss of nuclear YAP1 and inhibition of YAP1 signaling. Treatment of OSC cells with auranofin (ANF), which inhibits PKCι signaling,4, 25 induced loss of nuclear YAP1 (Fig. 9A). Quantitative analysis revealed significant loss of nuclear YAP1 in ANF-treated cells (Fig. 9B) that was confirmed by immunoblot analysis (Fig. 9C). ANF-induced loss of nuclear YAP1 led to inhibition of expression of the YAP1 transcriptional target CYR61 (Fig. 9D). We next assessed the ability of ANF to block PKCι-AMOT130-YAP1 signaling and inhibit OSC tumor growth in vivo (Fig 10). OVCAR3 cells were implanted subcutaneously into the flanks of nude mice and allowed to grow until tumors were palpable (10 mm3; 32 days). Tumor-bearing mice were randomly divided into two treatment groups receiving either ANF (12 mg/kg/daily) or diluent. The ANF-treated group exhibited a significant and sustained reduction in tumor growth over the 5 week treatment period (Fig. 10A). Quantitative analysis demonstrated that ANF treatment significantly decreased tumor size (Fig. 10B) and tumor burden (Fig. 10C) when compared to the saline-treated control group. Immunohistochemical analysis revealed decreased nuclear YAP1 staining intensity in ANF-treated tumors compared to diluent-treated tumors (Fig. 10D and E).
Figure 9. Auranofin decreases nuclear YAP1.
A. Immunofluorescence analysis of OAW28 cells treated with ANF (30 nM) or diluent (DMSO) for YAP1 (red) and AMOT (green). Arrows indicate co-localization of YAP1 and AMOT at the cellular periphery in ANF-treated cells. B. Quantitative analysis of immunofluorescence for nuclear YAP1. Results are presented as percent nuclear YAP1 +/− SEM. *p<0.05 compared to DMSO. C. Immunoblot analysis of cytoplasmic and nuclear fractions from DMSO and ANF-treated OAW28 cells for YAP1. MEK1 and lamin A/C serve as markers of cytoplasm and nucleus respectively. D. Immunoblot analysis of lysates from DMSO and ANF-treated OAW28 cells for CYR61. GAPDH serves as a loading control.
Figure 10. ANF inhibits OSC tumor growth and nuclear YAP1 in vivo.
A. Growth of OSC tumors is inhibited by ANF. OVCAR3 cells were injected subcutaneously into the flanks of immuno-deficient mice and allowed to establish palpable tumors as described in Materials and Methods. Beginning on day 32, tumor-bearing animals were randomly divided into two groups receiving either ANF (12 mg/kg) or saline daily. Tumor size was monitored by caliper measurements as described. Tumor size (B) and weight (C) were determined at the time of sacrifice (day 68). Results represent mean +/−SEM. N=12. *p<0.05 compared to vehicle control. D. Immunohistochemistry for YAP1 of representative tumors from DMSO and ANF-treated mice. E. Quantitative analysis of YAP1 immunohistochemistry was conducted as described in Materials and Methods. *p<0.05 compared to DMSO-treated tumors using Chi-Square analysis. F. Immunohistochemistry for YAP1 and PKCι from representative primary OPSC tumors. G. Analysis of IHC of primary OSC tumors for PKCι and YAP1 reveals a positive correlation between PKCι expression and nuclear YAP1.
We next assessed whether PKCι-YAP1 signaling is relevant to primary OSC tumors. Serial sections of primary OSC tumor tissue microarrays (TMAs) were subjected to immunohistochemical staining for PKCι and YAP1. We observed that tumors exhibiting high PKCι expression also exhibited strong nuclear YAP1 staining, whereas those with low PKCι expression exhibited low nuclear YAP1 (Figure 10F). Quantitative analysis of 82 analyzable cases revealed a strong positive correlation between PKCι expression and nuclear YAP1 in primary OSC tumors (Figure 10G). Taken together, these data indicate that PKCι-YAP1 signaling is relevant to primary OSC tumors and that this pathway can be pharmacologically targeted for therapeutic effect.
DISCUSSION
Ovarian cancer is the fifth leading cause of cancer death in women and the deadliest gynecological cancer.1 The cure rate for ovarian cancer has not changed appreciably in the past forty years, underscoring the need for better treatment strategies.26 Ovarian serous carcinoma (OSC) is the most common subtype of ovarian cancer, accounting for some 90% of ovarian cancer cases. OSC is characterized by a poor five year survival rate due to late detection and poor clinical response.26 OSC is often responsive to initial platinum-based chemotherapy, but relapse with therapy-resistant disease is common.27 Therefore, there is a need for increased understanding of signaling mechanisms that drive OSC tumor behaviors that can be translated into novel therapeutic intervention approaches.
A major genetic risk factor for ovarian cancer is germline mutation of the BRCA1 or BRCA2 DNA mismatch repair genes which is present in 10% of ovarian cancer cases.28 However, there are few oncogenes known to be frequently activated in sporadic OSC. One of the most frequent genetic alterations in OSC is copy number gain (CNG) at chromosome 3q26.5, 29–31 PRKCI resides at 3q26 and is a major target of oncogenic activation associated with chromosome 3q26 CNGs.3, 32 PRKCI CNG is associated with elevated expression, activity and mis-localization of PKCι in OSC tissues.6, 7, 11, 33 PRKCI CNGs are associated with poor therapeutic response, high relapse and poor overall survival.6
We and others have previously demonstrated that PKCι is required for the growth of OSC cells in vitro and OSC tumorigenesis in vivo.6, 7 However, the molecular mechanism(s) by which PKCι drives OSC cell behaviors has not been extensively studied. PRKCI CNG is among the most common observed CNG events in human cancers, estimated to be present in some 30% of human tumors.5 Like OSC, lung squamous cell carcinoma (LSCC) harbors frequent PRKCI CNGs.3 In LSCC, PRKCI CNG induces PKCι expression and establishes a novel PKCι-dependent hedgehog (Hh) signaling axis that drives a highly aggressive tumor-initiating phenotype.3 Therefore, we hypothesized that OSC cells harboring PRKCI CNG would manifest a similar oncogenic signaling axis. Surprisingly, we find that PRKCI CNG does not activate Hh signaling in OSC but rather establishes a novel PKCι-AMOT-YAP1 signaling axis.
Atypical PKCs have previously been implicated in YAP1 signaling. In MDCK cells, aPKCs appear to regulate AMOT expression. It has been postulated that aPKC-mediated suppression of AMOT expression causes the morphological transformation of MDCK cells.16 Consistent with a possible role as a tumor suppressor, AMOT levels in many human cancers, including OSC, are quite low but detectable. Interestingly, our findings unmask another novel mechanism by which PKCι impinges on AMOT signaling in OSC cells. Specifically, PKCι directly phosphorylates AMOT130 to inhibit YAP1 binding while having no demonstrable effect on AMOT130 expression. Our data also demonstrate that whereas AMOT130 levels are low in OSC cells, they are sufficient to exert an inhibitory effect on YAP1 signaling that is modulated by PKCι-mediated phosphorylation. Our data indicate a specific role for PKCι-mediated T750 AMOT130 phosphorylation in YAP1 regulation; however, we identified several other PKCι-mediated phosphorylation sites (T536 and S538) on AMOT130. Though our data do not support a role for these phosphorylation events in AMOT130-YAP1 interactions, these additional phosphorylation sites may regulate other aspects of AMOT130 function. Furthermore, since the PKCι phosphorylation sites on AMOT130 are also present on AMOT80, it is possible that PKCι phosphorylation could also regulate AMOT80 function.
In intestinal epithelial cells, PKCζ, which is closely related to PKCι, has been reported to phosphorylate YAP1 and suppress YAP1 nuclear localization,22 suggesting a growth suppressive role for PKCζ in the intestine. It is well-established that PKCζ and PKCι are non-redundant enzymes that play distinct, non-overlapping and often opposing roles in human tumorigenesis.25, 33–36 In this regard, OSC tumors exhibit low levels of PKCζ, in stark contrast to PKCι, which is overexpressed as a result of 3q26 CNG. Interestingly, PKCι KD did not alter YAP1 phosphorylation, indicating that direct phosphorylation is not a major mechanism by which PKCι regulates YAP1 nuclear function in OSC cells.
OSC is difficult to treat, and new therapeutic strategies are needed to improve the outlook for patients diagnosed with this deadly disease. Our data establish a novel PKCι-AMOT-YAP1 signaling pathway that drives OSC tumorigenesis and is active in primary OSC tumors. Our finding that ANF, a compound that inhibits oncogenic PKCι signaling,3, 4, 8, 25, 34 blocks PKCι-YAP1 signaling and inhibits OSC growth in vitro and OSC tumorigenesis in vivo suggests a plausible therapeutic intervention strategy for treatment of OSC. In this regard, we have observed preliminary clinical activity of ANF in ovarian cancer patients in a maintenance setting.37 Our current results indicate that ANF may be of particular utility in the ~80% of OSC tumors harboring PRKCI CNGs, elevated PKCι, and activation of PKCι-AMOT-YAP1 signaling.
MATERIALS AND METHODS
Cell lines, Antibodies and QPCR
The human OVCAR3 and OAW28 ovarian serous cancer (OSC) cell lines were obtained from the American Type Culture Collection and Sigma-Aldrich, respectively. The cells were cultured as suggested by the suppliers. Cell lines were authenticated by STR profiling and tested negative for mycoplasma contamination. The following antibodies were used in this study: PKCι, YAP1, GAPDH, Actin, Lamin A/C and MEK1 (Cell Signaling, Danvers, MA, USA); AMOT (Abnova); CYR61, and FLAG (Sigma-Aldrich, St Louis, MO, USA). Expression of PKCι, CYR61, ANKRD, CTGF, MMP10 and GLI1 mRNA was assessed by QPCR using the primer probe sets obtained from Applied Biosystems (Foster City, CA, USA).
FISH analysis of OSC cell lines
FISH analysis for chromosome 3q26 copy number gains (CNGs) was performed on formalin-fixed, paraffin embedded xenograft OAW28 and OVCAR3 tumors essentially as described.38 DNA probes targeting chromosome 3q26 (clones RP11-1148M8, RP11-1012L11, CTD-2316F21 and RP11-994L2) were labeled with SpectrumGreen dUTP (Abbott Molecular/Vysis Products), and a probe targeting the chromosome 3 centromere (D3Z1) was labeled in SpectrumOrange (Abbott Molecular/Vysis Products). Following hybridization, slides were stained with 4′-6,-diamidino-2-phenylindole (DAPI) (Vector Laboratories) and coverslipped. The FISH signals were detected by fluorescence microscopy and pictures were captured using a FISH imaging system (Leica Biosystems, Buffalo Grove, IL, USA). At least 50 qualifying tumor nuclei were scored for each sample.
Lentiviral RNAi constructs and Cell Transduction
Lentiviral vector containing RNAi sequence against human PKCι (Target Sequence: GCCTGGATACAATTAACCATT) and YAP1 (Target Sequence: CCCAGTTAAATGTTCACCAAT) were obtained from the Sigma-Aldrich Mission shRNA library and packaged into lentiviruses as described previously.39 A lentiviral vector containing a short hairpin RNAi (shRNA) which recognizes no human genes was used as a non-target control (NT-RNAi). RNAi infections were performed as described previously.39 PKCι and YAP1 shRNA constructs were validated for specificity and efficiency as described previously.39 Transduced cells were cultured in media containing 5 mg/ml of puromycin to select of stably transduced cell populations as described previously.39 PKCι and YAP1 expression was determined by immunoblot analysis as described previously.10
Anchorage-independent growth and clonal expansion assay
Anchorage-independent growth and clonal expansion efficiency was assessed as described previously.4 Briefly, cells (1 × 10⁵) were plated in soft agar and cultured for 2–3 weeks. Cultures were stained with Giemsa (EMD Chemicals), and colony formation was quantified using ImageJ as described previously.3 All experiments were independently repeated at least three times. Statistical significance between groups was assessed using a two-sided T-test. Clonal expansion was assessed by plating single cells into individual wells of 96-well ultra-low attachment plates and monitoring oncosphere formation by phase contrast microscopy for 15 days. The percentage of cells that clonally expanded was compared across groups by Chi-square analysis.
Expression Plasmids, Site-directed Mutagenesis and Transfections
A full length human AMOT130 cDNA was obtained from Addgene (Cambridge, Massachusetts, USA) (plasmid #32821). The AMOT130 cDNA was cloned by restriction digest (BamHI and XhoI) into pCMV 3Tag vector (Stratagene) to generate a FLAG-tagged AMOT130 fusion vector. Forward primer (BamHI) and Reverse primer (XhoI) were used to PCR clone AMOT80 coding sequence from this AMOT130 plasmid. The BamHI-XhoI PCR fragment was cloned into pCMV 3Tag vector (Stratagene) to generate a FLAG-tagged AMOT80 fusion vector. pCMV 3Tag AMOT130 was used as template for site-directed mutagenesis to generate AMOT130 cDNAs in which both Thr536 and Ser538 were mutagenized to alanines (T536A/S538A) or aspartic acid (T536D/S538D), or in which Thr750 was mutagenized to alanine (T750A) or aspartic acid (T750D). The mutagenized AMOT130 cDNAs were confirmed by sequencing. Expression plasmids containing full length human wildtype (cat# 18881) and WW mutant (cat# 17792) YAP1 were obtained from Addgene. Forward BamHI containing primers and reverse EcoRI containing primers were used to PCR clone wildtype and WW mutant YAP1 cDNAs into the BamHI/EcoRI sites of pCMV 3Tag FLAG vector. The pCMV-Tag2B-PKCι expression plasmid used was previously described.39 PKCι, AMOT and YAP1 expression plasmids were transfected into OAW28 and OVCAR3 cells using Lipofectamine 2000 (Invitrogen) according to the manufacturer’s instructions. Expression of PKCι, AMOT and YAP1 was assessed by immunoblot and/or immunofluorescence analysis using PKCι, AMOT and YAP1 antibodies respectively and exogenous Flag-AMOT constructs using Flag antibody.
Mass spectrometry analysis of AMOT phosphorylation
Recombinant PKCι (Millipore, Danvers, MA) and recombinant AMOT (Novus Biologicals, Littleton, CO) were combined in a PKCι in vitro kinase assay as previously described.40 PKCι-phosphorylated AMOT was resolved by SDS-PAGE, visualized by silver staining, excised and prepared for mass spectrometry analysis as described previously.40 All protein identifications were considered confirmed when individual peptide scores were above the 95% percentile for probability and rank number one of all the hits for the respective MS/MS spectra. The identified phosphorylation site on phosphorylated peptides was manually validated.
Immunofluorescence imaging by confocal microscopy
Cells (1 × 10⁵) were seeded on cover slips (round, 15mm diameter) pre-coated by Poly-L-Lysine (Sigma-Aldrich) and incubated at 37°C overnight in growth media. The cells were washed twice with PBS and fixed with 4% paraformaldehyde (diluted from 16% paraformaldehyde, Electron Microscopy Sciences) for 15 min at room temperature. Cover slips were washed twice with PBS, incubated in blocking solution (PBS containing 5% BSA) for 1 hour and then with primary antibodies in PBS containing 1% BSA (FLAG antibody 1:50; YAP1 antibody 1:50) for 1 hour at 37°C. Cover slips were washed twice for 5 min in PBS, and incubated with secondary antibodies in PBS containing 1% BSA (Alexa Fluor 488, #A11001 and Alexa Fluor 594, #R37117 from Thermo Fisher Scientific, 1:300) for 1 hour at 37°C in a humidified chamber in the dark. After incubation, the coverslips were washed 3 times for 5 min with PBS and rinsed with water before mounting in Prolong Gold Antifade Mountant with DAPI (Thermo Fisher Scientific). The coverslips sealed with clear nail polish before confocal microscopy. Images were captured, processed and total and nuclear YAP1 was quantified using ImageJ software (NIH).
Tumor Growth and Drug Responses
OVCAR3 cells (5 × 10⁶ cells/100 μL in 50% Matrigel) were injected into the flanks of 6–8 week old female nude mice (Harlan-Sprague-Dawley, Indianapolis, IN) and assessed for tumor formation and growth as previously described.4 Tumors were allowed to engraft and grow to an average volume of ~10 mm3 as determined by caliper measurements (32 days post injection) as previously described.10 Tumor-bearing mice were randomly assigned to receive either auranofin (ANF) (12 mg/kg body weight in saline) or saline daily by intraperitoneal injection. A sample size of 12 mice/treatment group was chosen as sufficient to provide statistic power to detect a 2 fold increase (or 50% reduction) in tumor size and tumor burden based on similar published experiments.9 After the five week treatment period, tumor-bearing mice were sacrificed and tumors were excised, weighed, measured by caliper measurement ex vivo. Tumor tissues were formalin-fixed, paraffin-embedded and subjected to immunohistochemical staining for Yap1. Nuclear Yap1 intensity was scored (−; no nuclear staining; + light nuclear staining; ++ dark nuclear staining) using a standard curve representing the full range of staining intensities. The scorer was blinded to the treatment group of individual samples. All animal experiments were approved by the Mayo Clinic Institutional Animal Care and Use Committee.
Immunohistochemical Analysis of Primary OSC
Serial sections from tissue microarrays (TMAs) containing core biopsy samples from 100 unique tumors from patients diagnosed with OSC were subjected to immunohistochemistry for PKCι and YAP1 essentially as described previously.2 PKCι staining intensity was scored on a scale of 0, +1, +2 and +3 using a standard curve representing the full spectrum of staining intensities. YAP1 nuclear staining was scored as either positive or negative for each sample based on whether nuclear staining was more intense than the surrounding cytoplasmic staining. A total of 82 of the 100 independent tumors were evaluable for both PKCι and YAP1 staining.
Statistical Analysis
Comparison of soft agar colony formation, mRNA abundance, tumor size or tumor burden between groups was performed using a two-tailed Student’s t-test (SigmaPlot 12). P<0.05 was considered statistically significant. Differences in clonal expansion were assessed using Chi-square analysis. All experiments were repeated independently at least two times (biological replicates) as indicated in the Figure Legends. The sample size for each experiment is listed in the Figure Legends. For the animal study, 12 mice per group was chosen as the sample size to ensure >80% power with 95% confidence based on published experiments of similar design.9 All data passed tests for normality (Shapiro-Wilk) and equal variance. Data analysis was performed in a blinded manner.
Acknowledgments
The authors wish to thank Dr. Kim Kalli and the Mayo Clinic Ovarian SPORE Tissue shared resource for ovarian cancer tissue microarrays, The Mayo Clinic Cytogenetics Core for FISH analysis, Ms. Brandy Edenfield for tissue processing and immunohistochemical staining, and Kayla Lewis, Capella Weems and Dr. Christelle Colin Cassin for technical assistance. This research was supported by the Mayo Clinic Specialized Program in Research Excellence (SPORE) grant CA136393 from the National Institutes of Health (A.P.F. is a Project Leader on this grant), a post-doctoral fellowship award from the Ovarian Cancer Research Fund to Y.W., National Cancer Institute grants R21 CA204938-01 (V.J.) and R01 CA081436-18 (A.P.F.), and the George Haub Family Career Development Award (V.J.). A.P.F. is the Monica Flynn Jacoby Professor of Cancer Research, an endowment fund that provides partial support for his research program.
Footnotes
CONFLICT OF INTEREST
The authors declare that they have no conflicts of interest to disclose.
References
- 1.Siegel RL, Miller KD, Jemal A. Cancer statistics, 2015. CA Cancer J Clin. 2015;65:5–29. doi: 10.3322/caac.21254. [DOI] [PubMed] [Google Scholar]
- 2.Regala RP, Weems C, Jamieson L, Khoor A, Edell ES, Lohse CM, et al. Atypical protein kinase C iota is an oncogene in human non-small cell lung cancer. Cancer Res. 2005;65:8905–8911. doi: 10.1158/0008-5472.CAN-05-2372. [DOI] [PubMed] [Google Scholar]
- 3.Justilien V, Walsh MP, Ali SA, Thompson EA, Murray NR, Fields AP. The PRKCI and SOX2 oncogenes are coamplified and cooperate to activate Hedgehog signaling in lung squamous cell carcinoma. Cancer Cell. 2014;25:139–151. doi: 10.1016/j.ccr.2014.01.008. [DOI] [PMC free article] [PubMed] [Google Scholar]
- 4.Wang Y, Hill KS, Fields AP. PKCiota maintains a tumor-initiating cell phenotype that is required for ovarian tumorigenesis. Mol Cancer Res. 2013;11:1624–1635. doi: 10.1158/1541-7786.MCR-13-0371-T. [DOI] [PMC free article] [PubMed] [Google Scholar]
- 5.Ciriello G, Miller ML, Aksoy BA, Senbabaoglu Y, Schultz N, Sander C. Emerging landscape of oncogenic signatures across human cancers. Nat Genet. 2013;45:1127–1133. doi: 10.1038/ng.2762. [DOI] [PMC free article] [PubMed] [Google Scholar]
- 6.Eder AM, Sui X, Rosen DG, Nolden LK, Cheng KW, Lahad JP, et al. Atypical PKCiota contributes to poor prognosis through loss of apical-basal polarity and cyclin E overexpression in ovarian cancer. Proc Natl Acad Sci U S A. 2005;102:12519–12524. doi: 10.1073/pnas.0505641102. [DOI] [PMC free article] [PubMed] [Google Scholar]
- 7.Zhang L, Huang J, Yang N, Liang S, Barchetti A, Giannakakis A, et al. Integrative genomic analysis of protein kinase C (PKC) family identifies PKCiota as a biomarker and potential oncogene in ovarian carcinoma. Cancer Res. 2006;66:4627–4635. doi: 10.1158/0008-5472.CAN-05-4527. [DOI] [PubMed] [Google Scholar]
- 8.Ali SA, Justilien V, Jamieson L, Murray NR, Fields AP. Protein Kinase Ciota Drives a NOTCH3-dependent Stem-like Phenotype in Mutant KRAS Lung Adenocarcinoma. Cancer Cell. 2016;29:367–378. doi: 10.1016/j.ccell.2016.02.012. [DOI] [PMC free article] [PubMed] [Google Scholar]
- 9.Wang Y, Hill KS, Fields AP. Protein Kinase Ciota maintains a tumor-initiating cell phenotype that is required for ovarian tumorigenesis. Mol Cancer Res. 2013 doi: 10.1158/1541-7786.MCR-13-0371-T. [DOI] [PMC free article] [PubMed] [Google Scholar]
- 10.Regala RP, Weems C, Jamieson L, Copland JA, Thompson EA, Fields AP. Atypical protein kinase Ciota plays a critical role in human lung cancer cell growth and tumorigenicity. J Biol Chem. 2005;280:31109–31115. doi: 10.1074/jbc.M505402200. [DOI] [PubMed] [Google Scholar]
- 11.Murray NR, Kalari KR, Fields AP. Protein kinase Ciota expression and oncogenic signaling mechanisms in cancer. J Cell Physiol. 2011;226:879–887. doi: 10.1002/jcp.22463. [DOI] [PMC free article] [PubMed] [Google Scholar]
- 12.Barretina J, Caponigro G, Stransky N, Venkatesan K, Margolin AA, Kim S, et al. The Cancer Cell Line Encyclopedia enables predictive modelling of anticancer drug sensitivity. Nature. 2012;483:603–607. doi: 10.1038/nature11003. [DOI] [PMC free article] [PubMed] [Google Scholar]
- 13.Domcke S, Sinha R, Levine DA, Sander C, Schultz N. Evaluating cell lines as tumour models by comparison of genomic profiles. Nat Commun. 2013;4:2126. doi: 10.1038/ncomms3126. [DOI] [PMC free article] [PubMed] [Google Scholar]
- 14.Hall CA, Wang R, Miao J, Oliva E, Shen X, Wheeler T, et al. Hippo pathway effector Yap is an ovarian cancer oncogene. Cancer Res. 2010;70:8517–8525. doi: 10.1158/0008-5472.CAN-10-1242. [DOI] [PMC free article] [PubMed] [Google Scholar]
- 15.Zhang X, George J, Deb S, Degoutin JL, Takano EA, Fox SB, et al. The Hippo pathway transcriptional co-activator, YAP, is an ovarian cancer oncogene. Oncogene. 2011;30:2810–2822. doi: 10.1038/onc.2011.8. [DOI] [PubMed] [Google Scholar]
- 16.Archibald A, Al-Masri M, Liew-Spilger A, McCaffrey L. Atypical protein kinase C induces cell transformation by disrupting Hippo/Yap signaling. Mol Biol Cell. 2015;26:3578–3595. doi: 10.1091/mbc.E15-05-0265. [DOI] [PMC free article] [PubMed] [Google Scholar]
- 17.Hsu YL, Hung JY, Chou SH, Huang MS, Tsai MJ, Lin YS, et al. Angiomotin decreases lung cancer progression by sequestering oncogenic YAP/TAZ and decreasing Cyr61 expression. Oncogene. 2015;34:4056–4068. doi: 10.1038/onc.2014.333. [DOI] [PubMed] [Google Scholar]
- 18.Jeong GO, Shin SH, Seo EJ, Kwon YW, Heo SC, Kim KH, et al. TAZ mediates lysophosphatidic acid-induced migration and proliferation of epithelial ovarian cancer cells. Cell Physiol Biochem. 2013;32:253–263. doi: 10.1159/000354434. [DOI] [PubMed] [Google Scholar]
- 19.Rho SB, Woo JS, Chun T, Park SY. Cysteine-rich 61 (CYR61) inhibits cisplatin-induced apoptosis in ovarian carcinoma cells. Biotechnol Lett. 2009;31:23–28. doi: 10.1007/s10529-008-9845-8. [DOI] [PubMed] [Google Scholar]
- 20.Shen H, Cai M, Zhao S, Wang H, Li M, Yao S, et al. CYR61 overexpression associated with the development and poor prognosis of ovarian carcinoma. Med Oncol. 2014;31:117. doi: 10.1007/s12032-014-0117-2. [DOI] [PubMed] [Google Scholar]
- 21.Moleirinho S, Guerrant W, Kissil JL. The Angiomotins--from discovery to function. FEBS Lett. 2014;588:2693–2703. doi: 10.1016/j.febslet.2014.02.006. [DOI] [PMC free article] [PubMed] [Google Scholar]
- 22.Llado V, Nakanishi Y, Duran A, Reina-Campos M, Shelton PM, Linares JF, et al. Repression of Intestinal Stem Cell Function and Tumorigenesis through Direct Phosphorylation of beta-Catenin and Yap by PKCzeta. Cell Rep. 2015 doi: 10.1016/j.celrep.2015.01.007. [DOI] [PMC free article] [PubMed] [Google Scholar]
- 23.Chan SW, Lim CJ, Chong YF, Pobbati AV, Huang C, Hong W. Hippo pathway-independent restriction of TAZ and YAP by angiomotin. J Biol Chem. 2011;286:7018–7026. doi: 10.1074/jbc.C110.212621. [DOI] [PMC free article] [PubMed] [Google Scholar]
- 24.Yi C, Shen Z, Stemmer-Rachamimov A, Dawany N, Troutman S, Showe LC, et al. The p130 isoform of angiomotin is required for Yap-mediated hepatic epithelial cell proliferation and tumorigenesis. Sci Signal. 2013;6:ra77. doi: 10.1126/scisignal.2004060. [DOI] [PMC free article] [PubMed] [Google Scholar]
- 25.Butler AM, Scotti Buzhardt ML, Erdogan E, Li S, Inman KS, Fields AP, et al. A small molecule inhibitor of atypical protein kinase C signaling inhibits pancreatic cancer cell transformed growth and invasion. Oncotarget. 2015;6:15297–15310. doi: 10.18632/oncotarget.3812. [DOI] [PMC free article] [PubMed] [Google Scholar]
- 26.Korkmaz T, Seber S, Basaran G. Review of the current role of targeted therapies as maintenance therapies in first and second line treatment of epithelial ovarian cancer; In the light of completed trials. Crit Rev Oncol Hematol. 2015 doi: 10.1016/j.critrevonc.2015.10.006. [DOI] [PubMed] [Google Scholar]
- 27.Martin LP, Schilder RJ. Management of recurrent ovarian carcinoma: current status and future directions. Semin Oncol. 2009;36:112–125. doi: 10.1053/j.seminoncol.2008.12.003. [DOI] [PubMed] [Google Scholar]
- 28.Petrucelli N, Daly MB, Feldman GL. Hereditary breast and ovarian cancer due to mutations in BRCA1 and BRCA2. Genet Med. 2010;12:245–259. doi: 10.1097/GIM.0b013e3181d38f2f. [DOI] [PubMed] [Google Scholar]
- 29.Sugita M, Tanaka N, Davidson S, Sekiya S, Varella-Garcia M, West J, et al. Molecular definition of a small amplification domain within 3q26 in tumors of cervix, ovary, and lung. Cancer Genet Cytogenet. 2000;117:9–18. doi: 10.1016/s0165-4608(99)00135-1. [DOI] [PubMed] [Google Scholar]
- 30.Sonoda G, Palazzo J, du Manoir S, Godwin AK, Feder M, Yakushiji M, et al. Comparative genomic hybridization detects frequent overrepresentation of chromosomal material from 3q26, 8q24, and 20q13 in human ovarian carcinomas. Genes Chromosomes Cancer. 1997;20:320–328. [PubMed] [Google Scholar]
- 31.Arnold N, Hagele L, Walz L, Schempp W, Pfisterer J, Bauknecht T, et al. Overrepresentation of 3q and 8q material and loss of 18q material are recurrent findings in advanced human ovarian cancer. Genes Chromosomes Cancer. 1996;16:46–54. doi: 10.1002/(SICI)1098-2264(199605)16:1<46::AID-GCC7>3.0.CO;2-3. [DOI] [PubMed] [Google Scholar]
- 32.Haverty PM, Hon LS, Kaminker JS, Chant J, Zhang Z. High-resolution analysis of copy number alterations and associated expression changes in ovarian tumors. BMC Med Genomics. 2009;2:21. doi: 10.1186/1755-8794-2-21. [DOI] [PMC free article] [PubMed] [Google Scholar]
- 33.Fields AP, Regala RP. Protein kinase C iota: human oncogene, prognostic marker and therapeutic target. Pharmacol Res. 2007;55:487–497. doi: 10.1016/j.phrs.2007.04.015. [DOI] [PMC free article] [PubMed] [Google Scholar]
- 34.Parker PJ, Justilien V, Riou P, Linch M, Fields AP. Atypical Protein Kinase Ciota as a human oncogene and therapeutic target. Biochem Pharmacol. 2014;88:1–11. doi: 10.1016/j.bcp.2013.10.023. [DOI] [PMC free article] [PubMed] [Google Scholar]
- 35.Fields AP, Murray NR. Protein kinase C isozymes as therapeutic targets for treatment of human cancers. Adv Enzyme Regul. 2008;48:166–178. doi: 10.1016/j.advenzreg.2007.11.014. [DOI] [PMC free article] [PubMed] [Google Scholar]
- 36.Fields AP, Gustafson WC. Protein kinase C in disease: cancer. Methods Mol Biol. 2003;233:519–537. doi: 10.1385/1-59259-397-6:519. [DOI] [PubMed] [Google Scholar]
- 37.Jatoi A, Radecki Breitkopf C, Foster NR, Block MS, Grudem M, Wahner Hendrickson A, et al. A Mixed-Methods Feasibility Trial of Protein Kinase C Iota Inhibition with Auranofin in Asymptomatic Ovarian Cancer Patients. Oncology. 2014;88:208–213. doi: 10.1159/000369257. [DOI] [PMC free article] [PubMed] [Google Scholar]
- 38.Algeciras-Schimnich A, Milosevic D, McIver B, Flynn H, Reddi HV, Eberhardt NL, et al. Evaluation of the PAX8/PPARG translocation in follicular thyroid cancer with a 4-color reverse-transcription PCR assay and automated high-resolution fragment analysis. Clin Chem. 2010;56:391–398. doi: 10.1373/clinchem.2009.134015. [DOI] [PMC free article] [PubMed] [Google Scholar]
- 39.Frederick LA, Matthews JA, Jamieson L, Justilien V, Thompson EA, Radisky DC, et al. Matrix metalloproteinase-10 is a critical effector of protein kinase Ciota-Par6alpha-mediated lung cancer. Oncogene. 2008;27:4841–4853. doi: 10.1038/onc.2008.119. [DOI] [PMC free article] [PubMed] [Google Scholar]
- 40.Justilien V, Jameison L, Der CJ, Rossman KL, Fields AP. Oncogenic activity of Ect2 is regulated through protein kinase C iota-mediated phosphorylation. J Biol Chem. 2011;286:8149–8157. doi: 10.1074/jbc.M110.196113. [DOI] [PMC free article] [PubMed] [Google Scholar]


