Abstract
We have studied the dynamics of three transcription factor–DNA complexes using all-atom, microsecond-scale MD simulations. In each case, the salt bridges and hydrogen bond interactions formed at the protein–DNA interface are found to be dynamic, with lifetimes typically in the range of tens to hundreds of picoseconds, although some interactions, notably those involving specific binding to DNA bases, can be a hundred times longer lived. Depending on the complex studied, this dynamics may or may not lead to the existence of distinct conformational substates. Using a sequence threading technique, it has been possible to determine whether DNA sequence recognition is sensitive or not to such conformational changes, and, in one case, to show that recognition appears to be locally dependent on protein-mediated cation distributions.
INTRODUCTION
We recently carried out a molecular dynamics study of the interface dynamics of the complex between SKN-1, a transcription factor and its DNA cognate binding site (1). We found that arginine-phosphate salt bridges broke and reformed regularly with lifetimes of the order of hundreds of picoseconds. This result was in line with recent nuclear magnetic resonance (NMR) experiments (2–4), coupled with computational studies (5), showing that lysine-phosphate salt bridges were also dynamic within protein–DNA complexes. However, in the case of our work, we found that some arginine side chains could oscillate between backbone and base binding sites. By identifying the distinct conformational substates associated with these movements, and using a sequence threading technique to analyze binding selectivity, we found that different arginine-linked substates could explain different parts of the experimentally observed consensus binding sequence. It thus appeared that recognition, at least with this particular transcription factor, was the result of a dynamic process.
In order to test whether this result can be generalized, we have now extended our study to three other transcription factor–DNA complexes involving both major and minor groove binding and different degrees of protein-induced DNA deformation. First, we chose the ubiquitous TATA-box binding protein (TBP) that, as part of the TFIID factor, initiates the assembly of the transcriptosome on core promoters. TBP binds in the minor groove of the double helix via an extended β-sheet, producing a large DNA deformation, opening the minor groove, unwinding the double helix, bending it away from the protein and creating kinks at either end of the binding site due to the partial intercalation of phenylalanine residues (6). For the second protein, we chose sex-determining Y protein (SRY) that again binds in the minor groove, but this time via an α-helix and a flexible cationic tail (7). SRY binding, that also includes the partial intercalation of an isoleucine residue, again deforms DNA, but less extensively than TBP. The third protein chosen was the P22 c2 repressor (8). P22 is a homodimer that binds at two major groove sites separated by one turn of the double helix. P22 binding produces limited DNA deformation, but includes the close packing of DNA methyl groups around a valine residue within each half-site.
In addition to the differences already mentioned, our chosen proteins differ in the extent of their direct, and presumably sequence-specific, contacts between amino acid side chains and DNA bases. There are relatively few such contacts with TBP, only one in each half-site of P22, but many with SRY. This suggests that the balance between so-called direct and indirect recognition will vary significantly for these three proteins.
We have carried out microsecond-scale simulations on each of these complexes in water at a physiologically reasonable salt concentration and also performed reference simulations on the corresponding, isolated DNA oligomers. The results show that most protein–DNA contacts fluctuate on a sub-nanosecond timescale. A subset of these contacts oscillate between different DNA target sites, and a further subset are able to modulate the optimal DNA binding sequence of the protein.
While the sequence-threading technique we previously developed is an essential part of this study, for computational reasons it cannot treat explicit water molecules, or ions, at the protein–DNA interface (9,10). For the cases studied here this restriction actually helps in determining whether such ‘environmental factors’ indeed play an important role in the recognition mechanisms of the proteins we have studied.
MATERIALS AND METHODS
Starting conformations
The initial construction of our three chosen protein–DNA complexes was based on coordinates drawn from the Protein Data Bank (11): the crystal structure of human TBP at a resolution of 1.9 Å (1CDW; (6)), the NMR structure of human SRY (1J46; (7)) and the crystal structure of lambdoid bacteriophage P22 c2 repressor (P22) at a resolution of 1.53 Å (2R1J; (8)). The internal/helicoidal variable modeling program JUMNA (12) was used to construct complexes within oligomers containing the experimentally studied binding sequences, maintaining the conformation of the protein and of the protein–DNA interface. We used a 16-mer for TBP, a 14-mer for SRY and a 20-mer for the dimeric P22. Their exact sequences are shown and discussed in the results section.
MD simulations
The initial conformations of the protein/DNA complexes were solvated with SPC/E water molecules (13). Periodic boundary conditions were imposed using a truncated octahedral box, ensuring a solvent shell of at least 10 Å around the solute. The solute was neutralized with potassium ions and then sufficient K+/Cl− ion pairs were added to reach a concentration of 150 mM. The ions were initially placed at random, but at least 5 Å from DNA and 3.5 Å from one another. The resulting systems contained between 9800 and 11 200 water molecules, corresponding to a total of 33 456, 32 516 and 37 091 atoms for the TBP, SRY and P22 complexes respectively.
Molecular dynamics simulations were performed with the AMBER 12 suite of programs (14,15) using PARM99 parameters (16) and the bsc0 modifications (17) for the solute and Dang parameters (18) for the surrounding ions. Simulations employed periodic boundary conditions and electrostatic interactions were treated using the particle-mesh Ewald algorithm (19,20) with a real space cutoff of 9 Å. Lennard–Jones interactions were truncated at 9 Å. A pair list was built with a buffer region and a list update was triggered whenever a particle moved by more than 0.5 Å with respect to the previous update.
Each system was initially subjected to energy minimization with harmonic restraints of 25 kcal mol−1 Å−2 on the solute atoms. The system was then heated to 300 K at constant volume during 100 ps. Constraints were then relaxed from 5 to 1 kcal mol−1 Å−2 during a series of 1000 steps of energy minimization (500 steps of steepest descent and 500 steps of conjugate gradient) followed by 50 ps of equilibration with restraints of 0.5 mol−1 Å−2 and 50 ps without solute restraints. The 500 ns production simulations (or 1 μs in the case of P22) were carried out at constant temperature (300 K) and pressure (1 bar) with a 2 fs time step. During these simulations pressure and temperature were maintained using the Berendsen algorithm (21) with a coupling constant of 5 ps and SHAKE constraints were applied to all bonds involving hydrogens (22). Conformational snapshots were saved for further analysis every ps. For comparison purposes, the isolated DNA oligomers from each complex were also simulated alone using an identical protocol, creating a second set of 500 ns trajectories.
Conformational and environmental analysis
Average DNA conformation, DNA conformational fluctuations and ion distributions around the protein/DNA complexes during the MD simulations were analyzed with the Curves+ program (23) and the Canal and Canion utilities (https://bisi.ibcp.fr/tools/curves_plus/). In addition to intra-bp, inter-bp and bp-axis parameters Curves+ can calculate groove geometries and the overall bend of a helical axis. Note that the values of axis bend presented here ignore the terminal base pairs of the oligomers since these often suffer from local deformations.
Using the recently developed Curves+ ion analysis approach, based on describing ion positions using curvilinear helicoidal coordinates with respect to the DNA helical axis, it was notably possible to calculate average ion molarities and ion populations within the DNA grooves (24,25). As in our earlier work, the groove limit was set at a radius of 10.25 Å from the DNA helical axis (the average radial position of the backbone phosphorus atoms), while the angular limits defining the major and minor grooves were determined by the average position of the sugar C1′ atoms. Spatial ion densities, and all molecular graphics, were generated using Chimera (26,27).
Lastly, hydrogen bond and salt bridges were analyzed using AMBER Tools (28). We chose to limit our analysis to direct interactions by applying a distance cut-off of ≤3.5 Å between the relevant heavy atoms and an angle cut-off of ≥135° at the intervening hydrogen atom. These interactions are characterized by the percentage of the trajectory during which they are observed (% presence) and by their average lifetimes, which are calculated ignoring interruptions in the interaction that last less than 1 ps. As shown in Supplementary Figure S1, for the case of salt bridges, longer range interactions, notably in the range 3.5–6.0 Å (presumably involving a bridging water molecule (5)) exist and even more distant interactions (generally involving concurrent interactions with a neighboring nucleic acid residue) can also occur. It is however difficult to characterize these indirect interactions with a simple distance criteria and they have been excluded from the present analysis.
Clustering the MD trajectory
In order to identify conformational clusters within the MD trajectory, we began by extracting snapshots every 200 ps. Since we were principally interested in the evolution of the protein–DNA binding specificity, we characterized each snapshot by counting the number of contacts between the protein and the DNA bases. Each contact between heavy atoms scored 1 for distances rij below 4 Å (using shorter distances would result in many transient ‘breaks’ that add noise to the analysis). In order to further increase the robustness, we used a buffer zone from 4 Å to 5 Å over which the score was modulated with a sigmoidal function s(i,j) of the distance rij between the atoms i and j:
 |
This analysis yielded a rectangular Na amino acid by Nb base matrix for each snapshot. The overall distance d(x,y) between any two such matrices x and y was then calculated using the Manhattan algorithm (29).
 |
Next, the Ward agglomerative hierarchical clustering method (30–32) was used to classify the different snapshots into groups by minimizing the variance within each cluster and increasing the weighted squared distance between cluster centers. The distance matrix and cluster representations were obtained using the R software package (33).
When an MD trajectory shows the existence of conformational substates, we create new clustered maps for each amino acid at the interface. These component maps indicate which residue, or residues, are responsible for the observed changes and, in the case that several residues are involved, indicate whether these residues act together or separately to create conformational substates.
Binding specificity analysis
Binding specificity was determined for any chosen snapshot from the MD trajectory (after a brief Cartesian coordinate energy minimization to remove bond length and base plane deformations) using the so-called ADAPT sequence threading approach (9,10) implemented within the JUMNA program (12). This consists of calculating the complex formation energy of the protein–DNA complex for all possible DNA base sequences and then deriving a position weight matrix (PWM) from the best binding sequences. In order to do this, it is necessary to thread all possible base sequences into the binding site of the DNA oligomer within the complex, adapting the protein–DNA interface in each case using internal coordinate energy minimization. Minimization was performed with the same AMBER parameterization used for the MD simulations, but replacing the explicit solvent and ion shell with a simple continuum model using a sigmoidal distance-dependent dielectric function and reduced phosphate charges (10). In parallel, an identical base sequence is threaded into the average conformation of the isolated DNA oligomer and energy minimization is again performed. Finally, another energy minimization is performed for the isolated protein (with flexibility limited to the side chains included within the interface cutoff distance, see below).
Subtracting the isolated DNA oligomer and protein energies from the protein–DNA complex energy yields the complex formation energy, which can be further analyzed in terms of two components: the DNA deformation energy and the protein–DNA interaction energy. In this work, we used ADAPT to scan 8, 10 and 20 bp belonging to the binding sites of the TBP, SRY and P22 complexes respectively (this implies analyzing binding for between 6.5 × 10⁴ and 1.1 × 10¹² potential base sequences). ADAPT calculations achieve this task by a divide-and-conquer technique, breaking each sequence down into overlapping 5 bp fragments and thus dramatically reducing the total number of calculations for the complex and for the isolated DNA oligomer, without significant loss of accuracy (10). Protein flexibility was also limited to side chains within 20 Å of the protein–DNA interface. The energies resulting from this analysis were converted into PWMs using the WebLogo software (34). Finally, by analyzing the binding specificity derived from the sequence-dependent DNA deformation energy, or from the sequence-dependent protein–DNA interaction energy we could also describe binding specificity in terms of its so-called indirect and direct components.
We remark that the utility programs associated with ADAPT have been extended to be able to derive a single PWM from a number of MD snapshots belonging to a given conformational substate (in the present work, between 5 and 10 snapshots per substate, depending on its overall duration). In this case, ADAPT calculations were based on sequence-dependent energy differences with respect to the minimum energy for each snapshot, enabling us to overcome sequence-independent energy changes mainly caused by the necessary simplification of the electrostatic calculations (which rely on a rudimentary implicit solvent representation). Using this approach it was possible to describe the sequence selectivity of each of the conformational sub-states detected by the cluster analysis and to compare this to the consensus selectivity for the entire MD simulation, or to experimental binding data.
RESULTS AND DISCUSSION
TATA-box binding protein (TBP)
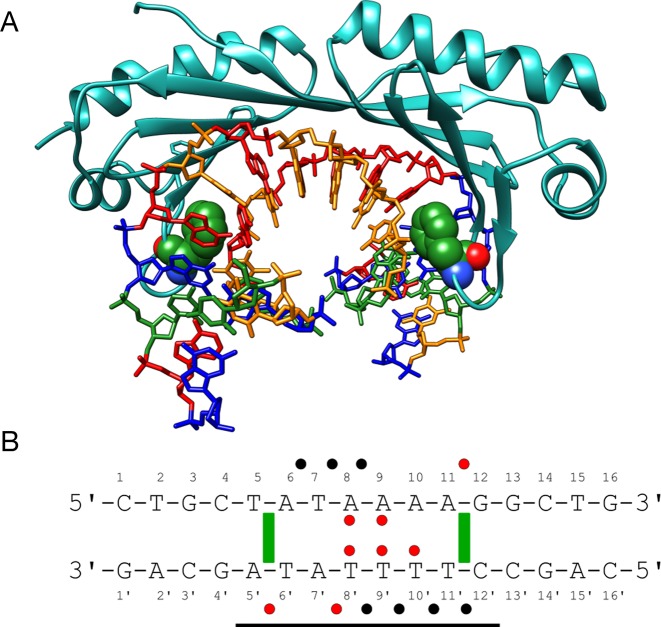
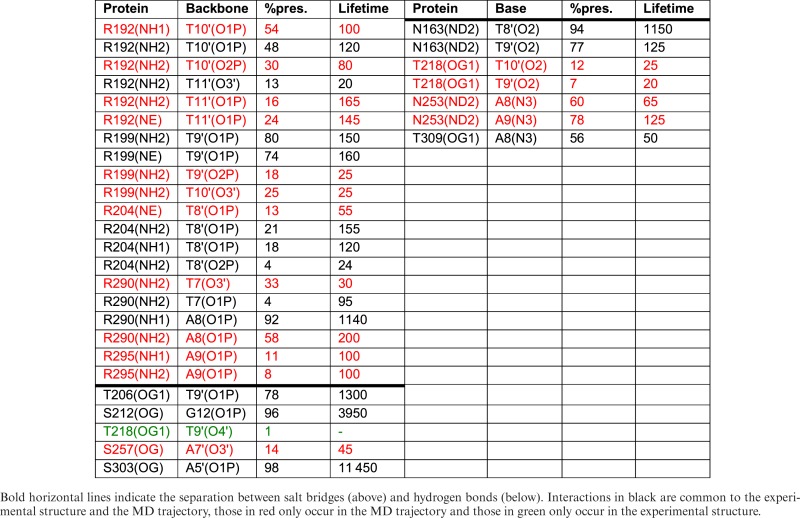
We chose to study human TBP as a casebook example of a protein binding in the minor groove of DNA, producing significant DNA deformation (6). In this case, protein binding causes a wide opening of the minor groove, a strongly reduced twist and ∼60° bending away from the protein. TBP interacts with DNA via an extensive β-sheet covering 8-bp site (T5 → G12) within the 16 bp oligomer we studied. Despite this extensive contact surface, the MD simulations confirm that the protein establishes relatively few hydrogen bonds with the DNA bases, only two with the Watson strand and three with the Crick strand involving asparagine or threonine side chains binding to the bases A8, A9 and T8′ → T10′ (see Table 1). These are complemented by eight arginine-phosphate salt bridges involving seven phosphate groups, three in the Watson strand and four in the Crick strand, and three serine-phosphate hydrogen bonds (with G12, A5′, A7′, see Figure 1). For comparison, the contacts found in the crystal structure are shown in Supplementary Figure S2A. Note that, by convention, phosphate contacts refer to the 5′-phosphate groups of the cited nucleotides. Table 1 shows that, as we found earlier for SKN-1 (1), while all but one of the interactions found experimentally are observed, the MD trajectory leads to new interactions, mainly linked to the dynamics of amino acid side chains that enables them to contact several neighboring phosphates or bases.
Table 1. TBP interactions with the DNA backbone and bases showing percentage presence during the 0.5 μs MD trajectory and the average lifetime (ps).
|
Figure 1.
(A) Structure of the human TBP/DNA complex (6). Two phenylalanine residues (Phe 193 and Phe 284, green spheres) are partially intercalated at the T5pA6 and A11pG12 steps. DNA is colored according to sequence (A = red, T = orange, G = blue, C = green). (B) DNA sequence used for the MD simulations with the binding site delimited by a horizontal black line. The ‘Watson’ strand of the oligomer is numbered 1–16 in the 5′-3′ sense and the ‘Crick’ strand is numbered 1′-16′ in the 3′-5′ sense. Salt bridges, hydrogen bonds and important apolar interactions observed during the MD simulations are indicated by black dots, red dots and green rectangles respectively.
Given the paucity of amino acid-base interactions, TBP's mode of recognition is expected to involve a significant indirect component relying on the sequence-dependent nature of the induced DNA deformation. In addition to the large-scale bending and twisting components already mentioned, TBP binding also includes the partial intercalation of phenylalanine residues which lead to the formation of kinks at either end of the binding site at T5pA6 and A11pG12, locally increasing the rise and the positive roll. The consensus binding sequence of TBP is TATAWAWR (where W implies A/T and R implies A/G), although some dependence on the flanking base sequences has also been demonstrated (35). In line with a dominantly indirect recognition mechanism, it is also possible to favor TBP binding by appropriately pre-bending DNA, in order to widen the minor groove at the interaction site (36).
Analysis of our 0.5 μs molecular dynamics simulation shows that the TBP–DNA complex stays relatively close to the crystallographic structure (heavy atom root mean square difference (RMSD) ≤ 2Å). DNA remains strongly bent away from the protein by an average of 57° (compared to 66° in the crystal structure and to only 24° in the isolated DNA oligomer, which bends in the same direction as that observed in the complex). The total twist over the binding site is reduced by an average of 85° compared to the free oligomer. Supplementary Figure S3 summarizes the average conformation of the binding site in terms of twist, rise, roll and groove width.
From a dynamic point of view, the multiple salt bridges established between TBP and DNA lead to restricted phosphate mobility typically reducing values in the free oligomer (root mean square fluctuation (RMSF) ≈1.75 Å) by around 25% (Supplementary Figure S3). The salt bridges have a percentage presence ranging from 15 to 97% of the simulated trajectory (ignoring changes in the closest interacting atom pairs, see Supplementary Table S1). Those with A8 and T9′ are the longest lived, while those with A9 and T10′ are the shortest. As shown in Table 1, specific salt bridge interactions, and also specific hydrogen bonding across the protein–DNA interface have lifetimes that are typically around 100 ps, although some may persist for many nanoseconds.
As shown in Supplementary Figure S4, TBP binding modifies the ion distribution around DNA. The minor groove ion density is not surprisingly reduced to zero throughout the binding site. However, we also see changes in the narrow major groove, where there is an increase in ion density for the base pairs belonging to the binding site and also the appearance of a particularly strong ion density (5x that in the isolated oligomer) at G12pG13. For 75% of the trajectory there is a K+ ion resident at this site and for 15% the site is occupied by two ions (the equivalent results for the isolated oligomer being 48 and 5%).
When we use the interface analysis protocol, previously developed for our study of the SKN-1/DNA complex, we do not see any of the substates related to the amino acid side chain dynamics that we observed with the former protein. The TBP binding interface turns out to be very stable. Although both salt bridges and hydrogen bonds to the bases both break repeatedly during the simulation (see the lifetimes listed in Table 1), they generally reform with the same nucleotides (although the donor and acceptor atoms may change, as shown in the table). The amino acid-base interaction matrix is very smooth and cannot be clustered (data not shown). Consequently, we can generate an overall PWM logo by studying a set of 10 snapshots drawn randomly from the trajectory.
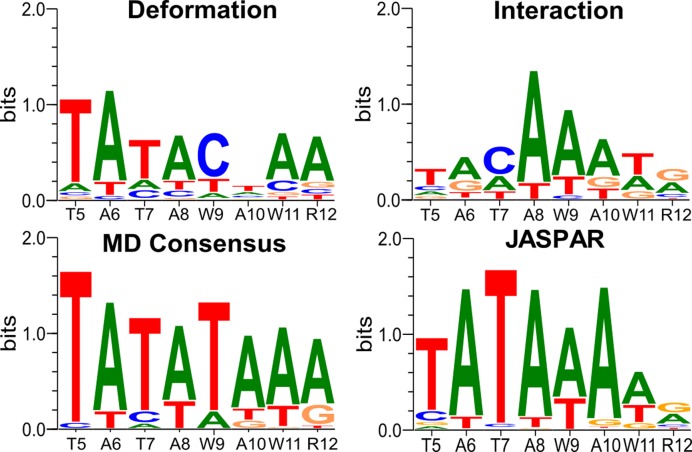
Sequence-threading using ADAPT on each snapshot, followed by averaging, leads to the overall logo shown in Figure 2. This result is in good agreement with the experimental result from JASPAR (37), in terms of the base recognition along the binding site and in terms of the overall information content (10.1 for the MD snapshots versus 9.3 for JASPAR, with an overall correlation coefficient of 0.87). Dividing the ADAPT results into indirect (DNA deformation) and direct (protein–DNA interaction energy) components confirms that indirect recognition plays a major role in this complex (as we saw in earlier work based on a sequence threading analysis applied to the experimental structure of the complex (9,10)). However, the direct interactions remain critical in establishing the overall consensus, particularly toward the 3′-end of the binding site, where the majority of amino acid-base hydrogen bonds are indeed formed (see Figure 1 and Table 1). In conclusion, TBP presents a much simpler case than our earlier study of the protein skinhead 1, SKN-1. Individual protein–DNA interactions regularly break and reform (typically on a 0.1 ns timescale), and sometimes oscillate between neighboring nucleotides, but these dynamics do not influence the recognition mechanism that can be understood using a single conformational state.
Figure 2.
PWM logos for the TBP/DNA complex obtained from the analysis of the MD trajectory. Top left: DNA deformation energy (indirect recognition). Top right: DNA–protein interaction energy (direct recognition). Bottom left: overall recognition. Bottom right: experimental logo from the JASPAR database. Each panel also shows the experimental consensus along the abscissa (W ≡ A/T, R ≡ A/G).
Sex-determining region Y protein (SRY)
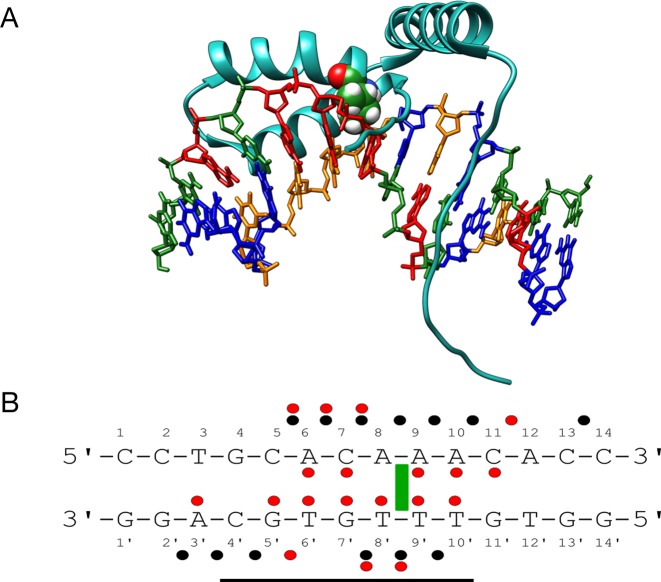
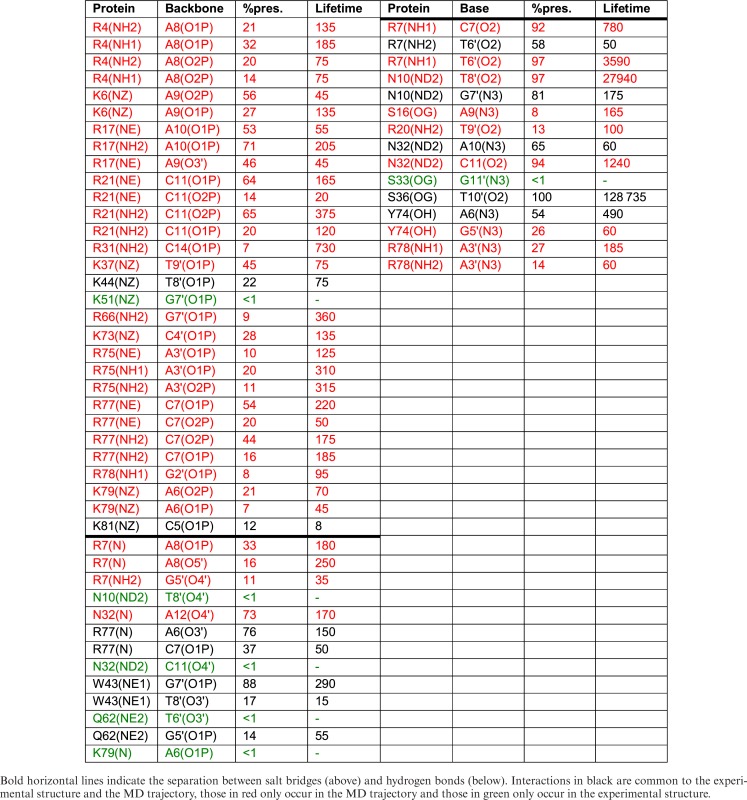
SRY determines the male sex in humans and belongs to the Sry-related HMG box (SOX) gene family. It binds in the minor groove of DNA, via an α-helix at the 3′-end of the binding site and via a flexible cationic C-terminal tail (with four lysines and three arginines in proximity to DNA) at the 5′-end. It recognizes a 7 bp binding site with a weak consensus sequence WAACAAT. Our simulations were carried out using a 14 bp oligomer, with a centrally positioned site G4 → A10 (GCACAAA) based on the sequence used in the NMR structure determination (7) (see Figure 3). Note that the α-helix contains a conserved isoleucine that partially intercalates at the ApA step within the CAAA end of the binding site (numbered A8pA9 with the 14 bp DNA oligomer we studied). SRY makes extensive hydrogen bonds with base sites, five in the Watson strand and seven in the Crick strand, as well as numerous arginine-phosphate salt bridges, seven in the Watson strand and six in the Crick strand (see Figure 3 and Table 2. For comparison, Supplementary Figure S2B shows the experimentally observed contacts).
Figure 3.
(A) Structure of the human SRY/DNA complex (7). Isoleucine 13 (green spheres) is partially intercalated at the A8pA9 step. DNA is colored according to sequence (A = red, T = orange, G = blue, C = green). (B) DNA sequence used for the MD simulations with the binding site delimited by a horizontal black line. The ‘Watson’ strand of the oligomer is numbered 1–14 in the 5′-3′ sense and the ‘Crick’ strand is numbered 1′-14′ in the 3′-5′ sense. Salt bridges, hydrogen bonds and important apolar interactions observed during the MD simulations are indicated by black dots, red dots and green rectangles respectively.
Table 2. SRY interactions with the DNA backbone and bases showing percentage presence during the 0.5 μs MD trajectory and the average lifetime (ps).
|
As for TBP, the minor groove binding of SRY distorts DNA. The double helix bends significantly away from the protein by an average of 61° during the simulations (43° in the NMR structure and 20° in the isolated oligomer). The minor groove is widened by roughly 6 Å where the α-helix contacts DNA at the 3′-end of the binding site and is locally unwound by 41°. We also see an increased rise (5 Å) and positive roll (45°) at the isoleucine intercalation site. Supplementary Figure S5 summarizes the conformational characteristics of the SRY complex.
Also as noted for TBP, salt bridge formation reduces the dynamics of the phosphodiester backbones within the binding site as judged by the phosphate RMSF values which drop from an average of 1.75 Å to 1.25 Å (see Supplementary Figure S5). The salt bridges on the Watson strand generally have a longer percentage presence, and often multiple arginine or lysine interactions, compared to those of the Crick strand (see Supplementary Table S1). The two outlying interactions (R31-C14 and R78-G2′) are both present for less than 10% of the trajectory. Individual salt bridge and hydrogen bond interactions at the protein–DNA interface typically have lifetimes of the order of 100 ps, but several specific hydrogen bonds (notably those with C11, T6′, T8′ and T10′) persist for many nanoseconds (see data in Table 2). As for TBP, the interface dynamics adds many contacts to those seen experimentally (red lines in Table 2) with a significant increase in the number of salt bridges and hydrogen bonds, where most of the amino acids involved are able to contact several nucleotides within (or adjacent to) the binding site.
The extensive SRY–DNA interface understandably restructures the counterion distribution around DNA, virtually eliminating K+ ions from the minor groove. The major groove ions are less perturbed, although a strong binding site at G4pC5 is significantly reduced in the complex, while ion density at A9pA10 opposite the SRY α-helix (and the widened minor groove) increases (see Supplementary Figure S6).
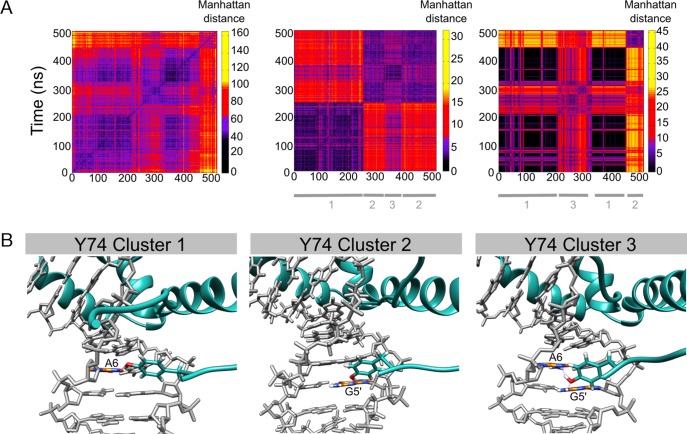
We now consider the impact of SRY/DNA interface dynamics on recognition by first calculating the amino acid-base contact matrix for the trajectory. These results make it clear that SRY binding involves several distinct conformational substates. In order to understand which amino acids are playing a major role we calculated the contact matrices for each residue involved in the SRY/DNA interface. This analysis showed that two residues belonging to the flexible C-terminal tail, tyrosine 74 (Y74) and arginine 78 (R78), were the key players. Their individual contact matrices taken together explain the major variations seen in the overall interface matrix (see Figure 4).
Figure 4.
Clustering snapshots from the 500 ns MD trajectory of the SRY/DNA complex. (A) Manhattan distance matrix for all protein–DNA base contacts (left), for tyrosine 74 (center) and for arginine 78 (right). The vertical scale shows increasing distances (black → yellow). (B) Alternative orientations observed for tyrosine 74: bound to A6(N3), bound to G5′(N3), bidentate interactions with A6(N3) and G5′(N2).
We begin by considering Y74. This side chain can adopt three states: interacting as a hydrogen bond donor to A6(N3) (54% of the trajectory), as a donor to G5′(N3) (26%), or positioned to interact in a bidentate manner with A6(N3) and G5′(N2) (20%). Sequence threading shows that these conformational changes have a relatively small impact on recognition since an A in position 6 is favored whatever the state of Y74 (see Figure 5). However, a preference for T in position 4 (at the 5′-end of the binding site) only occurs when Y74 is interacting with the adjacent base at position 5. Similarly, T/A recognition in position 10 is diminished when Y74 is bound in a bidentate manner (although how these effects are coupled is not clear). For R78, we again find three substates: interacting with the backbone phosphate group of G2′ (8% of the trajectory), interacting with A3′(N3) (27%) or not interacting directly with DNA (65%). Since the bases contacted by R78 flank the 5′-end of the SRY binding site, this side chain has little impact on the calculated consensus, although we note that the weak preference of C at position 7 disappears when R78 does not interact with DNA (data not shown).
Figure 5.
PWM logos for the SRY/DNA complex obtained from the analysis of MD trajectory. Tyrosine 74 dynamics generate three substates: binding to A6 (top left), binding to G5′ (top center), bidentate binding to A6/G5′ (top right). Components of recognition: indirect from DNA deformation energy (middle left), direct from DNA–protein interaction energy (middle center), overall (middle right). Experimental PWM logos from the JASPAR database: human SRY (bottom left), mouse SRY (bottom center and right). Each panel also shows the experimental consensus along the abscissa (W ≡ A/T, R ≡ A/G).
Looking at the overall consensus derived from the trajectory in Figure 5 we see a reasonable agreement with the experimental result with the exception of the stronger experimental C preference at position 7 (information content 6.0 versus a JASPAR value of 8.7, with an overall correlation coefficient of 0.69). It is worth noting that two experimental logos are available for the highly homologous mouse SRY protein (86% homology, with a virtually identical DNA-binding interface based on sequence alignment) and one of these shows a dominant recognition of thymine at this position 7 as in our PWM (38). It is also interesting to note that although the simulations involved an oligomer containing G4-C5, the consensus derived by sequence threading shows no preference for these bases, and rather favors the experimental weak preference for A/T. This implies that the conformational optimization carried out for each overlapping fragment of the complex during threading is capable of correctly adapting the protein–DNA interface and is not biased by the DNA sequence used for the simulation.
Looking at the direct and indirect components of the MD-derived consensus shows, not unreasonably, that direct interactions dominate the recognition at the 5′-end, where the C-terminal tail binds. In contrast, indirect, deformation-related recognition, dominates where the α-helix deforms the minor groove at the 3′-end and both mechanisms play a role in the center of the binding site. In conclusion, while SRY binding does involve conformational substates, these play a relatively minor role in determining the base sequence recognized by the protein.
Bacteriophage P22 c2 repressor protein (P22)
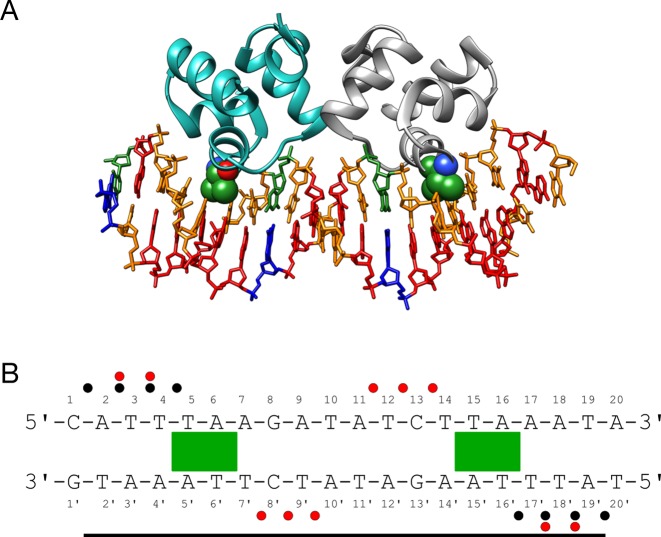
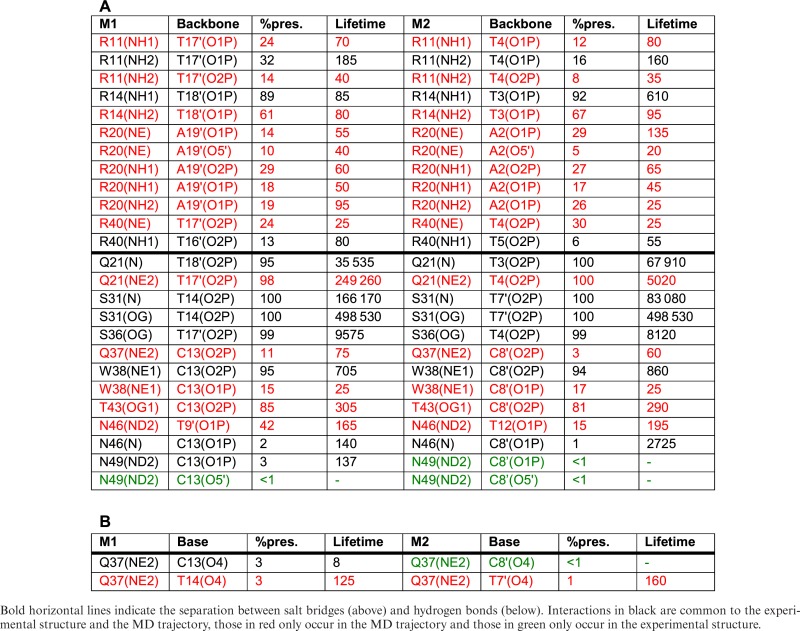
P22 is a homodimer that is involved in controlling the lysogenic pathway of the lambdoid P22 bacteriophage. Each monomer binds to DNA via an α-helix within a major groove half-site, the two half-sites being separated by one turn of the DNA double helix (8). P22 binds to six naturally occurring operator sequences having an overall consensus ATTTAAGATATCTTAAAT, where the bases in bold font are highly conserved. Each α-helix carries a conserved valine residue in close contact with the bases of each half-site. In the crystal structure, the half sites have the sequence TTAAG and they are separated by a central 4-bp fragment ATAT. The minor groove of this fragment faces the protein but is not contacted by it, although four glutamic acid residues (E44 and E48 in each monomer) are close by. Our simulations involved a 20 bp DNA oligomer with the sequence shown in Figure 6. The two half sites are located at positions T4 → G8 and C13 → A17. The important valine residues (V33 in each monomer) contact the steps T5pA6 and T15pA16 and are each surrounded by the four thymine methyl groups of the TTAA segments. During the MD simulation, P22 forms four salt-bridges with each phosphodiester strand of the binding site (versus six in the crystal structure, see Supplementary Figure S2C). Apart from the valine contacts already mentioned, only fleeting contacts are seen with the bases within the binding site (see Table 3).
Figure 6.
(A) Structure of the bacteriophage P22/DNA complex (the two monomers are shown as blue and gray ribbons) (8). Valine 33 from each monomer interacts with the thymine methyl groups of the T4-A7 and T14-A17 base pairs. DNA is colored according to sequence (A = red, T = orange, G = blue, C = green). (B) DNA sequence used for the MD simulations with the binding site delimited by a horizontal black line. The ‘Watson’ strand of the oligomer is numbered 1–20 in the 5′-3′ sense and the ‘Crick’ strand is numbered 1′-20′ in the 3′-5′ sense. Salt bridges, hydrogen bonds and important apolar interactions observed during the MD simulations are indicated by black dots, red dots and green rectangles respectively.
Table 3. P22 interactions with the DNA backbone (A) and the bases (B) showing percentage presence during the 1 μs MD trajectory and the average lifetime (ps) for each monomer (M1 and M2).
|
P22 causes relatively little DNA deformation upon binding. On average, during the 1 μs MD trajectory, DNA is bent by 23° toward the protein (as in the crystal structure), but this is only slightly more than the bend in the free oligomer. Both major and minor grooves are narrowed following protein binding, with the exception of a small broadening of the central major groove. This is not related to bending (which generally has opposite impacts on the major and minor grooves), but to over-twisting the double helix (the twist over the full binding site increasing by 40° compared to the isolated oligomer). This change involves the segments T5-A9 and T12-A17, plus the central T10pA11 step (which exhibits an 8° increase in twist, although the flanking ApT steps are unaffected). Rise is largely unaffected by P22, with the exception of small increases (0.3 Å, coupled with 10° of roll) at the TpA steps contacted by the Val33 residues. These conformational changes are summarized in Supplementary Figure S7.
As for the other cases studied here, protein binding reduces phosphate mobility by roughly 0.5 Å RMSF. However, while this effect is uniform on the Crick strand, the phosphates A6-G8 and A16-A18 on the Watson strand are not affected (see Supplementary Figure S7). The most stable salt bridges are those involving arginines 14 and 20 that are present between 73 and 97% of the trajectory. Those involving arginines 11 and 40 are considerably more labile (see Supplementary Table S1). Both salt bridge and hydrogen bond lifetimes are again of the order of 100 ps, but as already seen for SRY, several backbone hydrogen bonds are much longer lived. Also, as for the other proteins studied, many interactions fluctuate between neighboring backbone sites (see Table 3).
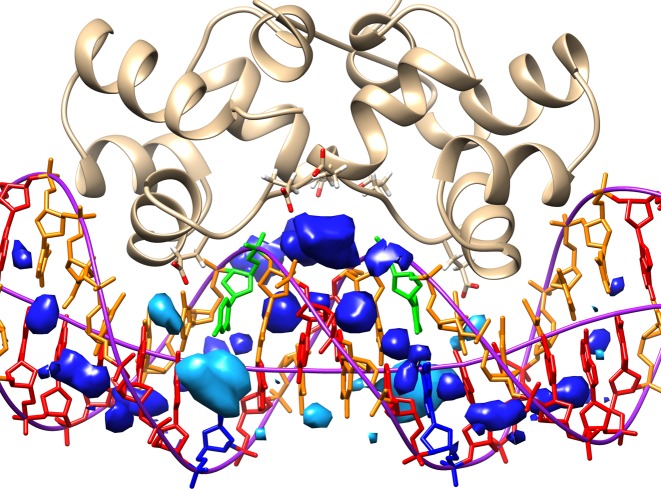
Although P22 binding influences the ion distribution around DNA, the changes in the major groove are relatively small and, surprisingly, the 2.5 M ion densities at G8 and C13, observed in the isolated oligomer, remain after P22 binding (with a K+ ion resident for 70% of the trajectory) (see Supplementary Figure S8). Interestingly a bound cation was observed experimentally at one of these positions (the other being occupied by a lysine residue) (39). The most important change however occurs for the ApT steps in the central minor groove. Here, we observe a cation density of roughly 15 M with a corresponding probability of 75% for finding a K+ ion in this zone (see Figure 7). As shown in figure, these ions undoubtedly help to offset the repulsion between the P22 glutamic acid groups and the DNA phosphates (39,40).
Figure 7.
Average K+ distribution in the minor (dark blue) and major (pale blue) grooves of DNA within the P22/DNA complex plotted as 4 M isodensity surfaces. Ions accumulate within the central minor groove (both near the bases and at the entrance to the groove) due to neighboring P22 glutamic acid residues. Strong major groove densities are also seen close to the G8 and C13 base pairs. Nucleotides are color-coded (A = red, T = orange, G = blue, C = green). The backbone pathway and the helical axis from Curves+ are shown in purple.
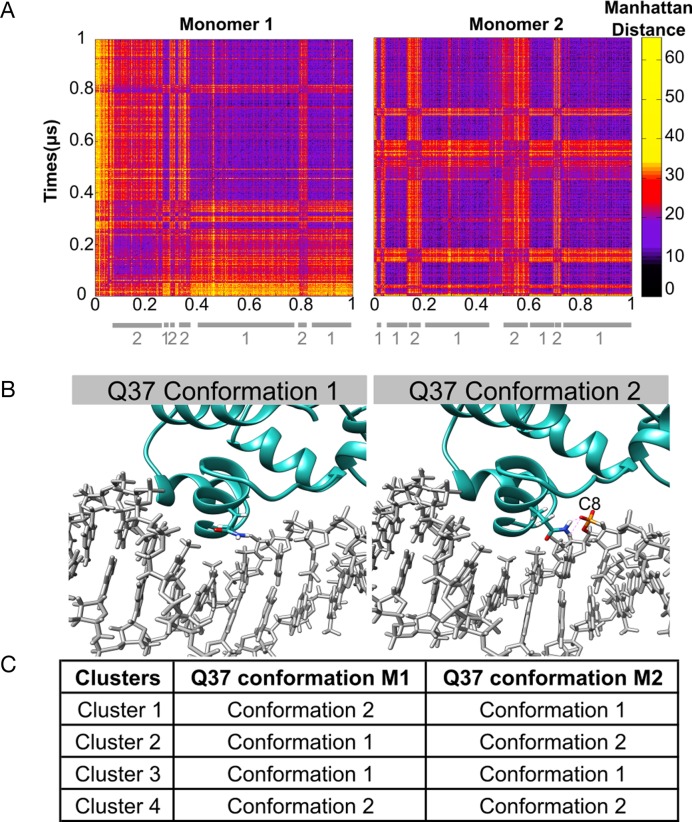
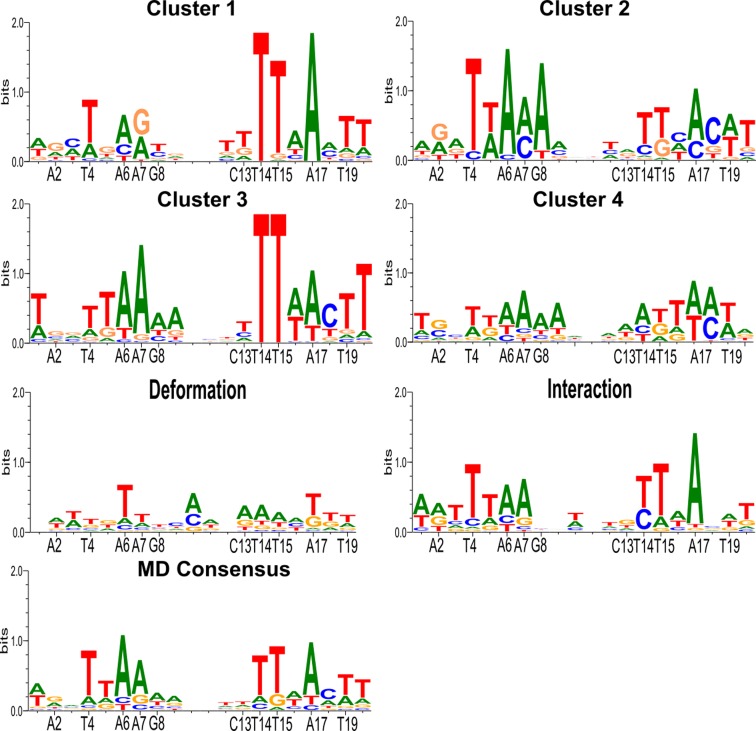
During 1 μs trajectory, symmetry is largely conserved between the two half-sites in terms of their buried surface areas (613 ± 33 Å and 588 ± 55 Å respectively) and the percentage presence and lifetimes of the P22-DNA contacts. However, independent conformational fluctuations occur at each site. These can be seen in the amino acid side chain-DNA base contact maps shown in Figure 8. Carrying out the residue-by-residue analysis already described enabled us to identify glutamine 37 (Q37) within the interacting α-helix of each P22 monomer as responsible for the main fluctuations in the protein–DNA interface. The interaction of the Q37 residues of each monomer with T7′ and T14 seen in the crystal structure, only occurs fleetingly during the MD trajectory (3%). For the rest of the time Q37 binds to the adjacent CpT phosphate group (11%), or has no direct interaction with DNA. Considering the backbone bound or unbound states of the two Gln37 residues leads to four possible substates (Figure 8). Strong recognition of the TTAA half-site motif only occurs when the corresponding Q37 is not bound to the DNA backbone (i.e. for M2 in cluster 1, for M1 in cluster 2 and for both monomers in cluster 3). The loss of recognition occurring during Q37-backbone binding appears to be due both to an overall displacement of the P22 monomer and to the reorientation of the Q37 side chain, reducing favorable apolar interactions with the proximal thymine methyl groups.
Figure 8.
Clustering snapshots from the 1 μs MD trajectory of the P22/DNA complex. (A) Manhattan distance matrix for all protein–NA base contacts involving each monomer. The vertical scale shows increasing distances (black → yellow). (B) Alternative orientations observed for glutamine 37 (Q37): positioned in the major groove (left), bound to the backbone (right). (C) summary of the position of the Q37 residues in each cluster.
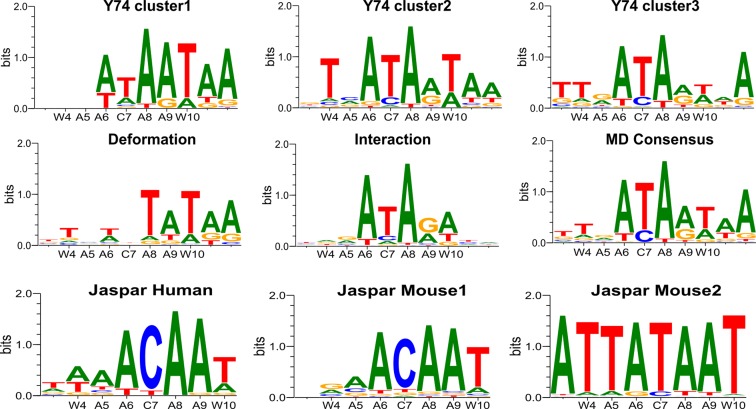
However, if we consider the overall MD consensus for P22 shown in Figure 9, we see that although the TTAA sequences interacting with the valine 33 residues are well detected, we see no G/C preference at positions 8 and 13 and no significant sequence preference for the central 4 bp (although there is a very weak A/T selectivity visible at positions 9 and 12). Analyzing this result in the light of existing experimental data is instructive. The central AATT selectivity has been interpreted as indirect recognition resulting from the formation of a B' structure characterized by a narrow minor groove and increased helical twist. While the MD simulation indeed sees such changes, no sequence selectivity occurs. A second recognition factor mentioned in the experimental studies was the probability of cations in the central ‘tunnel’ region electrostatically favoring A/T base pairs. Although Tl+/Rb+ cations were tested as ‘visible’ substitutes for K+, no ions were found in the crystal structure (possibly due to substitution by NH4+ cations) (39). The role of electrostatics was however supported by the loss of selectivity when either E44 or E48 were substituted by neutral residues (40). The present MD studies further support this analysis, confirming a strong K+ presence in the central tunnel region with two strong density regions close to the bases in the minor groove that would certainly favor AT base pairs. Similar densities are observed in the major groove close to the positions 8 and 13 which would favor the GC base pairs seen in the native operator sequences. Unfortunately, given the computational effort necessary in ADAPT, the environmental of water and ions can only be represented in a simplified manner and thus the effect of explicit ion densities is not taken into account. This is also true for specific water molecules that have also been proposed as favoring the G/C preference at positions 8 and 13 via bridged hydrogen bonds to E42 (8). Such an effect is also beyond the range of our threading procedure and it is consequently not surprising that we see no selectivity at these positions.
Figure 9.
PWM logos for the P22/DNA complex obtained from the analysis of MD trajectory. Glutamine 37 (Q37) dynamics in each monomer (termed M1 and M2) generates four substates: (i) Q37/M1 bound to backbone, (ii) Q37/M2 bound to backbone, (iii) no backbone interactions, (iv) both Q37 bound to backbone. Components of recognition: indirect from DNA deformation energy (third row left), direct from DNA–protein interaction energy (third row right), overall (fourth row left).
CONCLUSIONS
We have extended our earlier studies of the role of dynamics in protein–DNA recognition to three new transcription factors: TBP, SRY and P22. The results show that the protein–DNA interfaces are dynamic in all three cases. Interactions with the DNA backbones and the DNA bases, involving salt bridges or hydrogen bonds, have lifetimes that are typically of the order of tens to hundreds of picoseconds. This is in line with recent NMR and simulations studies of the dynamics of lysine salt bridges in protein/DNA complexes (5,41,42). A very recent extension of this work shows that, in contrast, arginines bound to guanine in a bidentate manner within a Zn-finger complex are much less dynamic (43). The proteins we have studied here have no such cases, but we do see the almost permanent presence of interactions from a single arginine (R7) to two adjacent bases, and a similar double interaction involving an asparagine (N10) within the SRY complex.
Many of these interactions we have analyzed, both salt bridges and hydrogen bonds, not only break and reform regularly, but also involve changes in the DNA sites contacted by given amino acids. How much these fluctuations subsequently modify recognition of the DNA sequence varies: TBP is completely unaffected, SRY is moderately affected due to a single interface residue and P22 is significantly affected due to changes indirectly coupled to a single interface residue. At least for the complexes studied here, changes in amino acid interactions seem to have little impact on DNA conformation and where they modify sequence selectivity, this occurs because of the changes in direct amino-acid base interactions.
The case of P22 also underlines one limitation of our ADAPT sequence threading approach. While the ion distributions seen during the MD simulation clearly support the observed sequence preference in the center of the binding site (that is not directly in contact with the protein), these environmental effects cannot be taken into account by ADAPT that, for computational reasons, cannot deal with explicit ions or water molecules. However, the fact that ADAPT fails to predict any recognition in the central region of P22 also suggests that the changes in DNA geometry (involving a B → B' transition) that we indeed observe are not themselves sufficient to explain the associated sequence recognition.
Supplementary Material
Acknowledgments
The authors wish to acknowledge GENCI for a generous allocation of supercomputer resources at the CINES center in Montpellier.
SUPPLEMENTARY DATA
Supplementary Data are available at NAR Online.
FUNDING
ANR project CHROME [ANR-12-BSV5-0017-01]; Rhône-Alpes ARC 1 Santé Doctoral Grant (to L.E.). Funding for open access charge: ANR project CHROME [ANR-12-BSV5-0017-01].
Conflict of interest statement. None declared.
REFERENCES
- 1.Etheve L., Martin J., Lavery R. Dynamics and recognition within a protein-DNA complex. Nucleic Acids Res. 2016;44:1440–1448. doi: 10.1093/nar/gkv1511. [DOI] [PMC free article] [PubMed] [Google Scholar]
- 2.Esadze A., Li D.W., Wang T., Brüschweiler R., Iwahara J. Dynamics of lysine side-chain amino groups in a protein studied by heteronuclear 1H−15N NMR spectroscopy. J. Chem. Soc. 2011;133:909–919. doi: 10.1021/ja107847d. [DOI] [PubMed] [Google Scholar]
- 3.Anderson K.M., Esadze A., Manoharan M., Bru schweiler R., Gorenstein D.G., Iwahara J. Direct observation of the ion-pair dynamics at a protein–DNA interface by NMR spectroscopy. J. Am. Chem. Soc. 2013;135:3613–3619. doi: 10.1021/ja312314b. [DOI] [PMC free article] [PubMed] [Google Scholar]
- 4.Zandarashvili L., Esadze A., Iwahara J. NMR studies on the dynamics of hydrogen bonds and ion pairs involving lysine side chains of proteins. Adv. Protein Chem. Struct. Biol. 2013;93:37–80. doi: 10.1016/B978-0-12-416596-0.00002-6. [DOI] [PubMed] [Google Scholar]
- 5.Chen C., Esadze A., Zandarashvili L., Nguyen D., Pettitt B.M., Iwahara J. Dynamic Equilibria of Short-Range Electrostatic Interactions at Molecular Interfaces of Protein–DNA Complexes. J. Phys. Chem. Lett. 2015;6:2733–2737. doi: 10.1021/acs.jpclett.5b01134. [DOI] [PMC free article] [PubMed] [Google Scholar]
- 6.Nikolov D.B., Chen H., Halay E.D., Hoffman A., Roeder R.G., Burley S.K. Crystal structure of a human TATA box-binding protein/TATA element complex. Proc. Natl. Acad. Sci. U.S.A. 1996;93:4862–4867. doi: 10.1073/pnas.93.10.4862. [DOI] [PMC free article] [PubMed] [Google Scholar]
- 7.Murphy E.C., Zhurkin V.B., Louis J.M., Cornilescu G., Clore G.M. Structural basis for SRY-dependent 46-X,Y sex reversal: modulation of DNA bending by a naturally occurring point mutation. J. Mol. Biol. 2001;312:481–499. doi: 10.1006/jmbi.2001.4977. [DOI] [PubMed] [Google Scholar]
- 8.Watkins D., Hsiao C., Woods K.K., Koudelka G.B., Williams L.D. P22 c2 repressor-operator complex: mechanisms of direct and indirect readout. Biochemistry. 2008;47:2325–2338. doi: 10.1021/bi701826f. [DOI] [PubMed] [Google Scholar]
- 9.Paillard G., Lavery R. Analyzing protein-DNA recognition mechanisms. Structure. 2004;12:113–122. doi: 10.1016/j.str.2003.11.022. [DOI] [PubMed] [Google Scholar]
- 10.Deremble C., Lavery R., Zakrzewska K. Protein-DNA recognition: Breaking the combinatorial barrier. Comput. Phys. Commun. 2008;179:112–119. [Google Scholar]
- 11.Berman H.M., Westbrook J., Feng Z., Gilliland G., Bhat T.N., Weissig H., Shindyalov I.N., Bourne P.E. The Protein Data Bank. Nucleic Acids Res. 2000;28:235–242. doi: 10.1093/nar/28.1.235. [DOI] [PMC free article] [PubMed] [Google Scholar]
- 12.Lavery R., Zakrzewska K., Sklenar H. JUMNA (Junction Minimization of Nucleic-Acids) Comput. Phys. Commun. 1995;91:135–158. [Google Scholar]
- 13.Berendsen H.J.C., Grigera J.R., Straatsma T.P. The missing term in effective pair potentials. J. Phys. Chem. 1987;91:6269–6271. [Google Scholar]
- 14.Pearlman D.A., Case D.A., Caldwell J.W., Ross W.S., Cheatham T.E., DeBolt S., Ferguson D., Seibel G., Kollman P. AMBER, a package of computer programs for applying molecular mechanics, normal mode analysis, molecular dynamics and free energy calculations to simulate the structural and energetic properties of molecules. Comput. Phys. Commun. 1995;91:1–41. [Google Scholar]
- 15.Case D.A., Cheatham T.E., Darden T., Gohlke H., Luo R., Merz K.M., Onufriev A., Simmerling C., Wang B., Woods R.J. The Amber biomolecular simulation programs. J. Comput. Chem. 2005;26:1668–1688. doi: 10.1002/jcc.20290. [DOI] [PMC free article] [PubMed] [Google Scholar]
- 16.Cheatham T.E., 3rd, Cieplak P., Kollman P.A. A modified version of the Cornell et al. force field with improved sugar pucker phases and helical repeat. J. Biomol. Struct. Dyn. 1999;16:845–862. doi: 10.1080/07391102.1999.10508297. [DOI] [PubMed] [Google Scholar]
- 17.Pérez A., Marchán I., Svozil D., Sponer J., Cheatham T.E., Laughton C.A., Orozco M. Refinement of the AMBER force field for nucleic acids: improving the description of alpha/gamma conformers. Biophys. J. 2007;92:3817–3829. doi: 10.1529/biophysj.106.097782. [DOI] [PMC free article] [PubMed] [Google Scholar]
- 18.Dang L.X. Mechanism and thermodynamics of ion selectivity in aqueous-solutions of 18-crown-6 ether—a molecular dynamics study. J. Am. Chem. Soc. 1995;117:6954–6960. [Google Scholar]
- 19.Essmann U., Perera L., Berkowitz M.L., Darden T., Lee H., Pedersen L.G. A smooth particle mesh Ewald method. J. Chem. Phys. 1995;103:8577–8593. [Google Scholar]
- 20.Darden T., Perera L., Li L., Pedersen L. New tricks for modelers from the crystallography toolkit: the particle mesh Ewald algorithm and its use in nucleic acid simulations. Structure. 1999;7:R55–R60. doi: 10.1016/s0969-2126(99)80033-1. [DOI] [PubMed] [Google Scholar]
- 21.Berendsen H.J.C., Postma J.P.M., van Gunsteren W.F., DiNola A., Haak J.R. Molecular dynamics with coupling to an external bath. J. Chem. Phys. 1984;81:3684–3690. [Google Scholar]
- 22.Ryckaert J.P., Ciccotti G., Berendsen H.J.C. Numerical-integration of cartesian equations of motion of a system with constraints—molecular-dynamics of N-alkanes. J. Comput. Phys. 1977;23:327–341. [Google Scholar]
- 23.Lavery R., Moakher M., Maddocks J.H., Petkeviciute D., Zakrzewska K. Conformational analysis of nucleic acids revisited: Curves+ Nucleic Acids Res. 2009;37:5917–5929. doi: 10.1093/nar/gkp608. [DOI] [PMC free article] [PubMed] [Google Scholar]
- 24.Lavery R., Maddocks J.H., Pasi M., Zakrzewska K. Analyzing ion distributions around DNA. Nucleic Acids Res. 2014;42:8138–8149. doi: 10.1093/nar/gku504. [DOI] [PMC free article] [PubMed] [Google Scholar]
- 25.Pasi M., Maddocks J.H., Lavery R. Analyzing ion distributions around DNA: sequence-dependence of potassium ion distributions from microsecond molecular dynamics. Nucleic Acids Res. 2015;43:2413–2423. doi: 10.1093/nar/gkv080. [DOI] [PMC free article] [PubMed] [Google Scholar]
- 26.Goddard T.D., Huang C.C., Ferrin T.E. Visualizing density maps with UCSF Chimera. J. Struct. Biol. 2007;157:281–287. doi: 10.1016/j.jsb.2006.06.010. [DOI] [PubMed] [Google Scholar]
- 27.Pettersen E.F., Goddard T.D., Huang C.C., Couch G.S., Greenblatt D.M., Meng E.C., Ferrin T.E. UCSF Chimera–a visualization system for exploratory research and analysis. J. Comput. Chem. 2004;25:1605–1612. doi: 10.1002/jcc.20084. [DOI] [PubMed] [Google Scholar]
- 28.Case D.A., Berryman J., Betz R.M., Cerutti D., Cheatham T. III, Darden T., Duke R., Glese T., Gohlke H., et al. 2015. AMBER 2015.
- 29.Krause E.F. Taxicab geometry: An adventure in non-Euclidean geometry. Courier Corporation; 2012. [Google Scholar]
- 30.Ward J.H., Jr Hierarchical grouping to optimize an objective function. J. Am. Stat. Assoc. 1963;58:236–244. [Google Scholar]
- 31.Kaufman L., Rousseeuw P.J. Finding groups in data: an introduction to cluster analysis. John Wiley & Sons; 2009. [Google Scholar]
- 32.Murtagh F., Legendre P. Wards hierarchical agglomerative clustering method: which algorithms implement wards criterion? J. Classif. 2014;31:274–295. [Google Scholar]
- 33.R Development Core Team. 2009. R: a language and environment for statistical computing.
- 34.Crooks G.E., Hon G., Chandonia J.M., Brenner S.E. WebLogo: a sequence logo generator. Genome Res. 2004;14:1188–1190. doi: 10.1101/gr.849004. [DOI] [PMC free article] [PubMed] [Google Scholar]
- 35.Faiger H., Ivanchenko M., Cohen I., Haran T.E. TBP flanking sequences: asymmetry of binding, long-range effects and consensus sequences. Nucleic Acids Res. 2006;34:104–119. doi: 10.1093/nar/gkj414. [DOI] [PMC free article] [PubMed] [Google Scholar]
- 36.Parvin J.D., McCormick R.J., Sharp P.A., Fisher D.E. Pre-bending of a promoter sequence enhances affinity for the TATA-binding factor. Nature. 1995;373:724–727. doi: 10.1038/373724a0. [DOI] [PubMed] [Google Scholar]
- 37.Mathelier A., Zhao X., Zhang A.W., Parcy F., Worsley-Hunt R., Arenillas D.J., Buchman S., Chen C.-Y., Chou A., Ienasescu H. JASPAR 2014: an extensively expanded and updated open-access database of transcription factor binding profiles. Nucleic Acids Res. 2013;42:D142–D147. doi: 10.1093/nar/gkt997. [DOI] [PMC free article] [PubMed] [Google Scholar]
- 38.Badis G., Berger M.F., Philippakis A.A., Talukder S., Gehrke A.R., Jaeger S.A., Chan E.T., Metzler G., Vedenko A., Chen X. Diversity and complexity in DNA recognition by transcription factors. Science. 2009;324:1720–1723. doi: 10.1126/science.1162327. [DOI] [PMC free article] [PubMed] [Google Scholar]
- 39.Watkins D., Mohan S., Koudelka G.B., Williams L.D. Sequence recognition of DNA by protein-induced conformational transitions. J. Mol. Biol. 2010;396:1145–1164. doi: 10.1016/j.jmb.2009.12.050. [DOI] [PubMed] [Google Scholar]
- 40.Harris L.A., Watkins D., Williams L.D., Koudelka G.B. Indirect readout of DNA sequence by p22 repressor: roles of DNA and protein functional groups in modulating DNA conformation. J. Mol. Biol. 2013;425:133–143. doi: 10.1016/j.jmb.2012.10.008. [DOI] [PubMed] [Google Scholar]
- 41.Iwahara J., Esadze A., Zandarashvili L. Physicochemical properties of Ion Pairs of biological macromolecules. Biomolecules. 2015;5:2435–2463. doi: 10.3390/biom5042435. [DOI] [PMC free article] [PubMed] [Google Scholar]
- 42.Anderson K.M., Nguyen D., Esadze A., Zandrashvili L., Gorenstein D.G., Iwahara J. A chemical approach for site-specific identification of NMR signals from protein side-chain NH3+ groups forming intermolecular ion pairs in protein–nucleic acid complexes. J. Biomol. NMR. 2015;62:1–5. doi: 10.1007/s10858-015-9909-8. [DOI] [PMC free article] [PubMed] [Google Scholar]
- 43.Esadze A., Chen C., Zandarashvili L., Roy S., Pettitt B.M., Iwahara J. Changes in conformational dynamics of basic side chains upon protein–DNA association. Nucleic Acids Res. 2016;44:6961–6970. doi: 10.1093/nar/gkw531. [DOI] [PMC free article] [PubMed] [Google Scholar]
Associated Data
This section collects any data citations, data availability statements, or supplementary materials included in this article.


