Abstract
Reported here is a laboratory in vitro evolution (LIVE) experiment based on an artificially expanded genetic information system (AEGIS). This experiment delivers the first example of an AEGIS aptamer that binds to an isolated protein target, the first whose structural contact with its target has been outlined and the first to inhibit biologically important activities of its target, the protective antigen from Bacillus anthracis. We show how rational design based on secondary structure predictions can also direct the use of AEGIS to improve the stability and binding of the aptamer to its target. The final aptamer has a dissociation constant of ∼35 nM. These results illustrate the value of AEGIS-LIVE for those seeking to obtain receptors and ligands without the complexities of medicinal chemistry, and also challenge the biophysical community to develop new tools to analyze the spectroscopic signatures of new DNA folds that will emerge in synthetic genetic systems replacing standard DNA and RNA as platforms for LIVE.
INTRODUCTION
A quarter-century ago, in vitro selection and in vitro evolution were introduced as processes to generate receptors and ligands ‘on demand’ without the complexity of medicinal chemistry (1,2). These methods place libraries of nucleic acids under selective pressure, allowing only those that bind to a target to survive and be reproduced.
Notwithstanding the elegance of the idea, very few commercially successful aptamers have emerged from this process. This is often attributed to the paucity (relative to proteins) of building blocks and functional groups in a nucleic acid library. Accordingly, many groups have suggested adding functionality to the four standard building blocks to make GACT DNA more like proteins, and some success has been achieved with this approach (3–7).
Today, a few groups have begun to take the next step (8–11), adding replicable nucleotides to the DNA alphabet, creating a new molecular biology to support this expanded laboratory in vitro evolution (LIVE) (12), and developing the analytical chemical tools needed to sequence expanded DNA survivors that might emerge under selective pressure (13). Of particular promise are artificially expanded genetic information systems (AEGIS), which shuffle hydrogen-bonding groups within a Watson–Crick geometry to generate additional replicable nucleotides (14). For the GACTZP system, a substantial amount of supporting molecular biology and analytical chemistry has also been developed (12,13).
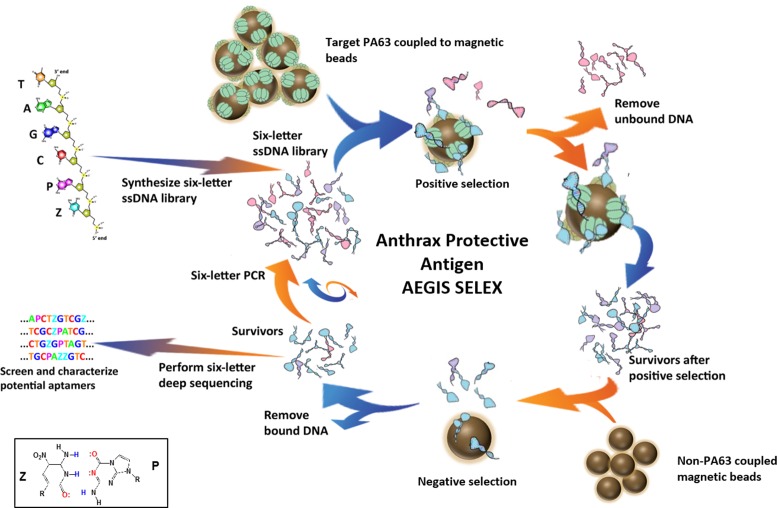
Here, we report the use of a six-letter GACTZP AEGIS-LIVE (Figure 1) to create aptamers against protective antigen (PA) PA63, the cleaved version of a precursor protein (PA83) that is produced by Bacillus anthracis, the causative agent of anthrax. Anthracis kills by a toxin built from three, individually nontoxic proteins: PA, lethal factor (LF) and edema factor (EF) (15,16). PA binds to two cell surface receptors (ANTXR1 or ANTXR2) to form an oligomeric translocase channel (17–19). This allows the other two components to translocate into the host cell. In the process, PA63 assembles into heptameric and octameric structures, forming pre-channels that bind to LF (lethal toxin complexes, LT) and EF (edema toxin complexes, ET). These are then endocytosed into an acidic compartment that triggers the transition of the pre-channel into a channel (19–25). This allows a consequent proton gradient to drive LF and EF unfolding and translocation (25). Associated translocation of ions can be measured in in vitro systems as a way of assaying this process (19,26).
Figure 1.
Schematic representation of Anthrax Protective Antigen AEGIS SELEX strategy. See main text for description of selection steps. Bottom left insert: molecular structures and hydrogen-bonding pattern for the Z:P pair.
The aptamers developed by AEGIS-LIVE are shown here to bind to their PA63 target but not to the PA83 precursor. Further, we show that they compete with other factors of the toxin for binding to PA63, inhibiting their ability to block the translocation of ions through the toxin channel and possibly inhibiting their subsequent release inside the infected cell. Thus, this is not only the first AEGIS aptamer selected to bind an isolated target, but also the first shown to inhibit a biologically relevant behavior of its target and the first aptamer of any kind that does this for PA63.
MATERIALS AND METHODS
Materials
Standard oligonucleotides were purchased from IDT. PA from B. anthracis in its holo form (PA83) and cleaved form (PA63) where purchased from List Biological Laboratories, or prepared in the Krantz laboratory by heterologous expression of a recombinant gene (21).
Oligonucleotide synthesis
Oligonucleotides and library containing AEGIS nucleotides were prepared as previously reported (10,11). The randomized sites in the library were prepared by coupling with a 1:1:1:1:1:1 mixture of the six (GACTZP) nucleoside phosphoramidites. The synthetic oligonucleotides and library were purified on denatured polyacrylamide gelelectrophoresis (PAGE) (7 M urea), and then desalted using Sep-Pac® Plus C18 cartridges (Waters).
In vitro selection scheme
The AEGIS-LIVE experiment was performed on a synthetic library of GACTZP oligonucleotides containing 25 randomized positions flanked by two primer binding sites (59 nt in length, 5′-AGAGAGCGTCGTGTGGA-N25-TGAGGAGGTGCGCAAGT-3′).
PA was presented immobilized on magnetic beads (Dynabeads M-270 Carboxylic Acid, Invitrogen), binding oligonucleotides were recovered magnetically and AEGIS-PCR (10,11) with a single biotinylated primer was performed directly on survivors bound to the bead-coupled PA63. Following amplification, single-stranded DNA was recovered with streptavidin immobilized on magnetic beads (Dynabeads M-270 Streptavidin, Invitrogen) and used in the next round of selection. The initial step was a negative selection on the magnetic beads lacking PA.
For each cycle, binding reactions were carried over for 30 min at RT. Negative cycle I and cycle I of the selection were performed using 1 nmole library and 3 nmoles PA63; all other cycles were performed with 150 pmoles ssDNA and 800 pmoles PA63. In vitro selection included fourteen cycles, at which point the library was prepared for conversion and deep sequencing.
AEGIS-DNA to standard DNA transliteration for high-throughput sequencing
Survivors of Cycle XIV were divided in two aliquots and polymerase chain reaction (PCR) amplified under conditions that transliterated (10,13) the Z:P pairs to C:G or T:A pairs in approximately equal amount. Translitation from Z:P to C:G used the following conditions: 0.4 μM each primer, 0.01 mM dZTP, 0.4 mM each dC/dGTP, 0.04 mM each dA/dTTP, 20 mM Tris–HCl pH 8.8, 10 mM (NH4)2SO4, 10 mM KCl, 2 mM MgSO4, 0.1% Triton® X-100, 0.1 U/μl JumpStart Taq Polymerase (Sigma-Aldrich). Conversion from Z:P to T:A had the following conditions: 0.4 μM each primer, 0.4 mM dPTP, 0.04 mM each dC/dGTP, 0.4 mM each dA/dTTP, 10 mM Tris–HCl, pH 8.3, 50 mM KCl, 1.5 mM MgCl2, 0.001% (w/v) gelatin, 0.1 U/μl JumpStart Taq Polymerase.
Tags and barcodes were then added by 12 cycles of PCR with tagged primers. The amplified products were purified by native PAGE, recovered by gel-extraction and the collection of amplicons was submitted for Ion Torrent deep sequencing, according to the sequencing center guidelines.
High-throughput sequencing
Ion torrent analysis was performed as previously reported (10,11). In brief, after discarding sequences present at 20 or fewer copies, or with incomplete barcodes and/or priming sequences, the remaining reads (∼2 × 10⁶ in total) were clustered using a custom algorithm that considered only the variable 25 nt region. Sequence clusters were created in a step-wise process by grouping those with a single base change between sequence reads, starting with the most common read and proceeding toward the least common, iterating until all sequences were grouped. Clustered sequences were then separated into sets by barcode, and variable sites were compared between each set.
Filter binding assays
5′-32P-labeled aptamer (1 μl each) was denatured/renatured in 1× PBS (30 μl), and incubated (45 min, RT) with increasing concentrations of PA63 or PA83, from 0 to 12 μM. To capture the PA and PA-aptamer complex, aliquots (5 μl) from each binding reaction were spotted on a nitrocellulose membrane on top of a charged nylon membrane (Whatman) in a dot-blot minifold vacuum device (Millipore) (27). Membranes were washed three times (each 30–50 μl 1× PBS), air-dried, exposed to a phosphorimager screen (10–45 min) and read by a Personal Molecular Imager (PMI) phosphorimager (BioRad). Scans were quantified using the QuantityOne program (BioRad). Fractions of aptamer bound were calculated by dividing the amounts of DNA bound to the nitrocellulose membrane by the total amount of DNA present in the two membranes for the same spot. Fractions of DNA bound were plotted versus protein concentration and fitted with the program Kaleidagraph (Synergy softwares) to an exponential equation of the type y = m1 + [x/(m2 + x)], where y is the fraction of DNA bound at protein concentration x, m1 is the concentration of DNA at the plateau, and m2 is Kdiss.
Determination of the affinity constant with bead-based assay
After being coupled to PA63 (∼1.6 nmoles), the beads (200 μl, as during selection) were divided into aliquots (20 μl each) and each fraction was incubated with increasing concentrations of pre-folded cold aptamer PA1, spiked with 1 μl (>13 pM) of 5′32P-PA1. Binding mixtures were tumbled (RT, 45 min) and the beads were recovered with a magnet. The supernatant was collected for cpm reading. Beads were washed two times with 100 μl 1× binding buffer (1× PBS), and all the fractions were separately read with liquid scintillation.
The reciprocal of the fraction of PA molecules on the beads that have one aptamer bound (P0/C in Supplementary Figure S2) was calculated and plotted versus the reciprocal of aptamer concentration (1/[A]), giving a line the slope of which represents Kdiss.
Enzymatic footprinting
For DNase I digestion of PA1 and PA1T4 in the presence of PA63 or PA83, the aptamer was denatured (85°C, 5 min) followed by slow (0.1°/s) cooling to 24°C to allow refolding. 5′32P-PA1 with 0–5 μM PA63 or PA83 was incubated with tumbling for 45 min, and then treated with DNase I nuclease (15 min at RT). The digested products were resolved on 18% denaturing PAGE. Gels were dried on a gel-dryer, exposed overnight to a phosphorimager screen and scanned on a PMI as described above.
Circular dichroism
Measurements were performed using a JASCO-1500 CD Spectrometer. Aptamer samples were dissolved in water or PBS buffer. The concentration of DNA aptamers was 5 μM. Three scans from 180 to 320 nm at 1 nm intervals were accumulated with a scan rate of 100 nm min−1 and averaged (Path length = 1 mm). All measurements were done at 25°C. Data were plotted with Kaleidagraph software (Synergy Softwares).
Bead-based binding assay on CMG2–PA complex
PA63 (1 nmole) was incubated with biotinylated Capillary MorphoGenesis protein 2 (CMG2, 1 nmole) in buffer (20 mM Tris pH 7.5, 1 mM MgCl2) at RT to give PA63–CMG2 complex (1 nmole). This was coupled with streptavidin-coated magnetic beads (300 μl, Invitrogen).
Unlabeled aptamer spiked with 0.1 nM 5′-labeled aptamer was added at increasing concentrations to complex-beads aliquots, and the mixtures were incubated at RT (45 min). The supernatants were then collected, the beads were washed twice (1× PBS), and all fractions were dissolved in scintillation cocktail for cpm reading. For each aptamer concentration, percent binding was calculated and transformed in bound aptamer concentration assuming 0.1 nM (the concentration of labeled species) = 100%. For each aptamer, data were plotted in a non-linear regression fitted to an equation of the type a + (x)/(b+x), where x is the aptamer bound, a is maximum binding, and b is the Kdiss of the aptamer.
Electrophysiology assays
LF N-terminal domain (LFN) and PA were expressed and purified as described (21). To form heptameric PA oligomers, PA was nicked with trypsin (1:1000 w/w) at room temperature in buffer (20 mM Tris–Cl, pH 8) for 10 min, and the cleavage reaction was stopped by adding 1:100 w/w soybean trypsin inhibitor. The nicked PA was then purified by a 0.5 M NaCl gradient on Q-Sepharose anion exchange chromatography using 20 mM Tris–Cl, pH 8 buffer. The peak at 350 mM NaCl arose from PA heptamer, which was pooled, concentrated and divided into aliquots for storage (−80°C).
For the electrophysiology assays, planar lipid bilayer currents were recorded using an Axopatch 200B (21,27). Membranes were painted on a 50 μm aperture of a 1 ml, white-Delrin cup with 3% 1,2-diphytanoyl-sn-glycerol-3-phosphocholine in n-decane. Membranes were bathed in either bilayer buffer (BB: 5 mM succinate, 5 mM phosphate, 1 mM ethylenediaminetetraacetic acid (EDTA)) or bilayer chloride buffer (BClB: 5 mM succinate, 5 mM phosphate, 1 mM EDTA, 100 mM potassium chloride). Ensemble recordings were made at 100 Hz. Δψ ≡ ψcis − ψtrans (ψtrans ≡ 0 V).
Ensemble equilibrium binding:
A prior method (28) was used to monitor LFN binding to PA channels at symmetrical pH and a Δψ of 0 mV by means of an applied KCl gradient. A bilayer was formed in a 50 μm white-Delrin cup. The cis chamber was bathed in BClB, pH 5.6 while the trans chamber was bathed in the low-electrolyte BB at pH 7.6. PA channels were inserted by adding 2 pmol of PA7 to the cis chamber at pH 5.6. Upon stabilization of the ensemble current, the cis chamber was perfused to exchange fresh BClB at pH 7.6 to maintain the neutral pH conditions, pHcis and pHtrans were 7.6. PA1T4 aptamer was added to the cis chamber with stirring. Then LFN was added in small increments to the cis side of the membrane, allowing for binding to reach equilibrium as indicated by the observed decrease in current. Fraction of closed channels (θobs) versus [LFN] plots were first fit to a simple single-site model, θobs = 1/(1 + Kd/[LFN]), to obtain an equilibrium dissociation constant, Kdiss. The single-site binding model failed in fitting the data in some cases and yielded systematic deviations. A cooperativity model was tested to better pinpoint the mechanism. Cooperativity was estimated using the empirical Hill equation, θobs = 1/(1 + (Kd/[LFN])n). This model was used to approximate the Hill coefficient, n.
RESULTS
In-vitro selection of AEGIS-aptamers against B. anthracis protective antigen (PA)
Magnetic bead-based LIVE procedures were applied to a library containing a 25-nt GACTZP randomized region. Before entering the first selection cycle, a counterselection (also referred to as negative cycle) was performed against mock-coupled magnetic beads in the coupling buffer. This was designed to remove oligonucleotides that non-specifically bound to the beads. The remainder of the LIVE was performed as outlined in Figure 1. Following contact of the library with PA63 target immobilized on the magnetic beads and washing, the captured oligonucleotides were directly amplified using AEGIS GACTZP six-letter PCR with biotinylated reverse primers. The resulting double-stranded DNA (dsDNA) was captured by streptavidin-coated magnetic beads, and the amplified single-stranded DNA (ssDNA) for the next cycle was released in base. Negative selections were repeated after cycles 2, 5 and 12 to maintain survivors specific for the target, and avoid binders for the magnetic beads. After 14 LIVE cycles, substantial amount of the survivor mixture bound PA63-beads (Supplementary Figure S1). Therefore the LIVE was stopped, and the survivor mixture was prepared for transliteration and deep sequencing. The six most represented sequences and their frequency are reported in Supplementary Table S1.
The survivor sequences had several interesting features. First, although the starting library was chemically synthesized to contain ∼17% Z nucleotides (see ‘Materials and Methods’ section), no sequences contained Z. This was not the first time that this was observed; other AEGIS GACTZP LIVE experiments produced many successful aptamers containing only P residues. However, these experiments differed from these other experiments in that the latter experiments also produced many survivors that has one or more Z's (10–11,29). Further, a single sequence dominated the output, corresponding to ∼96% of the sequence reads. This candidate aptamer was named PA-Apt1, or PA1. PA1 contained two dP nucleotides separated by seven standard nts inside of an otherwise very G-rich sequence. PA1 was then synthesized by solid phase phosphoramidite chemistry. PA3, the next most frequently found AEGIS sequence, was also chemically synthesized. However, in subsequent binding assays, it failed to bind (data not shown) and was not examined further. The leakage of this non-binding sequence throughout the selection should not be of great concern, as it is represented in the sequenced pool at only ∼1% the level of the binding species.
Computational analysis to support truncation and mutation experiments
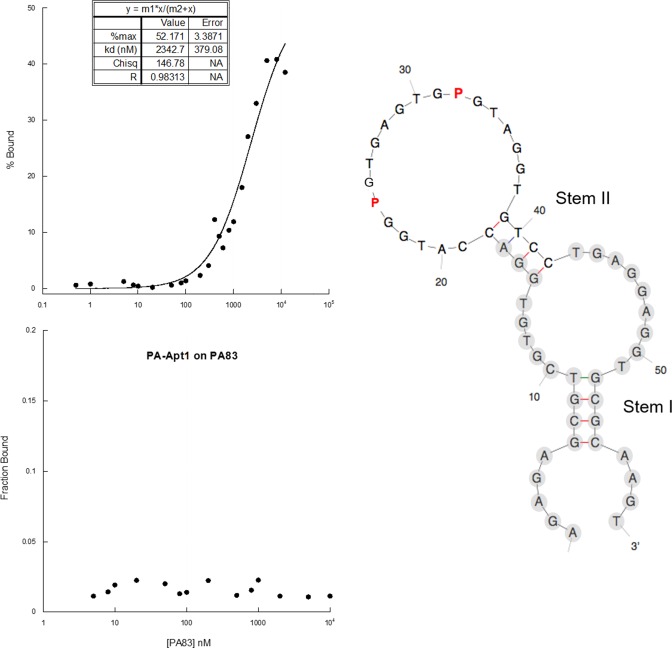
The PA1 sequence was analyzed by the secondary structure prediction software Kinefold (28) to gain preliminary insights into its folding; P was replaced by G in this initial analysis. The software suggested a mostly single stranded fold with two 4 bp double stranded regions (Figure 2). Interestingly, the G-rich region containing the two non-standard nucleotides appeared to form a large loop on top of the second stem. This suggested the presence of some form of higher-level three-dimensional folding beyond simple base-pairing, such as G-quadruplex structures, as seen previously for other aptamers (30,31).
Figure 2.
PA-Apt1 2D predicted structure and binding to PA. (Left) Percentage of aptamer bound versus PA63 (upper graph) or PA83 (lower graph) concentration obtained in by filter binding assays. The inset in PA63 plot shows calculated binding parameters. Binding parameters for PA83 could not be calculated because signals were below detection level. Plotted are the mean values of three filter-binding assay replicas. (Right) The predicted secondary structure of the PA-Apt1 calculated with KineFold. Nucleotides in the primer binding regions are in light gray circles.
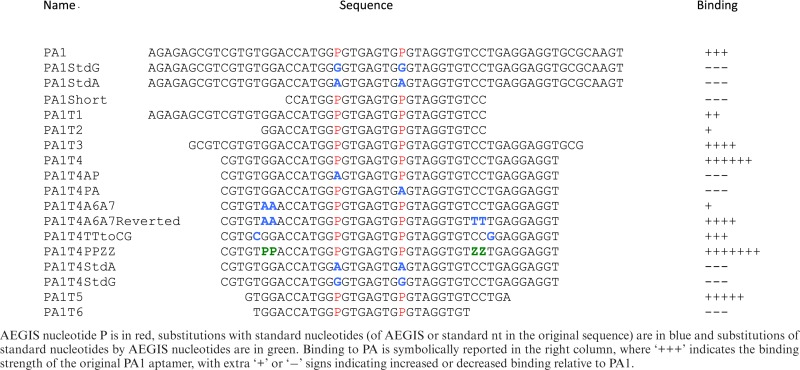
Several PA1 truncations and mutations aimed at testing sequence requirements and reliability of predicted 2D-structure (Supplementary Figure S2) were then designed. Table 1 collects the full sequences for these aptamers. Each of these oligonucleotides were then prepared by chemical synthesis, together with standard ACTG control aptamers presenting Gs or As in place of Ps.
Table 1. Sequence of aptamer PA1 generated in this laboratory in vitro evolution (LIVE) experiment, and its truncated/mutated forms studied.
|
Assessing binding of PA1 aptamer to PA63 with magnetic beads or with nitrocellulose filters
The full-length synthetic 5′-labeled PA1 aptamer was found to bind to fresh samples of bead-immobilized PA63 with a Kdiss of 308 nM (Supplementary Figure S2). Using a less expensive two-layer filter-binding assay (FBA), a weaker binding (2.3 μM) was measured. In the FBA, a first nitrocellulose layer binds the PA63 together with the bound radiolabeled PA1 aptamer. A cationic nylon layer placed beneath the nitrocellulose layer captures unbound PA1, and the ratio of radioactivity in the two layers is used to estimate the affinity. The difference in affinity in the two methods was attributed to the fact that the bound aptamer might reduce protein interactions with the membrane. This notwithstanding, the lower cost of the FBA motivated us to use it to follow, in high throughput mode, the improvement of Kdiss via truncation and/or mutation, under the assumption that the FBA reproduces the relative affinities.
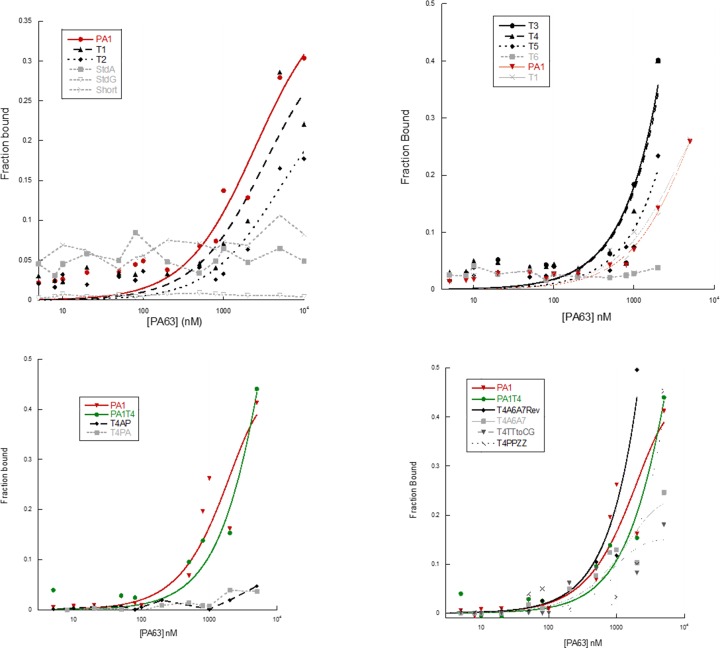
Results of these filter binding assays are reported in Figure 2 (left, upper graph) and Figure 3. Binding parameters are presented in Table 2 and, schematically represented in the right column of Table 1.
Figure 3.
Plots of normalized filter binding assay results for all aptamers except PA1T4StdA and PA1T4StdG, for which binding was below the detection level. PA1 (top two graphs) and PA1 + PA1T4 (bottom two graphs) are always present in the experiment, where they serve as a reference for binding of the original aptamer. Plotted are the mean values of three filter-binding assay replicas.
Table 2. Kinetic parameters of all aptamer variants tested, as obtained by filter binding.
| Aptamer | Observed kd (nM) | Fraction max |
|---|---|---|
| PA1 | 2342.7 | 0.52 |
| PA1StdG | — | — |
| PA1StdA | — | — |
| PA1Short | — | — |
| PA1T1 | 3268.4 | 0.35 |
| PA1T2 | 4803.0 | 0.28 |
| PA1T3 | 1619.6 | 0.48 |
| PA1T4 | 50.2 | 0.42 |
| PA1T4AP | — | — |
| PA1T4PA | — | — |
| PA1T4A6A7 | 2288.0 | 0.36 |
| PA1T4A6A7Rev | 189.5 | 0.43 |
| PA1T4TTtoCG | 162.0 | 0.59 |
| PA1T4PPZZ | 35.5 | 0.50 |
| PA1T4StdG | — | — |
| PA1T4StdA | — | — |
| PA1T5 | 1446.0 | 0.27 |
| PA1T6 | — | — |
— indicates that binding was below detection level.
Some of the primer binding site regions are necessary for binding activity
We then asked whether the primer binding sequences (pbs), which could not evolve during AEGIS-LIVE, were necessary for binding in the filter-binding assay. When the pbs were removed entirely (PA1Short), binding ceased (Figure 3, upper left, dashed line with open triangles). However, when the pbs were removed less aggressively, binding remained or improved. Indeed, stepwise removal of the flanking regions initially increases the affinity in the FBA (Table 2, see PA1T3, PA1T4) before it decreases (PA1T5) and then eliminates binding (PA1T6). Complete removal of the 3′-pbs, leaving the 5′-region intact, diminished, but did not abolish binding (PA1T1). When, taking another step, most of the 5′-pbs was also removed, binding decreased further (PA1T2). This suggests that part, but not all, of the conserved primer binder flanking sequences are important for folding and/or binding. The limits for minimal binding are at nts 15–42 (see PA1T2 versus PA1Short or T6), and binding activity increases markedly when 2–3 unpaired nts are retained at positions 13 and 14 and positions 43 and 44 before and after Stem II (see T5 binding versus T1). Further, predicted Stem I is evidently not needed for folding of the active aptamer conformation. Based on these results aptamer PA1T4 (nts C10 to T51) was the shortest molecule showing the best binding activity, with a Kdiss of ∼50 nM. This truncated aptamer PA1T4 was studied further.
Both AEGIS P's are necessary for binding
We then explored sequence requirements for binding by replacing AEGIS P with standard nucleotides, applying this to both PA1 and PA1T4. Significantly, both AEGIS P's are essential for binding in both aptamers. This was shown by the negligible binding seen when both P's are replaced by A or G in the full length aptamer (PA1StdA and PA1StdG) and the optimally truncated aptamer (PA1T4StdA and PA1T4StdG). Further, individually replacing the P's by A in the optimally truncated aptamer (PA1T4AP and PA1T4PA) also completely destroyed binding (Table 1 and Figure 3). These effects might be due to a direct role of the two P's in contacting the protein, and/or to an indirect role of the modified nucleotides in preventing alternative, non-binding conformations of the aptamers.
The aptamers are specific
Even though the LIVE was performed with PA63, it was possible that selected aptamers might bind to the same epitope on its precursor, PA83. To test this hypothesis, filter binding assays were performed with the parent PA1 (Figure 2, left bottom graph) and the optimally truncated PA1T4 (data not shown) on PA83. For both, binding was too weak to detect, indicating that both PA1T4 and its parent molecule PA1 bind an epitope located in the region of PA83 that becomes exposed only after the 20000 Dalton portion is removed. This suggests a role for these aptamers in specifically binding the active conformation of the protein, possibly preventing LT/ET complex formation, pre-channel to channel transition and the successful infection of the host cell.
DNase I footprinting
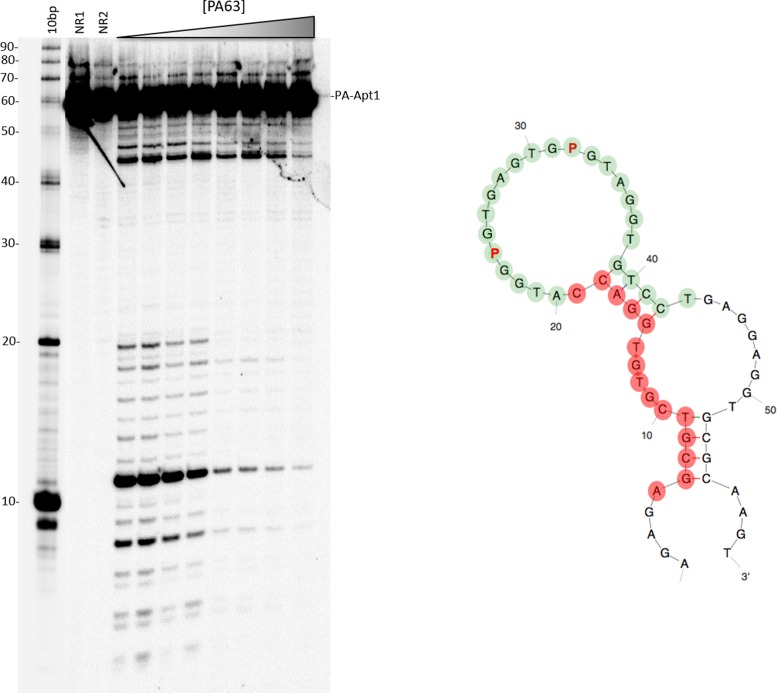
DNase I footprinting was then applied to refolded 5′-32P-labeled aptamers PA1 (Figure 4) and PA1T4 (data not shown). Unexpected for a species with a large loop as predicted by Kinefold, the aptamers overall were remarkably stable against DNase I digestion. DNase treatment easily removed up to 19 nt from the 5′-end of PA1 and up to 9 nts from the 5′-end of PA1T4. Additional digestion bands appeared at approximately nt 43 (PA1) and nt 33 (PA1T4) and downstream toward the 3′-ends of the molecules. These results suggest that both the truncated aptamer PA1T4 and its parent PA1 have a highly stable structured core in the ‘loop’ that is inaccessible to DNAse I nuclease. This core appeared to be in the same position for both molecules. Thus, the DNase experiment is consistent with neither species having a freely accessible loop.
Figure 4.
DNase I footprinting of PA-Apt1 (PA1). Left: denaturing PAGE of PA-Apt1 DNase I digestions in the presence of increasing concentrations of PA63. First lane: 10-bp DNA ladder with nucleotide numbering on the left. NR1: native PA1, non-reacted. NR2: folded PA1, non-reacted. Position of full-length PA-Apt1 is indicated on the left. Right: PA63-protected nucleotides mapped on the predicted 2D structure of PA1. Green dots: nts of the highly structured ‘core’ aptamer, DNase I-resistant regardless of the presence of PA63. Red dots: positions on the molecule that become protected upon binding to PA63. The 3′ protection boundary is to be regarded as +/− 1 nts due to the lower resolution of the bands on this side of the gel.
When PA63 was added, additional portions of the molecule became resistant to nuclease digestion. In particular, the 5′-portions of both aptamers and a few extra nucleotides on the 3′ side showed increased protection from DNase I degradation upon addition of increasing PA63. Thus, PA63 further protects the aptamers in regions outside the core. Interestingly, and in agreement with binding results, this added protection was not observed when PA83 was added to the digestion reactions (data not shown).
These results indicate contact regions for the binding of the aptamers to PA63. They also suggest that these molecules are good candidates for applications, due to their ability to bind their target, their ability to be protected by binding from nuclease degradation and their resistance to nuclease degradation over a large part of their structures.
Analysis of possible higher-order structures: G-quadruplex predictions and circular dichroism
As mentioned, the fact that the Kinefold-predicted ‘loop’ was extremely stable to nuclease digestion suggested the presence of higher order structures. Based on the G-rich feature of this loop, we applied the program QGRS Mapper (Quadruplex forming G-Rich Sequences) (32) to map possible quadruplex-forming G-patterns. Here, the P's were substituted with G's. QGRS Mapper returns all possible G-quadruplex conformations in a sequence, each with a G-score to estimate the likelihood of a stable G-quadruplex for that conformation. QGRS Mapper predicted several alternative G-quadruplex patterns (Supplementary Table S2). Interestingly, for all patterns but one, including the one with the higher G-score, P-sites were predicted to participate in the quadruplex planes. Only one pattern (marked with a yellow star in Supplementary Table S2) predicted a G-quadruplex structure formed without the involvement of P-sites. This is also the only possible pattern predicted by the program when P's are substituted with A's, instead of G's. This particular pattern, and several others in the prediction, includes a G pair that is present in Stem I, whose presence in the active conformation was confirmed by mutational analysis. It is thus unlikely that the potential G-quadruplex formed by these patterns is involved in the active binding conformation of the aptamer.
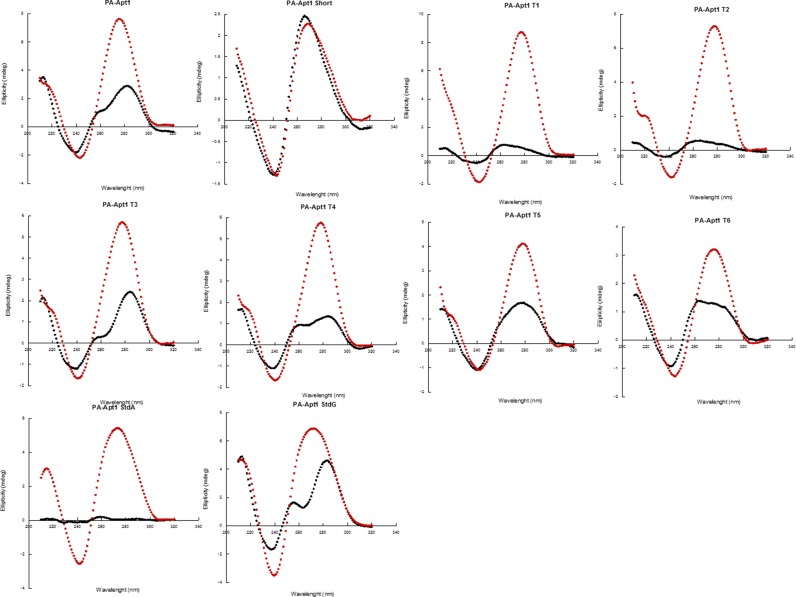
Circular dichroism experiments were then performed on aptamers PA1, PA1T1 through T6 and on PA1 standards A and G to assess the presence of cation-dependent structures in the folded molecules (Figure 5). For all of the aptamers tested, except PA-Apt1Short, addition of PBS enriched with KCl caused a large increase in CD signal, which is consistent with the formation of G-Q like, and other structured foldings. This was observed not only for all aptamers that show some level of binding, but also for PA1StdA and PA1StdG, which did not bind PA63, again supporting the presence in the aptamers of a highly structured core that is independent of the target. Interestingly, PA-Apt1 short, which completely lacks Stem II and could thus be regarded as a linear, unstructured molecule, did not show any CD signal change upon addition of cations. These results support the idea that both the presence of Stem II and of the two P's in the loop are essential for binding to the target. Here, speculatively, the synergic folding of Stem II and the highly structured loop would position the P's correctly to make the right contacts with the target.
Figure 5.
PA-aptamer variants’ CD signals are indicative of highly structured foldings. Circular dichroism spectra for aptamers PA1, T1 through T6 and PA1 standards tested before (black line) and after (red line) addition of PBS with high Na+ and K+ concentrations.
Interestingly, the aptamers show maxima in their CD spectra as ∼275 nm. Their spectra lack both 260 and 290 nm peaks typical of parallel and antiparallel G quadruplexes, respectively, or other peaks easily attributable to known foldings. We argued that this could be attributed to the formation of a mixture of parallel and antiparallel G4s, so as to create a signal between 260 and 290 nm, although we didn't find similar cases in literature. As another possibility, the presence of P's may create a distortion, or a new super compact structure that is different from any previously described folding.
These results show that the loop region of aptamer PA1 and its active truncations/optimizations adopt a higher order (and possibly never previously seen) fold. Further, it cannot be excluded that a less-stable G-quadruplex could form that involves P's in its planes, less-stable because of the lack of one hydrogen bond from P. Clearly, x-ray diffraction, nuclear magnetic resonance or other biophysical methods must be applied to learn about these spectroscopically exceptional folds.
Binding of the aptamers can be improved by fold prediction and AEGIS rational modification
Kinefold predicted two stems in the PA1 aptamer (Figure 2). Truncation experiments suggested that the external stem (Stem I) is not necessary, while Stem II is. This model was confirmed by compensatory nucleotide replacements in Stem II. Replacements that disrupted the hypothesized base-pairing in Stem II eliminated activity, while double replacements restoring the stem also restored the binding activity (see PA1T4A6A7 and PA1T4A6A7Reverted). On the other hand, elongating the stem with a strong C:G nucleobase pair reduces activity (PA1T4TTtoCG).
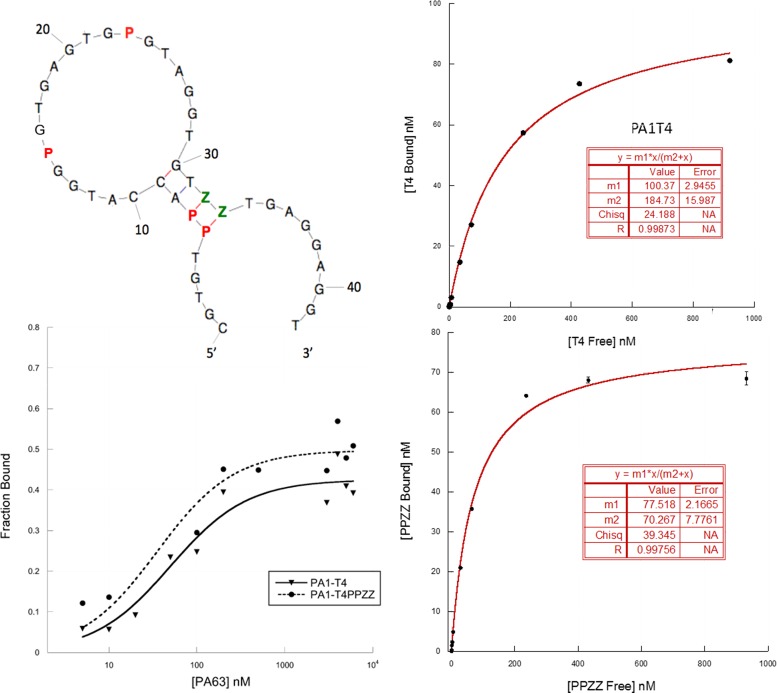
Based on this model, we sought to improve the stability of the presumed active fold by replacing two adjacent G:C pairs in Stem II by two stronger P:Z pairs (aptamer PA1T4PPZZ). As expected from the design, PA1T4PPZZ showed the best activity among the molecules tested, with a measured Kdiss in filter-binding assays of 35 nM (Figure 6). From these results, we infer that aptamer PA1T4PPZZ 2D-3D conformation includes a stem-loop were the precise twisting and stability of the first is needed for the correct positioning of the P-containing, highly structured folding of the loop in the epitope of PA PA63.
Figure 6.
PA1T4-PPZZ optimized AEGIS aptamer against Anthrax protective antigen (PA) PA63. Left, upper: predicted 2D structure and location of P's (red) and Z's (green) non-standard nucleotides. Left, lower: binding on PA63 of PA1T4-PPZZ AEGIS-enriched aptamer compared to its AEGIS-selected, truncated parent molecule. PA1T4-PPZZ presents an observed Kdiss of 35 nM for PA63. Right: binding of PA1T4 (upper) and PA1T4PPZZ (lower) to CMG2–PA63 complex, and binding parameters (inserts).
Binding to the complex between PA and CMG2
A bead-based binding experiment was performed on PA1T4 and PA1T4PPZZ to test their ability to bind PA63 when the protein is already associated with its receptor CMG2 (Capillary MorphoGenesis protein 2, also known as ANTXR2). PA63 was allowed to interact with biotinylated CMG2 before coupling the latter to streptavidin-coated magnetic beads. At this point, increasing concentrations of folded cold aptamers spiked with 0.1 nM 5′-32P-labeled counterparts were added to the complex bound to the beads and allowed to bind for 45 min at RT. Subsequently, supernatants were collected, beads washed twice with 1× PBS and all fractions were read at the scintillation counter. For each aptamer concentration, percent binding of the labeled species was calculated by counting cpm of bound molecules, dividing by total cpm for that sample (bound + supernatant + washes), and multiplying by 100. Percent binding was then transformed in bound aptamer concentration assuming 0.1 nM (the concentration of labeled species) = 100%. For each aptamer, data were plotted in a non-linear regression fitted to an equation of the type a*x/(b+x), where a is maximum binding and b is the Kdiss of the aptamer.
As shown in Figure 6, both aptamers bind their targets in association with their natural receptor. Binding affinities were comparable to the ones for the target free in solution (187 nM Kdiss for PA1T4, 70 nM Kdiss for PA1T4PPZZ). These results suggest that our aptamers, and especially engineered AEGIS aptamer PA1T4PPZZ, bind PA63 when PA63 is already bound to its cell receptors. This is consistent with a potential application in vivo.
Binding competition with anthrax lethal factor (LF)
Aptamers are most interesting, of course, if binding to their target has an impact on a biologically measurable activity. Thus, we asked whether the optimally truncated AEGIS aptamer would, in addition to binding PA63, interrupt such an activity. Accordingly, electrophysiology assays were performed to detect competition of PA1T4 with LF for binding to PA63 by testing whether the aptamer inhibited LF binding to PA when it is in the channel state. In a planar lipid bilayer assay, PA was inserted into a planar bilayer and the buffer was exchanged to neutral pH. Then, LF's amino-terminal domain (LFN) was titrated to block the current passing through the PA channels. LFN titrations were then performed in the presence of aptamer PA1T4.
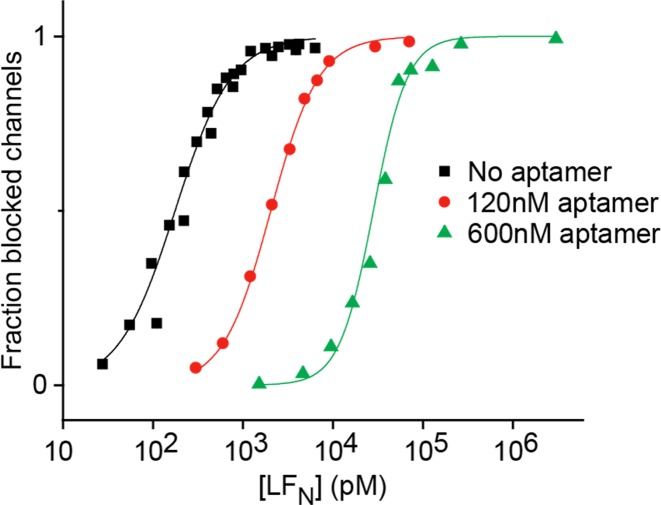
As a positive result, LFN bound to PA with substantially weaker affinity in presence of the optimally truncated aptamer (Figure 7). The binding affinity of LFN decreased further with an increase in DNA aptamer concentration. This was shown by the increase in LF concentrations needed to block the current through the channels with increasing aptamer concentration. The equilibrium dissociation constant (Kdiss) for LFN binding to PA in absence of PA1T4 was 176 (±10) pM. In contrast, with aptamer concentrations increasing to 120 and 600 nM, the measured Kdiss increased 10- and 160-fold (respectively) to 2.038 (±0.002) nM and 28 (±3) nM.
Figure 7.
Equilibrium binding competition between LFN and PA1T4 aptamer on PA. Ensemble binding of LFN to PA channels at identical pH 7.6 on both sides of the membrane, with ‘cis’ KCl at 100 mM [added KClcis] and ‘trans’ KCl at 0 mM [added KCltrans] in the absence of the aptamer (black squares), and in the presence of the aptamer at 120 nM (red circles) and 600 nM (green triangles). Curves are fit to a Hill cooperativity model.
Binding cooperativity was evident in these fits. The Hill coefficient was estimated to be 1.40 (±0.08) when no aptamer was present. However, when aptamer was present, the observed Hill coefficient increased to 1.634 (±0.002) and 2.3 (±0.4) for 120 and 600 nM DNA aptamer, respectively. These results also provide indirect evidence that PA1T4 does not interrupt the current through the channels once bound to PA63.
DISCUSSION
In this paper, we report the in vitro evolution and characterization of an AEGIS-based DNA aptamer that binds to anthrax PA (PA63). This aptamer is novel in many ways, in addition to its being selected from an expanded genetic alphabet using the molecular biology and analytical chemistry that has been developed to support it.
First, it is the first example of an AEGIS-LIVE to target an isolated protein. Further, it delivered the first AEGIS aptamer that has an impact on a biologically interesting property of its target. The AEGIS aptamer competes with the binding of LF to PA63, displacing LF from PA63. Further, once bound, it inhibits the ion flux through the channel, possibly by obstructing it.
Since the target is well characterized, standard experiments can be done to explore and define the fold of the aptamer and its contact with the target. The ‘loop’ (as predicted by standard folding predictors) is in fact quite resistant to nuclease digestion, implying that it has a tightly folded structure. The circular dichroism signal changes upon addition of specific cations. This is reminiscent of CD spectra seen for G-quadruplexes and other higher level folds in the literature, structures that (of course) do not contain the non-natural nucleobase P. However, the CD spectra here cannot be assigned to any known G-rich fold in natural DNA. Thus, it is not unreasonable to speculate that this loop adopts a new type of super-fold, perhaps analogous in structure to a G-quadruplex. The result, therefore, suggests a new challenge for biophysicists in the emerging world of synthetic biology; how do we expand the use of spectroscopy to explore a new world of folds potentially generated by expanded artificial DNA.
This notwithstanding, the data reported here provide direct evidence that the aptamer makes contact to its target and where. Nuclease footprinting shows that the target stabilizes the stem in addition to the (mis)predicted ‘loop’, which is already quite stable. This is a prelude to crystallographic studies, which are under way. Especially interesting is the absence of Z in the aptamer. It is well known that conformational ambiguity is a limiting factor in the performance of many functional DNA molecules (33). Here, it may be that the two P's in the aptamer, which are necessary for binding, are necessary because they constrain conformational ambiguity. The stability of the aptamer obtained by LIVE, truncated to an optimally active species, could then be engineered by replacing the already strong standard G:C pair by two adjacent AEGIS P:Z pairs, which are still stronger.
Thus, these data suggest that AEGIS-based laboratory evolution could be an important part of future efforts to meet the goal set out three decades ago by the laboratories of Szostak, Gold and Joyce: to obtain receptors, ligands and catalysts by a laboratory equivalent of natural Darwinism on a nucleic acid platform. Of course, these experiments do not quantitatively assess how much added nucleotides improve the intrinsic ability of a library to deliver tight binders. This might be achieved with LIVE experiments performed in parallel with standard and expanded xNA targeting the same function, and such an experiment is currently under way in our laboratory targeting a simpler system.
Multiple reports have already suggested that standard aptamers might be used in environmental surveillance gadgets because of their robustness and re-foldability, especially when compared with protein antibodies. Indeed, literature developing this concept has exploited one aptamer against PA63 in context with a graphene support (34–36). AEGIS aptamers are expected to help implement this vision. With the supporting molecular biology and analytical chemistry now in hand, it is time to turn to developing the biophysics and structural biology of this system.
Supplementary Material
Disclaimer: The content of this work is solely the responsibility of the authors and does not necessarily represent the official views of the funding agencies.
SUPPLEMENTARY DATA
Supplementary Data are available at NAR Online.
FUNDING
This work, as well as the development of the supporting basic science, was made possible by the Defense Threat Reduction Agency under its basic science program [HDTRA1-13-1-0004]. The application work was supported by the National Institute of General Medical Science [R01GM111386] We are also indebted to the Templeton World Charity Foundation [0092/AB57], the National Science Foundation [MCB-1412869] and the National Aeronautics and Space Administration Exobiology program [NNX14AK37G] for support of this development project. Funding for open access charge: National Aeronautics and Space Administration Exobiology program [NNX14AK37G].
Conflict of interest statement. S.A.B. is the holder of many patents related to the AEGIS system.
REFERENCES
- 1.Tuerk C., Gold L. Systematic evolution of ligands by exponential enrichment: RNA ligands to bacteriophage T4 DNA polymerase. Science. 1990;249:505–510. doi: 10.1126/science.2200121. [DOI] [PubMed] [Google Scholar]
- 2.Ellington A.D., Szostak J.W. Selection in vitro of single-stranded DNA molecules that fold into specific ligand-binding structures. Nature. 1992;355:850–852. doi: 10.1038/355850a0. [DOI] [PubMed] [Google Scholar]
- 3.Battersby T.R., Ang D.N., Burgstaller P., Jurczyk S.C., Bowser M.T., Buchanan D.D., Kennedy R.T., Benner S.A. Quantitative analysis of receptors for adenosine nucleotides obtained via in vitro selection from a library incorporating a cationic nucleotide analog. J. Am. Chem. Soc. 1999;121:9781–9789. doi: 10.1021/ja9816436. [DOI] [PubMed] [Google Scholar]
- 4.Jäger S., Rasched G., Kornreich-Leshem H., Engeser M., Thum O., Famulok M. A versatile toolbox for variable DNA functionalization at high density. J. Am. Chem. Soc. 2005;127:15071–15082. doi: 10.1021/ja051725b. [DOI] [PubMed] [Google Scholar]
- 5.Hollenstein M., Hipolito C.J., Lam C.H., Perrin D.M. A DNAzyme with three protein-like functional groups: enhancing catalytic efficiency of M2+-independent RNA cleavage. Chembiochem. 2009;10:1988–1992. doi: 10.1002/cbic.200900314. [DOI] [PubMed] [Google Scholar]
- 6.Hollenstein M., Hipolito C.J., Lam C.H., Perrin D.M. A self-cleaving DNA enzyme modified with amines, guanidines and imidazoles operates independently of divalent metal cations (M2+) Nucleic Acids Res. 2009;37:1638–1649. doi: 10.1093/nar/gkn1070. [DOI] [PMC free article] [PubMed] [Google Scholar]
- 7.Kraemer S., Vaught J.D., Bock C., Gold L., Katilius E., Keeney T.R., Kim N., Saccomano N.A., Wilcox S.K., Zichi D., et al. From SOMAmer-based biomarker discovery to diagnostic and clinical applications: a SOMAmer-based, streamlined multiplex proteomic assay. PLoS One. 2011;6:e26332. doi: 10.1371/journal.pone.0026332. [DOI] [PMC free article] [PubMed] [Google Scholar]
- 8.Kimoto M., Cox R.S., 3rd, Hirao I. Unnatural base pair systems for sensing and diagnostic applications. Expert Rev. Mol. Diagn. 2011;11:321–331. doi: 10.1586/erm.11.5. [DOI] [PubMed] [Google Scholar]
- 9.Lavergne T., Degardin M., Malyshev D.A., Quach H.T., Dhami K., Ordoukhanian P., Romesberg F.E. Expanding the scope of replicable unnatural DNA: stepwise optimization of a predominantly hydrophobic base pair. J. Am. Chem. Soc. 2013;135:5408–5419. doi: 10.1021/ja312148q. [DOI] [PMC free article] [PubMed] [Google Scholar]
- 10.Zhang L., Yang Z., Sefah K., Bradley K.M., Hoshika S., Kim M.J., Kim H.J., Zhu G., Jimenez E., Cansiz S., et al. Evolution of functional six-nucleotide DNA. J. Am. Chem. Soc. 2015;137:6734–6737. doi: 10.1021/jacs.5b02251. [DOI] [PMC free article] [PubMed] [Google Scholar]
- 11.Sefah K., Yang Z., Bradley K.M., Hoshika S., Jimenez E., Zhang L., Zhu G., Shanker S., Yu F., Turek D., et al. In vitro selection with artificial expanded genetic information systems. Proc. Natl. Acad. Sci. U.S.A. 2014;111:1449–1454. doi: 10.1073/pnas.1311778111. [DOI] [PMC free article] [PubMed] [Google Scholar]
- 12.Yang Z., Chen F., Chamberlin S.G., Benner S.A. Expanded genetic alphabets in the polymerase chain reaction. Angew. Chem. Int. Ed. Engl. 2010;49:177–180. doi: 10.1002/anie.200905173. [DOI] [PMC free article] [PubMed] [Google Scholar]
- 13.Yang Z., Durante M., Glushakova L.G., Sharma N., Leal N.A., Bradley K.M., Chen F., Benner S.A. Conversion strategy using an expanded genetic alphabet to assay nucleic acids. Anal. Chem. 2013;85:4705–4712. doi: 10.1021/ac400422r. [DOI] [PMC free article] [PubMed] [Google Scholar]
- 14.Benner S.A. Understanding nucleic acids using synthetic chemistry. Acc. Chem. Res. 2004;37:784–797. doi: 10.1021/ar040004z. [DOI] [PubMed] [Google Scholar]
- 15.Thoren K.L., Krantz B.A. The unfolding story of anthrax toxin translocation. Mol. Microbiol. 2011;80:588–595. doi: 10.1111/j.1365-2958.2011.07614.x. [DOI] [PMC free article] [PubMed] [Google Scholar]
- 16.Feld G.K., Brown M.J., Krantz B.A. Ratcheting up protein translocation with anthrax toxin. Protein Sci. 2012;21:606–624. doi: 10.1002/pro.2052. [DOI] [PMC free article] [PubMed] [Google Scholar]
- 17.Petosa C., Collier R.J., Klimpel K.R., Leppla S.H., Liddington R.C. Crystal structure of the anthrax toxin protective antigen. Nature. 1997;385:833–838. doi: 10.1038/385833a0. [DOI] [PubMed] [Google Scholar]
- 18.Lacy D.B., Wigelsworth D.J., Melnyk R.A., Harrison S.C., Collier R.J. Structure of heptameric protective antigen bound to an anthrax toxin receptor: a role for receptor in pH-dependent pore formation. Proc. Natl. Acad. Sci. U.S.A. 2004;101:13147–13151. doi: 10.1073/pnas.0405405101. [DOI] [PMC free article] [PubMed] [Google Scholar]
- 19.Kintzer A.F., Sterling H.J., Tang II, Williams E.R., Krantz B.A. Anthrax toxin receptor drives protective antigen oligomerization and stabilizes the heptameric and octameric oligomer by a similar mechanism. PLoS One. 2010;5:e13888. doi: 10.1371/journal.pone.0013888. [DOI] [PMC free article] [PubMed] [Google Scholar]
- 20.Feld G.K., Thoren K.L., Kintzer A.F., Sterling H.J., Tang II, Greenberg S.G., Williams E.R., Krantz B.A. Structural basis for the unfolding of anthrax lethal factor by protective antigen oligomers. Nat. Struct. Mol. Biol. 2010;17:1383–1390. doi: 10.1038/nsmb.1923. [DOI] [PMC free article] [PubMed] [Google Scholar]
- 21.Kintzer A.F., Thoren K.L., Sterling H.J., Dong K.C., Feld G.K., Tang I.I., Zhang T.T., Williams E.R., Berger J.M., Krantz B.A. The protective antigen component of anthrax toxin forms functional octameric complexes. J. Mol. Biol. 2009;392:614–629. doi: 10.1016/j.jmb.2009.07.037. [DOI] [PMC free article] [PubMed] [Google Scholar]
- 22.Kintzer A.F., Sterling H.J., Tang II, Abdul-Gader A., Miles A.J., Wallace B.A., Williams E.R., Krantz B.A. Role of the protective antigen octamer in the molecular mechanism of anthrax lethal toxin stabilization in plasma. J. Mol. Biol. 2010;399:741–758. doi: 10.1016/j.jmb.2010.04.041. [DOI] [PMC free article] [PubMed] [Google Scholar]
- 23.Katayama H., Janowiak B.E., Brzozowski M., Juryck J., Falke S., Gogol E.P., Collier R.J., Fisher M.T. GroEL as a molecular scaffold for structural analysis of the anthrax toxin pore. Nat. Struct. Mol. Biol. 2008;15:754–760. doi: 10.1038/nsmb.1442. [DOI] [PMC free article] [PubMed] [Google Scholar]
- 24.Blaustein R.O., Koehler T.M., Collier R.J., Finkelstein A. Anthrax toxin: channel-forming activity of protective antigen in planar phospholipid bilayers. Proc. Natl. Acad. Sci. U.S.A. 1989;86:2209–2213. doi: 10.1073/pnas.86.7.2209. [DOI] [PMC free article] [PubMed] [Google Scholar]
- 25.Miller C.J., Elliott J.L., Collier R.J. Anthrax protective antigen: prepore-to-pore conversion. Biochemistry. 1999;38:10432–10441. doi: 10.1021/bi990792d. [DOI] [PubMed] [Google Scholar]
- 26.Kintzer A.F., Thoren K.L., Sterling H.J., Dong K.C., Feld G.K., Tang II, Zhang T.T., Williams E.R., Berger J.M., Krantz B.A. The protective antigen component of anthrax toxin forms functional octameric complexes. J. Mol. Biol. 2009;392:614–629. doi: 10.1016/j.jmb.2009.07.037. [DOI] [PMC free article] [PubMed] [Google Scholar]
- 27.Wong I., Lohman T.M. A double-filter method for nitrocellulose filter-binding: application to protein-nucleic acid interactions. Proc. Natl. Acad. Sci. U.S.A. 1993;90:5428–5432. doi: 10.1073/pnas.90.12.5428. [DOI] [PMC free article] [PubMed] [Google Scholar]
- 28.Xayaphoummine A., Bucher T., Isambert H. Kinefold web server for RNA/DNA folding path and structure prediction including pseudoknots and knots. Nucleic Acids Res. 2005;33:W605–W610. doi: 10.1093/nar/gki447. [DOI] [PMC free article] [PubMed] [Google Scholar]
- 29.Zhang L., Yang Z., Le Trinh T., Teng I.T., Wang S., Bradley K.M., Hoshika S., Wu Q., Cansiz S., Rowold D.J., et al. Aptamers against Cells Overexpressing Glypican 3 from Expanded Genetic Systems Combined with Cell Engineering and Laboratory Evolution. Angew Chem. Int. Ed. Engl. 2016;55:12372–12375. doi: 10.1002/anie.201605058. [DOI] [PMC free article] [PubMed] [Google Scholar]
- 30.Fujita H., Imaizumi Y., Kasahara Y., Kitadume S., Ozaki H., Kuwahara M., Sugimoto N. Structural and affinity analyses of g-quadruplex DNA aptamers for camptothecin derivatives. Pharmaceuticals (Basel) 2013;6:1082–1093. doi: 10.3390/ph6091082. [DOI] [PMC free article] [PubMed] [Google Scholar]
- 31.Garcia-Recio E.M., Pinto-Diez C., Perez-Morgado M.I., Garcia-Hernandez M., Fernandez G., Martin M.E., Gonzalez V.M. Characterization of MNK1b DNA aptamers that inhibit proliferation in MDA-MB231 breast cancer cells. Mol. Ther. Nucleic Acids. 2016;5:e275. doi: 10.1038/mtna.2015.50. [DOI] [PMC free article] [PubMed] [Google Scholar]
- 32.Kikin O., D'Antonio L., Bagga P.S. QGRS Mapper: a web-based server for predicting G-quadruplexes in nucleotide sequences. Nucleic Acids Res. 2006;34:W676–W682. doi: 10.1093/nar/gkl253. [DOI] [PMC free article] [PubMed] [Google Scholar]
- 33.Carrigan M.A., Ricardo A., Ang D.N., Benner S.A. Quantitative analysis of a RNA-cleaving DNA catalyst obtained via in vitro selection. Biochemistry. 2004;43:11446–11459. doi: 10.1021/bi049898l. [DOI] [PubMed] [Google Scholar]
- 34.Choi J.S., Kim S.G., Lahousse M., Park H.Y., Park H.C., Jeong B., Kim J., Kim S.K., Yoon M.Y. Screening and characterization of high-affinity ssDNA aptamers against anthrax protective antigen. J. Biomol. Screen. 2011;16:266–271. doi: 10.1177/1087057110391787. [DOI] [PubMed] [Google Scholar]
- 35.Oh B.N., Lee S., Park H.Y., Baeg J.O., Yoon M.Y., Kim J. Sensitive fluorescence assay of anthrax protective antigen with two new DNA aptamers and their binding properties. Analyst. 2011;136:3384–3388. doi: 10.1039/c0an00978d. [DOI] [PubMed] [Google Scholar]
- 36.Kim D.J., Park H.C., Sohn I.Y., Jung J.H., Yoon O.J., Park J.S., Yoon M.Y., Lee N.E. Electrical graphene aptasensor for ultra-sensitive detection of anthrax toxin with amplified signal transduction. Small. 2013;9:3352–3360. doi: 10.1002/smll.201203245. [DOI] [PubMed] [Google Scholar]
Associated Data
This section collects any data citations, data availability statements, or supplementary materials included in this article.


