Abstract
AIM:
To assess aortic and carotid intima-media thickness (aIMT and cIMT) in diabetic patients.
PATIENTS AND METHODS:
The study included 75 type 1 diabetic patients and 30 age and sex matched healthy volunteer. A blood sample was taken for analysis of HbA1 and lipid profile and the urine sample was taken for analysis of albumin/creatinine ratio. aIMT and cIMT via ultrasound were also done.
RESULTS:
cIMT & aIMT were significantly higher in diabetics. aIMT was found to be significantly higher than cIMT in diabetic patients (0.72 ± 0.11 vs. 0.52 ± 0.06, P = 0.0001). Ten of our patients (14%) with normal cIMT revealed significantly increased aIMT. aIMT had a significant positive correlation with age of patients, waist/hip ratio & cIMT.
CONCLUSION:
Diabetic patients had increased aIMT and cIMT with a relatively greater increase in the aIMT than in the cIMT. Because atherosclerosis begins first in the intima of the aorta, these data suggest that the aIMT might provide the best currently available noninvasive marker of preclinical atherosclerosis in children. We recommend frequent follow up of diabetic patients for early detection of diabetic complication.
Keywords: aIMT, cIMT, HbA1, type 1 diabetes, Egypt
Introduction
Juvenile diabetes has been stated as one of the major risk factors for atherosclerosis and its complications and diabetic patients have about 3-fold increased risk of developing atherosclerotic disease [1].
Atherosclerosis starts in childhood in the form of intimal fatty streaks where lipids accumulate in the intima of arteries and these fatty streaks occur in the aorta in almost every child over the age of 3 years [2]. Autopsy study of individuals aged 15 to 34 years showed that atherosclerotic lesions tends to affect certain arterial segments, especially the abdominal aorta where lesions mostly affected the dorsolateral wall of the aorta just proximal to its bifurcation [3] but atherosclerotic lesions occur later in life in the coronary and carotid arteries than in the aorta, and there is a strong association between atherosclerosis in the abdominal aorta and coronary arteries [4].
Recent improvements in ultrasound machines with increased resolution and accuracy have allowed identification of early vascular changes that can be assessed noninvasively using ultrasound. Aortic & carotid intima-media thickness (cIMT) testing via B-mode ultrasound is a safe, simple, and inexpensive method for evaluating cardiovascular (CV) risk by measuring the combined thickness of the intimal and medial layers of the arterial wall. Use of IMT testing can also detect marked thickening of the arterial wall, possibly indicating plaques or atheromas that are associated with accelerated atherosclerotic disease and increased risk for coronary artery disease, myocardial infarction, and stroke [5]. Many studies have been detected increased IMT in young diabetic children [6-8]. In young and middle-aged adults, increased IMT was also associated with cardiovascular risk factors [8-11].
Since atherosclerotic changes occur earlier in the abdominal aorta than in the carotid arteries, measurement of aortic intima-media thickness (aIMT) may be a more sensitive indicator in younger individuals allowing early detection of atherosclerotic lesions, thereby allows risk factor modification at younger age. McGill et al. [3] suggested that risk factor control in youth would be the most effective strategy for preventing heart disease in the 21st century.
In the study reported herein, we measured aIMT and cIMT in adolescents and young adults to identify the relationship of concurrently measured cardiovascular risk factors with both of these ultrasound-derived IMT measures.
Patients and Methods
Patients
The study included 75 children with type 1 diabetes mellitus (DM) attending the endocrine clinic, National Research Centre, Cairo, Egypt. The control group consisted of 30 ages and sex matched healthy normal volunteers. The control group was the healthy friends and relatives of our patients.
Age of patients was 12-23 years (17.99 ± 2.59), duration of diabetes was 5-20.5 years (10.91 ± 3.54), onset of diabetes was 1.5-17 years (7 ± 3.28), insulin dose/kg was 0.28-3.05 U/kg (1.26 ± 0.44 U/kg), and BMI (Kg/m^2) was 16.89-34.31 (24.44 ± 3.89) and nobody used insulin pump. All diabetic patients were on intensive insulin therapy regimen.
None of our patients had acute diabetic complications, for example, diabetic ketoacidosis (DKA) or hypoglycemia, none suffering from cardiac diseases, for example, congenital, rheumatic heart and left ventricular dysfunction. Also patients receiving drugs for cardiovascular disease and patients on metformin or multivitamins were excluded.
Study design and protocol
It was a cross-sectional observational study done after obtaining approval from the Ethical Committee of the National Research Centre (registration number 11052). Written informed consent was obtained from all patients or their parents and controls after full discussion about the aim of the study. This study is a part of a project done in the National Research Centre for evaluation of cardiac, vascular and endothelial function in adolescent type 1 diabetic patients.
All the studied patients were subjected to history taking including age of patients, sex, age of onset of diabetes, duration of diabetes, type and dose of insulin therapy, and family history of diabetes.
We asked about the presence of any symptoms of cardiac, renal, neurological affection, or presence of any type of autonomic dysfunction. We also asked about history of taking drugs other than insulin.
Clinical examination
Patients and controls were subjected to general, cardiac, chest, and neurological examination. Blood pressure was measured three times for patients and controls after 5 min rest in the sitting position on both upper limbs with the use of automatic manometer (Omron M4 Plus; Omron Health Care Europe, Hoof drop, The Netherlands). The mean value of the second and the third measurement was calculated.
The measurements taken on the dominant limb were analyzed.
Anthropometric measurements in the form of weight, height, waist circumference (WC), and hip circumference (HC) were taken for each participant. The weight and height of the participants were measured up to 0.01 kg and 0.1 cm using a Seca Scale Standing Balance and a Holtain Portable Anthropometer (Holtain, Ltd, Crymmych, UK). Body mass index (BMI) was calculated as weight (in kg) divided by height (in m) squared. Waist circumference was measured at the level of the umbilicus with the participant standing and breathing normally; hip circumference was measured at the level of the iliac crest, using non-stretchable plastic tape to the nearest 0.1 cm. The waist/hip ratio and waist/height ratio (cm/cm) were calculated. Each measurement was taken as the mean of three consecutive measurements, using standardized equipment [14, 15]. The landmarks, instruments used, and techniques followed were those recommended by the international biological program [14, 15].
Laboratory investigation
All patients and controls underwent the following tests. For cholesterol measurements, venous blood was sampled after a 12 h fast. Serum total cholesterol was determined by a commercial kit (Boehringer-Mannheim, Mannheim, Germany) [16]. High-density lipoprotein (HDL) cholesterol was separated from the serum by precipitation of the other lipoproteins with a heparin/manganese procedure [17]. Low-density lipoprotein (LDL) cholesterol was calculated using the Friedewald equation. The concentration of triglycerides (Tg) was measured in a TechnoCon AutoAnalyzer II (TechnoCon Instruments, Tarrytown, NY, USA). Glycosylated hemoglobin (HbA1) was done every 3 months and the mean value was calculated per year. It was measured using high pressure liquid chromatography (Nichols Institute, Van Nuys, CA, USA) [18]. Screening for microalbuminuria was assessed in fresh morning urine samples by measuring albumin/creatinine ratio by enzyme linked immunosorbent assay (ELISA) kit provided by Orgentec Diagnostika, Gmbh (Mainz, Germany) [19].
cIMT assessment
A single experienced vascular sonographer, who was blind to the clinical and laboratory data of the study subjects, performed all imaging studies. The images were obtained using a General Electric medical ultrasonographic machine (model: Vivid 7 Pro, GE Healthcare Vingmed ultrasound AS-Nl90, Horton, Norway) equipped with 7.5–10 MHz linear-array transducer. Imaging of the carotid arteries was performed in the cardiovascular ultrasound laboratory with the subject resting in the supine position with his/her neck extended, and the head turned 45 degrees toward the contralateral side. Care was taken to have the vessel as perpendicular as possible to the plane of ultrasound beam to ensure optimal imaging of the vessel wall in its longitudinal axis with the least possible pressure in order not to compress the overlying jugular vein and to allow expansion of the carotid artery in all directions. A longitudinal section of the common carotid artery 1 cm proximal to the carotid bulb was imaged to achieve consistent site of measurement, and a resolution box function was used to magnify this part of the artery. Three maximal IMT measurements of the far wall of the artery at 3-mm intervals were obtained starting at 1 cm proximal to the bulb and moving proximally.
The reported IMT for each side is the average of these three measurements and the reported IMT for each subject was the average of the six measurements (three measurements from the right and three from the left common carotid artery). Generally, images are recorded in the plane where the maximal cIMT can be visualized. Magnification of the vessel wall allows easy identification of the intimal-medial complex, defined by the border between the echolucent vessel lumen and the echogenic intima and the border between the echolucent media and echogenic adventitia. Image frames were selected on the basis of areas where the intima-media complex was best visualized and appeared the thickest, irrespective of the cardiac cycle, with manual assessment by the sonographer using electronic calipers online [6].
Measurement of aIMT
The abdominal aorta was first identified in the upper abdomen using a 7.5 MHz pediatric phased array transducer, and it was then followed distally until the aortic bifurcation was reached. The depth (anterior-posterior direction) and location (cranio-caudal direction) of the distal 15 mm of the abdominal aorta was measured from these images and used as an aid to locate the aortic intima-media complex using a 10 MHz linear array transducer. For the assessment of aIMT, the image was focused on the far wall (dorsal arterial wall of the most distal 15 mm of the abdominal aorta), and gain settings were used to optimize image quality. Images 15 mm in width were magnified using a resolution box function. The dorsal arterial wall of the most distal abdominal aorta was chosen for the area of interest because post mortem series have shown it is the most lesion-prone site [12]. Generally, images are recorded in the plane where the maximal aIMT can be visualized. Magnification of the vessel wall allows easy identification of the intimal-medial complex, defined by the border between the echolucent vessel lumen and the echogenic intima and the border between the echolucent media and echogenic adventitia. Image frames were selected on the basis of areas where the intima-media complex was best visualized and appeared the thickest, irrespective of the cardiac cycle, with manual assessment by the sonographer using electronic calipers online. At least 3 measurements were taken, followed by averaging the three measurements of each patient to calculate aIMT [7].
Statistical analysis
Statistical analysis was conducted using Statistical Package for Social Science (SPSS) program version 15.0 (Chicago, IL, USA); t-test or Mann-Whitney U-test (for non-normally distributed data) for independent variables was done. Pearson’s (for normally distributed data) or Spearman’s (for non-normally distributed data) correlation was also used.
Results
Descriptive statistics of demographic data, blood pressure, anthropometric and clinical data were in Tables 1 & 2.
Table 1.
Descriptive statistics of demographic, blood pressure and anthropometric data of diabetic patients included in the study
| Variables | Minimum | Maximum | Mean | Std. Deviation |
|---|---|---|---|---|
| Demographic data: | ||||
| Age of patients (yrs) | 12.00 | 23.00 | 17.99 | 2.59 |
| Duration of disease (yrs) | 5.00 | 20.50 | 10.91 | 3.54 |
| Onset of disease (yrs) | 1.50 | 17.00 | 7.00 | 3.28 |
| Insulin dose (U/Kg) | 0.28 | 3.05 | 1.26 | 0.44 |
| Blood pressure: | ||||
| Systolic blood pressure (mmHg) | 100.00 | 150.00 | 118.45 | 13.33 |
| Diastolic blood pressure (mmHg) | 50.00 | 100.00 | 76.55 | 10.057 |
| Anthropometric data: | ||||
| Weight (kg) | 32.00 | 96.00 | 64.40 | 12.01 |
| Height (cm) | 135.00 | 181.80 | 162 | 10.31 |
| Waist circumference (cm) | 50.00 | 105.00 | 82.83 | 11.21 |
| Hip circumference (cm) | 74.00 | 121.00 | 94.60 | 10.32 |
| Midarm circumference (cm) | 21.00 | 3205.00 | 75.14 | 379.53 |
| Body mass index (kg/m2) | 16.89 | 34.31 | 24.44 | 3.89 |
| Waist/hip ratio | 0.57 | 0.99 | 0.88 | 0.08 |
Table 2.
Descriptive statistics of clinical data of patients included in the study
| Variables | N | % |
|---|---|---|
| Dyspnea | 5 | 7 |
| Orthopnea | 3 | 4.2 |
| Paroxosmal nocturnal | 3 | 4.2 |
| Palpitation | 22 | 18.3 |
| Chest pain | 13 | 18.3 |
| Dyspnea | 18 | 25.4 |
| Sensory lose | 4 | 5.6 |
| Syncope | 1 | 1.4 |
| Cough on exersion | 5 | 7 |
| Gastointestinal symptoms | 5 | 7 |
| Lower limp edema | 1 | 0.8 |
| Intermittent claudication | 9 | 12.7 |
| Weak muscle power | 1 | 1.4 |
| Postural hypotension | 5 | 7 |
| Urinary symptoms | 11 | 15.5 |
| Numbness | 27 | 38 |
| Parathesia | 12 | 16.9 |
| Tremors | 2 | 2.8 |
| Bluring of vision | 9 | 12.7 |
| Easy fatigability | 1 | 1.4 |
Diabetic patients had significantly increased LDL (p = 0.01), oxLDL (p = 0.0001), albumin/creatinine ratio (p = 0.001), cIMT (p = 0.0001) & aIMT (p = 0.0001).
cIMT & aIMT were significantly higher in diabetics (0.52 ± 0.06 vs. 0.4 ± 0.03, P = 0.0001 and 0.72 ± 0.11 vs. 0.46 ± 0.04, P = 0.0001 respectively). aIMT was found to be significantly higher than cIMT in diabetic patients (0.72 ± 0.11 vs. 0.52 ± 0.06, P = 0.0001) (Fig. 1, 2, 3 & 4).
Figure 1.
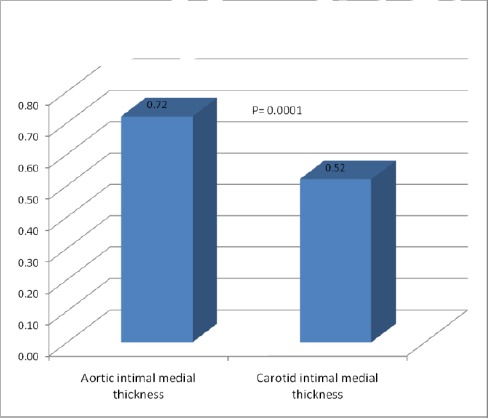
Comparison between aortic intimal medial thickness and carotid intimal medial thickness of diabetic patients
Figure 2.
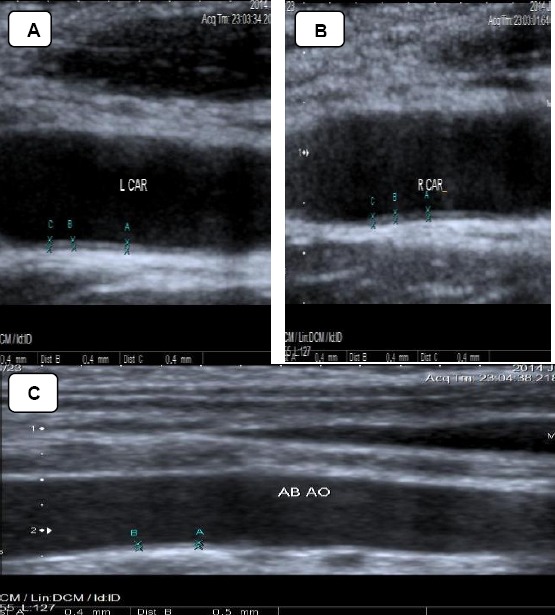
Carotid & aortic intimal medial thickness in one of the controls. A & B: showing normal Rt. & Lt. cIMT of one of the controls. cIMT= 0.4mm. C: showing normal aIMT of one of the controls. aIMT= 0.4-0.5mm
Figure 3.
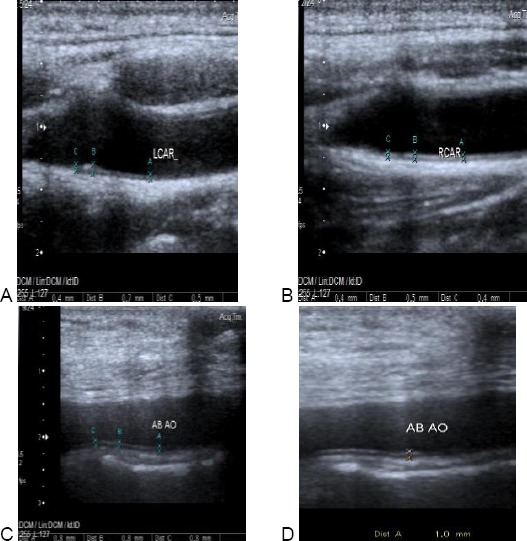
Carotid & aortic intimal medial thickness in one of the patients. A: showing normal Rt. cIMT of one of the patients. cIMT = 0.4-0.5 mm. B: showing increased Lt. cIMT of the same patients. cIMT = 0.4-0.7 mm. C &D: showing increased aIMT of the same patient. aIMT = 0.8-1 mm
Figure 4.
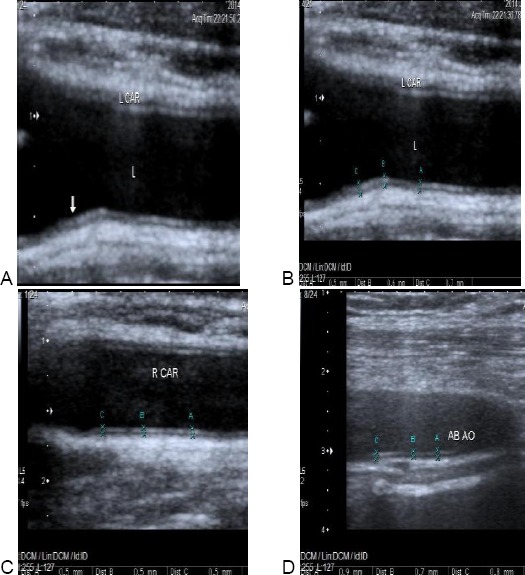
Carotid & aortic intimal medial thickness in one of the patients. A & B: showing increased Lt. cIMT of one of the patients. cIMT = 0.5-0.7 mm (arrow). C: showing increased aIMT of the same patient. aIMT = 0.7-0.9 mm. D: showing normal Rt. cIMT of the same patients. cIMT = 0.5 mm
Ten of our patients (14%) with normal cIMT revealed significantly increased aIMT (Fig. 5). aIMT had significant correlation with age of the patients (P = 0.0001), waist/hip ratio & with cIMT (P = 0.01) and positively correlated with the duration of diabetes but didn’t reach statistical significance (P = 0.08) (Fig. 6 Table 4).
Figure 5.
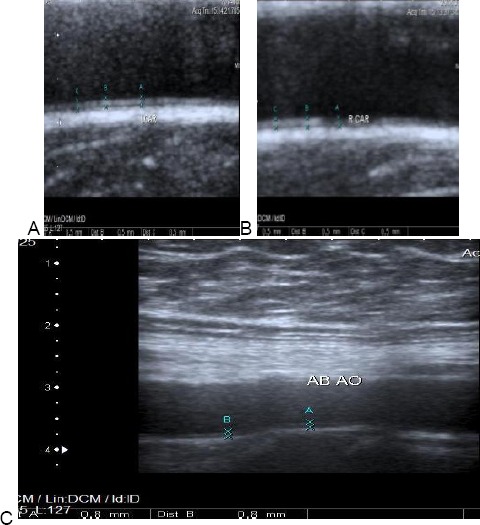
Carotid & aortic intimal medial thickness in one of the patients. A & B: showing normal Rt. & Lt. cIMT of one of the patients. cIMT = 0.5 mm. C: showing increased aIMT of the same patient. aIMT = 0.8 mm
Figure 6.
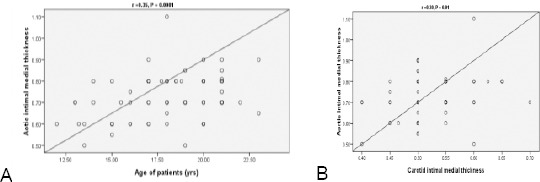
Correlation between age of diabetic patients and aortic intimal medial thickness (A). Correlation between aortic and carotid intimal medial thickness of diabetic patients
Table 3.
Comparison between data of diabetic patients and controls (N = 75)
| Variables | Patients | Controls | P-value | ||
|---|---|---|---|---|---|
| Mean | SD | Mean | SD | ||
| Body mass index (kg/m2) | 24.44 | 3.89 | 21.86 | 6.47 | 0.3 |
| Waist/hip ratio | 0.88 | 0.08 | 0.68 | 0.07 | 0.03 |
| Waist /height ratio | 0.51 | 0.07 | 0.48 | 0.10 | 0.3 |
| Cholesterol (mg/dl) | 194.86 | 63.65 | 176.41 | 37.27 | 0.1 |
| Triglyceride (mg/dl) | 106.59 | 53.12 | 89.24 | 49.95 | 0.1 |
| HDL-c (mg/dl) | 49.31 | 16.35 | 48.07 | 36.12 | 0.8 |
| LDL - c (mg/dl) | 116.49 | 39.10 | 94.16 | 34.66 | 0.01 |
| Albumin / creatinine ratio (µg/g) | 69.69 | 81.29 | 8.45 | 10.68 | 0.001 |
| OxLDL | 43.34 | 14.21 | 26.58 | 13.74 | 0.0001 |
| Carotid intimal medial thickness | 0.52 | 0.06 | 0.41 | 0.03 | 0.0001 |
| Aortic intimal medial thickness | 0.72 | 0.11 | 0.46 | 0.04 | 0.0001 |
Table 4.
Correlation between demographic, anthropometric, laboratory data and carotid intimal medial thickneass and aortic intimal medial thickness in diabetic patients
| Variables | r | P-value |
|---|---|---|
| Age of patients (yrs) | 0.35 | 0.0001 |
| Duration of disease (yrs) | 0.21 | 0.08 |
| Onset of disease (yrs) | 0.14 | 0.24 |
| Systolic blood pressure (mmHg) | 0.03 | 0.82 |
| Diastolic blood pressure (mmHg) | 0.05 | 0.71 |
| BMI (kg/m^2) | 0.11 | 0.36 |
| Waist/hip ratio | 0.27 | 0.03 |
| Waist/height ratio | 0.16 | 0.18 |
| Cholesterol (mg/dl) | 0.19 | 0.13 |
| Triglyceride (mg/dl) | 0.15 | 0.25 |
| HDL-c (mg/dl) | 0.07 | 0.62 |
| LDL-c (mg/dl) | 0.06 | 0.67 |
| HbA1 (%) | -0.03 | 0.79 |
| Albumin/creatinine ratio (µg/gm) | 0.16 | 0.27 |
| Insulin dose (U/kg) | 0.01 | 0.93 |
| Carotid intimal medial thickness | 0.30 | 0.01 |
| OxLDL | 0.05 | 0.67 |
Discussion
In the current study, diabetic patients had significantly increased LDL, oxLDL, albumin/creatinine ratio, cIMT & aIMT.
cIMT and aIMT were significantly increased in diabetics compared with healthy control children, but the difference was greater for aIMT as aIMT was found to be significantly higher than cIMT in diabetic patients.
Ten of our patients (14%) with normal cIMT revealed significantly increased aIMT. aIMT had significant correlation with age of the patients, waist/hip ratio & with cIMT and positively correlated with the duration of diabetes but didn’t reach statistical significance (P = 0.08).
The present study shows that diabetic children have significantly increased aortic IMT & carotid artery IMT compared with normal control.
Our findings are consistent with observations reported in a postmortem study that have indicated a relation between early atherosclerotic lesions and diabetic state [3] and with findings of Järvisalo et al. who reported that type I diabetes predisposes to increased subclinical atherosclerosis at a very early age and that type 1 diabetes is an independent risk factor for increased IMT in children [13].
Also our findings are in agreement with the finding of McGill et al [12] that atherosclerosis develops first in the intima of abdominal aorta and they showed that aIMT may be used as a noninvasive ultrasound marker of preclinical atherosclerosis in children.
In the present study, aIMT was found to be significantly higher than cIMT in diabetic patients (P = 0.0001) and Ten of our patients (14%) with normal cIMT revealed significantly increased aIMT. Our findings are in agreement with Järvisalo et. Al [7] and with an autopsy study [3] that showed that atherosclerotic lesions tend to affect certain arterial segments, especially the dorsolateral wall of abdominal aorta just proximal to its bifurcation and reported that atherosclerotic lesions occur later in life in the coronary and carotid arteries than in the aorta.
McGill et al [12] reported that fatty streaks develop in different areas of the abdominal aorta but those on the dorsal surface of the distal abdominal aorta develop and progress most rapidly to become raised lesions, so we focused on this on this site in the present study, being the most lesion-prone site seen in autopsy study. Since fatty streaks develop in the aortas of adolescents but raised lesions occurs after the age of 20 years [12], so the increased aIMT seen in diabetic adolecents in the present study likely reflect increased fatty streak formation.
In our study, the increased aIMT in diabetics was positively correlated to waist/hip ratio. Our findings are consistent with observations of Dawson et al [14] who reported that aIMT was associated with body mass index (BMI), and waist/hip ratio. Also Rathsman et al [15] reported increased cIMT in diabetic adolescents with positive correlation between cIMT and waist circumference [15]. Similarly McCloskey et al [17] concluded that increased infant weight and adiposity at birth, as well as increased early weight gain, were positively associated with aortic intima-media thickness. In the current study, increased aIMT had significant correlation with age of the patients (P = 0.0001) but not correlated to other cardiovascular risk factors. Similarly, Jarvisalo et al [7] reported association between age & aIMT in diabetic children. In line with our findings, a Japanese study of 60 Japanese children age 5 to 14 years [16], cIMT was not associated with any cardiovascular risk factors but did increase with age.
Diabetic children show increased IMTs compared with healthy controls with more pronounced increase in the aIMT than in the cIMT. Since atherosclerotic changes starts first in the intima of the aorta, our data suggest that the aIMT might provide the best currently available noninvasive marker of preclinical atherosclerosis in diabetic children so we recommend early and close observation of children with diabetes for detection preclinical atherosclerosis.
Footnotes
Funding: This research did not receive any financial support.
Competing Interests: The authors have declared that no competing interests exist.
References
- 1.Pyörälä K, Laakso M, Uusitupa M. Diabetes and atherosclerosis: an epidemiologic view. Diabetes Metab Rev. 1987;3:463–524. doi: 10.1002/dmr.5610030206. http://dx.doi.org/10.1002/dmr.5610030206 . PMid: 3552530. [DOI] [PubMed] [Google Scholar]
- 2.Holman RL, McGill HC, Jr, Strong JP, Geer JC. The natural history of atherosclerosis: the early aortic lesions seen in New Orleans in the middle of the 20th century. Am J Pathol. 1958;34:209–235. PMid: 13520905. PMCid: PMC1934740. [PMC free article] [PubMed] [Google Scholar]
- 3.McGill HC, Jr, McMahan CA, Gidding SS. Preventing heart disease in the 21st century: implications of the Pathobiological Determinants of Atherosclerosis in Youth (PDAY) study. Circulation. 2008;117:1216–1227. doi: 10.1161/CIRCULATIONAHA.107.717033. http://dx.doi.org/10.1161/CIRCULATIONAHA.107.717033 . PMid: 18316498. [DOI] [PubMed] [Google Scholar]
- 4.Guzman MA, McMahan CA, McGill HC, Jr, et al. Selected methodologic aspects of the International Atherosclerosis Project Lab. Invest. 1968;18:479–497. [PubMed] [Google Scholar]
- 5.Doneen AL, Bale BF. Carotid intima-media thickness testing as an asymptomatic cardiovascular disease identifier and method for making therapeutic decisions. Postgrad Med. 2013;125:108–23. doi: 10.3810/pgm.2013.03.2645. http://dx.doi.org/10.3810/pgm.2013.03.2645 . PMid: 23816777. [DOI] [PubMed] [Google Scholar]
- 6.Singh TP, Groehn H, Kazmers A. Vascular function and carotid intimal-medial thickness in children with insulin-dependent diabetes mellitus. J Am Coll Cardiol. 2003;41:661–5. doi: 10.1016/s0735-1097(02)02894-2. http://dx.doi.org/10.1016/S0735-1097(02)02894-2 . [DOI] [PubMed] [Google Scholar]
- 7.Järvisalo MJ, Jartti L, Näntö-Salonen K, Irjala K, Rönnemaa T, Hartiala JJ, Celermajer DS, Raitakari OT. Increased aortic intima-media thickness: a marker of preclinical atherosclerosis in high-risk children. Circulation. 2001;104:2943–2947. doi: 10.1161/hc4901.100522. http://dx.doi.org/10.1161/hc4901.100522 . PMid: 11739310. [DOI] [PubMed] [Google Scholar]
- 8.Abd El Dayem SM, El Magd El Bohy A, Battah AA. Carotid intimal medial thickness and its relation to endothelial dysfunction and echocardiographic changes in adolescents with type 1 diabetes. J Pediatr Endocrinol Metab. 2015;28(9-10):1029–37. doi: 10.1515/jpem-2014-0355. http://dx.doi.org/10.1515/jpem-2014-0355 . [DOI] [PubMed] [Google Scholar]
- 9.Davis PH, Dawson JD, Riley WA, Lauer RM. Carotid intimal-medial thickness is related to cardiovascular risk factors measured from childhood through middle age. Circulation. 2001;104:2815–2819. doi: 10.1161/hc4601.099486. http://dx.doi.org/10.1161/hc4601.099486 . PMid: 11733400. [DOI] [PubMed] [Google Scholar]
- 10.Li S, Chen W, Srinivasan SR, et al. Childhood cardiovascular risk factors and carotid vascular changes in adulthood: the Bogalusa Heart Study. JAMA. 2003;290:2271–2276. doi: 10.1001/jama.290.17.2271. [DOI] [PubMed] [Google Scholar]
- 11.Raitakari OT, Juonala M, Kahonen M, et al. Cardiovascular risk factors in childhood and carotid artery intima-media thickness in adulthood: the Cardiovascular Risk in Young Finns study. JAMA. 2003;290:2277–2283. doi: 10.1001/jama.290.17.2277. http://dx.doi.org/10.1001/jama.290.17.2277 . PMid: 14600186. [DOI] [PubMed] [Google Scholar]
- 12.McGill HC, McMahan CA, Herderick EE, et al. Effects of coronary heart disease risk factors on atherosclerosis of selected regions of the aorta and right coronary artery: PDAY research group: Pathobiological Determinants of Atherosclerosis in Youth. Arterioscler Thromb Vasc Biol. 2000;20:836–845. doi: 10.1161/01.atv.20.3.836. http://dx.doi.org/10.1161/01.ATV.20.3.836 . PMid: 10712411. [DOI] [PubMed] [Google Scholar]
- 13.Järvisalo MJ, Putto-Laurila A, Jartti L, Lehtimäki T, Solakivi T, Rönnemaa T, Raitakari OT. Carotid artery intima-media thickness in children with type 1 diabetes. Diabetes. 2002 Feb;51(2):493–8. doi: 10.2337/diabetes.51.2.493. http://dx.doi.org/10.2337/diabetes.51.2.493 . PMid: 11812760. [DOI] [PubMed] [Google Scholar]
- 14.Dawson JD, Sonka M, Blecha MB, Lin W Davis. Risk Factors Associated With Aortic and Carotid Intima-Media Thickness in Adolescents and Young Adults. J Am Coll Cardiol. 2009;53:2273–2279. doi: 10.1016/j.jacc.2009.03.026. http://dx.doi.org/10.1016/j.jacc.2009.03.026 . PMid: 19520251. PMCid: PMC2747309. [DOI] [PMC free article] [PubMed] [Google Scholar]
- 15.Rathsman B, Rosfors S, Sjöholm A, Nyström T. Early signs of atherosclerosis are associated with insulin resistance in non-obese adolescent and young adults with type 1 diabetes. Cardiovasc Diabetol. 2012;11:145. doi: 10.1186/1475-2840-11-145. http://dx.doi.org/10.1186/1475-2840-11-145 . PMid: 23185996. PMCid: PMC3538551. [DOI] [PMC free article] [PubMed] [Google Scholar]
- 16.Ishizu T, Ishimitsu T, Yanagi H, et al. Effect of age on carotid arterial intima-media thickness in childhood. Heart Vessels. 2004;19:189–195. doi: 10.1007/s00380-004-0766-8. http://dx.doi.org/10.1007/s00380-004-0766-8 . PMid: 15278393. [DOI] [PubMed] [Google Scholar]
- 17.McCloskey K, Burgner D, Carlin JB, Skilton MR, Cheung M, Dwyer T, Vuillermin P, Ponsonby AL. Infant adiposity at birth and early postnatal weight gain predict increased aortic intima-media thickness at 6 weeks of age: a population-derived cohort study. Clinical Science. 2016;130(6):443–50. doi: 10.1042/CS20150685. http://dx.doi.org/10.1042/CS20150685 . PMid: 26666445. [DOI] [PubMed] [Google Scholar]


