Abstract
Photoplethysmographic imaging is an optical solution for non-contact cardiovascular monitoring from a distance. This camera-based technology enables physiological monitoring in situations where contact-based devices may be problematic or infeasible, such as ambulatory, sleep, and multi-individual monitoring. However, automatically extracting the blood pulse waveform signal is challenging due to the unknown mixture of relevant (pulsatile) and irrelevant pixels in the scene. Here, we propose a signal fusion framework, FusionPPG, for extracting a blood pulse waveform signal with strong temporal fidelity from a scene without requiring anatomical priors. The extraction problem is posed as a Bayesian least squares fusion problem, and solved using a novel probabilistic pulsatility model that incorporates both physiologically derived spectral and spatial waveform priors to identify pulsatility characteristics in the scene. Evaluation was performed on a 24-participant sample with various ages (9–60 years) and body compositions (fat% 30.0 ± 7.9, muscle% 40.4 ± 5.3, BMI 25.5 ± 5.2 kg·m−2). Experimental results show stronger matching to the ground-truth blood pulse waveform signal compared to the FaceMeanPPG (p < 0.001) and DistancePPG (p < 0.001) methods. Heart rates predicted using FusionPPG correlated strongly with ground truth measurements (r2 = 0.9952). A cardiac arrhythmia was visually identified in FusionPPG’s waveform via temporal analysis.
OCIS codes: (100.2960) Image analysis, (170.3880) Medical and biological imaging, (170.1470) Blood or tissue constituent monitoring
1. Introduction
Photoplethysmography (PPG) is a safe and inexpensive cardiovascular monitoring technology [1]. Using an illumination source and detector, transient fluctuations in illumination intensity pertaining to localized changes in blood volume enable non-invasive probing of vascular characteristics. Traditionally, PPG is monitored via a contact probe that operates in either transmittance or reflectance mode, where the source and detector are placed on opposite or the same side of the tissue, respectively. However, this conventional type of monitoring provides hemodynamic information only for a single point, and is an impractical measurement tool in settings such as ambulatory and multi-individual monitoring.
Recent studies have focused on developing and validating photoplethysmographic imaging (PPGI) systems [2]. These systems substitute contact-based detectors with a camera and use non-contact illumination sources, enabling non-contact cardiovascular monitoring from a distance [3]. The additional visual context can enable functionality such as motion compensation during exercise [4], multi-individual tracking [10], and spatial perfusion analysis [11]. One major challenge in PPGI is the automatic extraction of a blood pulse waveform from the video. Decoupling the detector from the body causes several challenges, such as illumination variations, motion changes, and hair occlusion. Furthermore, locations on the body that contain pulsatile flow are not readily apparent. Identifying pixels representing the skin does not guarantee pulsatile blood flow, as some areas may be minimally vascularized, or may not contain pulsatile vessels. In fact, the pulsatile nature of the blood pulse waveform is not fully understood [3, 12].
Existing methods for automatic signal extraction broadly rely on a combination of spatial and spectral information. The RGB components in cameras with Bayer filters have been leveraged to identify the blood pulse waveform using independent component analysis [10, 13], Beer-Lambert modeling [14], and skin composition modeling [15]. However, these methods rely on measuring multispectral reflectance values such as RGB, which may not be appropriate in low-light settings such as sleep monitoring. Furthermore, the tissue penetration depth of incident illumination is wavelength- and tissue-dependent [16]. To solve this problem, some methods rely only on a single wavelength (or color channel) to extract the signal through spatial analysis [4, 11, 17]. Regardless of the spectrum chosen, existing methods average the pixel intensities over chosen areas, such as the facial bounding box [4, 10, 14], predefined facial areas [13, 18], and facial segmentation [17]. Methods relying on facial tracking may fail due to varying lighting conditions, different face-camera perspectives, or from various facial features. Some studies have recognized the importance of extending PPGI beyond heart rate analysis by analyzing heart rate variability as an indicator for cardiac function [5, 10, 13, 18], however these studies use pre-defined areas for extracting the blood pulse waveform, which may not generalize well to new systems or environmental settings (e.g., other anatomies, non-color imaging systems, etc.). Some studies have focused on automatic region of interest (ROI) selection which identifies skin pixels for analysis for more robust signal extraction [6–9]. However these methods rely on RGB color information for computing ICA [6], chromaticity derivatives [7], and chrominance-based skin model [8, 9]. Furthermore, each pixel in the ROI are weighted the same, which may be inconsistent with the underlying physiology. Motivated by the increased performance from automatic region selection, there is a need for pulsatility identification that can be applied in settings where color information is not available, such as low light settings (e.g., sleep studies) or monochromatic camera systems (e.g., for whole-day monitoring).
Here, we propose a spectral-spatial fusion method for extracting a blood pulse waveform from a set of frames from an arbitrary scene. Our goal was to extract signals that exhibited both spectral and temporal fidelity, to enable both spectral and temporal analysis. Using physiologically derived a priori spectral and spatial information related to blood pulse waveforms, our method learns which regions contain the strongest pulsatility based on their physiological relevance rather than their anatomical location, which enables signal extraction across different body types. Results across a 24-participant study show that the proposed method generated signals that exhibited significantly stronger temporal correlation and spectral entropy compared to existing methods. The framework was presented as a general framework that can be used to augment existing or new PPGI systems for assessing pulsatility in arbitrary anatomical locations.
2. Methods
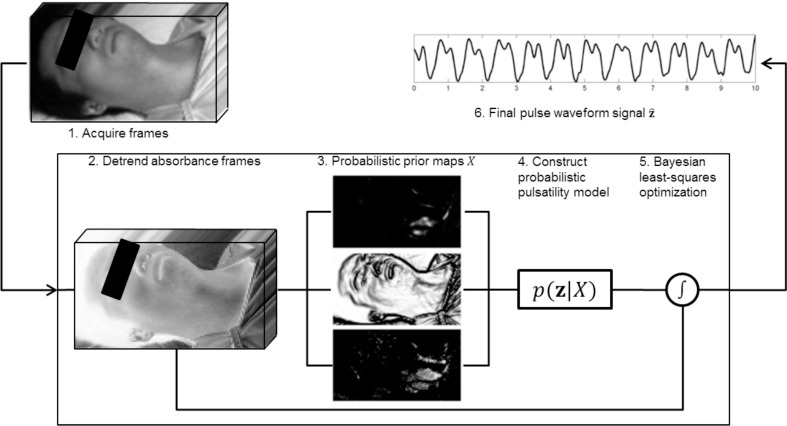
The goal of the spectral-spatial fusion model was to extract a clean temporal blood pulse waveform signal from a scene. By emphasizing temporal fidelity, not only can summary metrics such as heart rate be computed, but important temporal fluctuations such as cardiac arrhythmias can be assessed. The scene is assumed to contain an unknown mixture of relevant regions (i.e., skin areas which exhibit pulsatility), and irrelevant regions (e.g., background, clothing, non-pulsatile skin regions, etc.). Given this mixture of regions (input), the system must discover a temporal PPGI signal (output). Figure 1 provides a graphical overview of the system. Details are provided below.
Fig. 1.
Processing pipeline of the proposed signal extraction method. Acquired frames were converted from reflectance to absorbance and detrended. Spectral-spatial probabilistic prior maps were computed and used to model the posterior distribution representing the pulsatility model. Bayesian least-squares optimization was used to generate the blood pulse waveform signal.
2.1. Problem formulation
Let z = z[t] be the (unknown) true blood pulse waveform. Let X = {xi | 1 ≤ i ≤ n} be a set of absorbance signals, where:
| (1) |
where δ is the Dirac delta function, and T is the sampling period. Here, following the Beer-Lambert law, absorbance is calculated as xi (t) = − log(ri (t)), where ri (t) is the intensity signal for region i. Each signal xi was detrended using a regularized least squares subtraction method which heavily emphasizes a smoothness prior [19]. Given the set of measurements X, which is a mixture of signals from a scene that are both relevant (e.g., skin) and irrelevant (e.g., background, skin folds, hair), the goal is to estimate the “true” blood pulse signal using an intelligently weighted subset of regions that contain pulsatility. This inverse problem can be formulated as a Bayesian problem, where prior physiology knowledge can be injected into the model to educate assumptions about the state (specific priors will be discussed in the following section). Mathematically, it can be solved using the Bayesian least squares formulation [20]:
| (2) |
| (3) |
where p(z|X) is the posterior distribution of state signal z given the measurements X. The optimal solution is found by setting :
| (4) |
Simplifying:
| (5) |
| (6) |
| (7) |
Thus, to solve this equation, the unknown posterior distribution p(z|X) must be modeled. This distribution represents the probability that a state signal z represents the true blood pulse waveform given the observed temporal signals X. The posterior distribution can be modeled as a novel probabilistic pulsatility model, which we approximated using a discrete weighted histogram of the observed states [21]:
| (8) |
where Y is a normalization term such that . The problem then becomes computing the probabilistic prior Wi for each observed signal xi to determine how well it represents the true blood pulse waveform. The following subsections propose a solution using a spectral-spatial model motivated by blood pulse waveform characteristics and vascular physiology.
2.2. Probabilistic pulsatility model
Ideally, p(z|X) should be a function of the SNR of the estimated temporal signal, since this provides information about the signal fidelity. However, SNR requires knowing the true signal, which is unknown at the time of acquisition. A proxy metric for estimating SNR should thus be computed using prior knowledge of blood pulse waveform characteristics. A spectral-spatial model is proposed based on the following two observations, which can be leveraged as prior information in the Bayesian framework presented above:
Spectral: Clean blood pulse waveforms are quasi-periodic, and are primarily composed of a weighted sum of a small set of sinusoidal signals (see Fig. 2).
Spatial: Non-homogeneous skin areas exhibit high variability due to anatomical non-uniformity (e.g., boundary, skin fold, hair).
For motivation, Fig. 2 shows a typical power spectral density of a clean blood pulse waveform. The spectral energy is compact, and is primarily composed of two harmonic frequencies. This indicates the quasi-periodic nature of the blood pulse waveform, and provides rationale for the spectral model.
Fig. 2.
Quasi-periodic nature of a typical blood pulse waveform signal. The periodicity and dicrotic characteristics of the waveform result in predominantly harmonic frequencies in the power spectral density.
In order to compute spectral properties, the normalized 0-DC spectral power distribution for spatial region i was computed:
| (9) |
where Fi (f) are the complex-valued Fourier transform frequency coefficients for . The normalized spectral power (i.e., ) was used to model the relative AC pulsatile amplitude in the unit-less blood pulse waveforms.
The quasi-periodic blood pulse waveform is dominated by the fundamental frequency corresponding to the heart rate and the first harmonic (see Fig. 2). To quantify this property, the spectral power exhibited by the fundamental frequency and first harmonic was computed:
| (10) |
where f* = arg maxf Γi (f), and Δ f is the spectral window’s half-width. We used Δ f = 0.2 Hz. hi was set to 0 for signals whose fundamental frequency was outside of the physiologically realistic heart rate range. The final “harmonic prior” was computed as:
| (11) |
where αh is a tuning parameter. An inverse exponential was used to emphasize small values of (1 − hi) (i.e., strong harmonic contributions).
To quantify noise exhibited by the quasi-periodic waveform, the maximum spectral power response outside of the fundamental heart rate range was found:
| (12) |
The final “noise prior” was computed as:
| (13) |
where αq is a tuning parameter. An inverse exponential model was used to emphasize small values of qi (i.e., low noise).
Local anatomical variations may corrupt any pulsatile signals exhibited by underlying vessels (e.g., hair, skin fold, shadow ridge), or may not contain a pulsatile components at all (e.g., clothing, naris, eyelid). In order to estimate the anatomical uniformity at a given location, the image gradient was computed. In particular, given an image scene Λ whose individual regions are xi, the “spatial prior” was computed as:
| (14) |
where ∇Λ is the gradient of image Λ. An inverse exponential model was used to emphasize small values of ∇Λ (i.e., homogenous areas).
The individual priors for region i were combined to form the final region spectral-spatial probabilistic prior:
| (15) |
where and Ni is the neighborhood around region i. Here, a regional first order statistic constraint was imposed on the priors in order to further enforce spatial cohesion. Substituting this into Eq. (8) produces the estimate of the posterior distribution .
3. Results
3.1. Setup
Data were collected across 24 participants of varying age (9–60 years, (μ ± σ) = 28.7 ± 12.4) and body compositions (fat% 30.0 ± 7.9, muscle% 40.4 ± 5.3, BMI 25.5 ± 5.2 kg·m−2). Participants assumed a supine position throughout the study. A coded hemodynamic imaging (CHI) system was positioned facing down at the participant at a distance of 1.5 m, comprising a monochromatic camera with NIR sensitivity (Point Grey GS3-U3-41C6NIR) and a diffuse halogen illumination source (Lowel Rifa eX 44). To capture deep tissue penetration using NIR wavelengths, and to minimize the effects of visible environmental illumination (e.g., flicker), an 850–1000 nm optical bandpass filter was mounted in front of the camera lens. A video of each participant was recorded at 60 fps, with 16 ms exposure time. The frames were downsampled using 6 × 6 blockwise averaging. The ground truth PPG waveform was synchronously recorded using the Easy Pulse photoplethysmography finger cuff [22]. Though the data were recorded at a slight angle, the proposed method is independent of view angle due to region-wise pulsatility evaluation, and thus can be used in different experimental setups.
We compared our method, henceforth called FusionPPG, with DistancePPG [17] and “Face-MeanPPG”, where the face is tracked and the signal is extracted through framewise spatial averaging. This method is commonly used in similar studies [4, 10, 13]. Many pulse extraction methods rely on processing individual color channels [10, 13, 14, 23], and were therefore infeasible for this study (and infeasible in low-light settings, such as sleep studies). For our implementation of FaceMeanPPG, we spatially averaged the area identified by Viola-Jones face tracker [10]. Though DistancePPG was evaluated using a green LED in its original form [17], the methods generalize to any single-channel imaging system, and thus could be used in this NIR monochrome setup. In its original implementation, DistancePPG requires estimating the true heart rate based on an averaging approach similar to FaceMeanPPG [17]. To generate optimal results of the comparison algorithm, DistancePPG was provided with the ground-truth heart rate (rather than their estimation method, which was found to fail in some cases). Since the participants exhibited minimal movement, the frames were inherently temporally co-aligned, and thus tracking was disabled for FaceMeanPPG and DistancePPG.
In order to evaluate and compare signal fidelity between methods, normalized spectral entropy (H) and Pearson’s linear correlation coefficient (ρ) were computed for each extracted signal:
| (16) |
where Z is the normalized spectral power for z according to Eq. (9), and
| (17) |
where , σy are the standard deviation of the extracted signal and ground-truth signal respectively, and is the covariance between the two signals. To account for pulse time differences between the neck/head and finger, the maximum forward-sliding cross-correlation value within a short temporal window was used.
The heart rate of a blood pulse waveform signal was computed in the temporal domain using an autocorrelation scheme for increased temporal resolution [24]. Specifically, each waveform was resampled at 200 Hz using cubic spline interpolation, and autocorrelation peaks were detected and used to estimate heart rate:
| (18) |
where Fs is the sampling rate, and Δt is the time shift yielding peak autocorrelation response. Hyperparameter optimization was performed to find optimal tuning parameters {αh, αq, αl} using a grid search method with the following performance metric:
| (19) |
where is the kth Fourier coefficient of the estimated signal , and η is the set of coefficients pertaining to the fundamental frequency and first harmonic of the . An exponential grid search was performed over the space α ∈ [10−2, 10], which when substituted into the weight term exp(−x2/α) effectively changes the width of the inverse exponential, representing the space of hyperparameters from strong weight bias (small width) to weak weight bias (large width). When choosing the optimal hyperparameters, signals exhibiting physiologically unrealistic heart rates were excluded.
One participant’s data were removed due to erroneous ground-truth waveform readings. The study was approved by a University of Waterloo Research Ethics committee.
3.2. Data analysis
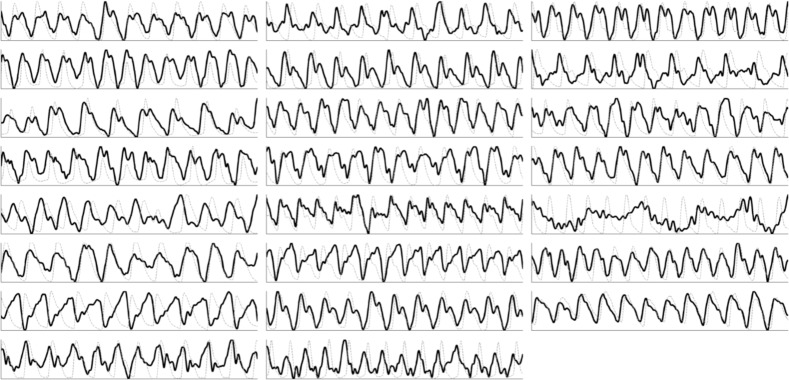
Figure 3 shows the signals extracted using the proposed fusion method compared to the ground-truth finger waveform. The waveforms exhibited high temporal fidelity, and were highly correlated to the ground-truth waveforms. Some participants exhibited temporally offset signals relative to the ground-truth PPG since the measured area (head) is closer to the source (heart) than the PPG (finger). Furthermore, finger pulsatility may be affected by ambient conditions such as temperature [25], changing the vascular resistance and thus the pulse arrival time. The foot of each blood pulse waveform can be observed, signifying the precise time of the start of ventricular contraction. The method failed on one participant due to high fat content (42.3%).
Fig. 3.
Signals extracted from all 23 participants using the proposed FusionPPG method (black), plotted against to the ground-truth FingerPPG waveform (gray, dotted).
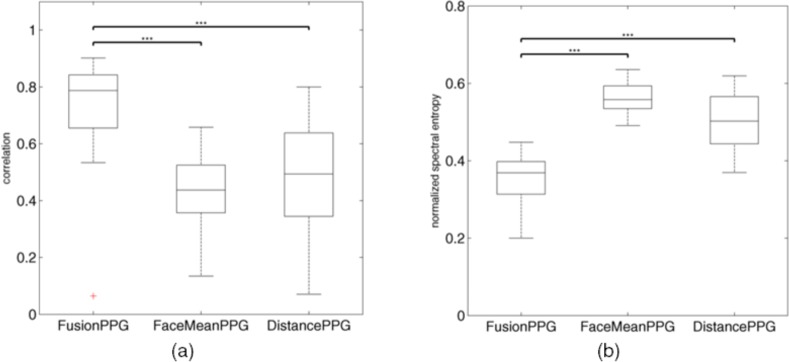
FusionPPG outperformed both comparison methods on the sample dataset. Figure 4 compares the box plot of the proposed and comparison methods using correlation (higher is better) and normalized spectral entropy (lower is better). FusionPPG attained statistically significantly higher correlation to the ground-truth waveform than FaceMeanPPG (p < 0.001) and DistancePPG (p < 0.001), signifying signals with higher temporal fidelity. FusionPPG also attained statistically significantly lower normalized spectral entropy than FaceMeanPPG (p < 0.001) and DistancePPG (p < 0.001), signifying more compact frequency components, consistent with the quasi-periodic nature of a true blood pulse waveform. DistancePPG attained higher correlation and lower entropy than FaceMeanPPG, consistent with previous findings [17].
Fig. 4.
Box plot comparison of the correlation (a) and normalized spectral entropy (b) between the signals extracted using the proposed (FusionPPG) and the two comparison (FaceMeanPPG, DistancePPG) methods. FusionPPG exhibited significantly higher correlation and significantly lower spectral entropy (i.e., higher spectral compactness) compared to FaceMeanPPG and DistancePPG. (***statistically significant difference, p < 0.001)
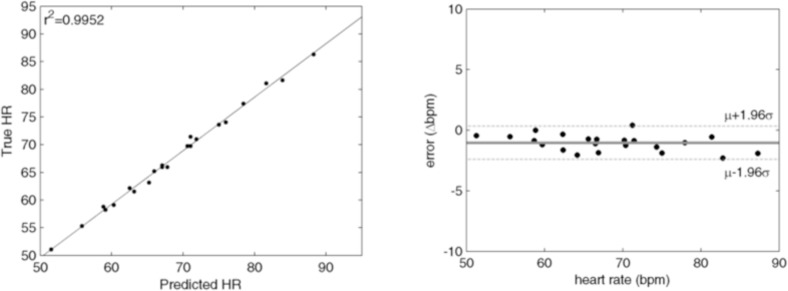
FusionPPG was able to precisely estimate heart rate from the extracted waveforms. Figure 5 shows the correlation and Bland-Altman plots showing FusionPPG’s ability to extract precise and accurate heart rate. The predicted heart rates were highly correlated to the ground-truth heart rate (r2 = 0.9952), and were in tight agreement, with low mean error (μ = −1.0 bpm) and low variance (σ = 0.70 bpm). The data were well represented within two standard deviations from the mean. The outlier was omitted from this analysis due to failed signal extraction.
Fig. 5.
Correlation and Bland-Altman plots of the predicted heart rates using the extracted blood pulse waveform signal. The predicted heart rates were highly correlated to the ground-truth heart rate (r2 = 0.9952), and were in tight agreement (μ = −1.0 bpm, σ = 0.70 bpm). The outlier was omitted due to failed signal extraction.
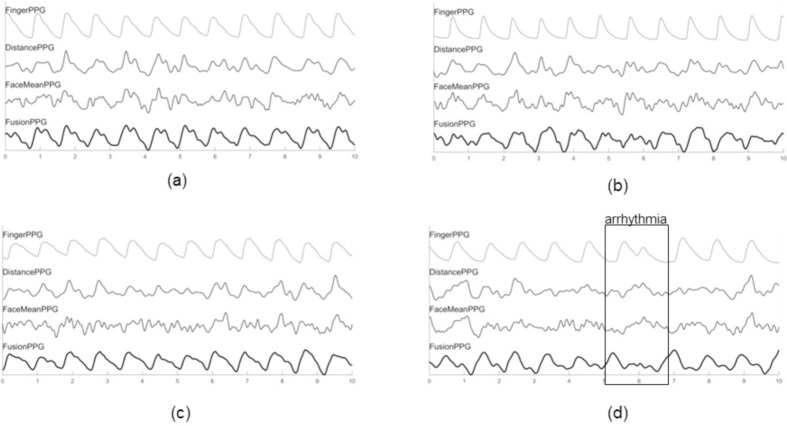
Figure 6 compares the extracted waveforms from four participants using the three methods to the ground-truth waveform. The strongest waveforms (i.e., highest correlation) from DistancePPG, FaceMeanPPG, and FusionPPG were shown. An important characteristic is the foot of the waveform, which signifies the start of ventricular contraction. This foot was observed in each case, whereas it was not easily discernible in either DistancePPG or FaceMeanPPG due to the effects of averaging, resulting perhaps in a strong fundamental frequency which can predict heart rate, but is affected by spurious irrelevant frequencies that corrupt the waveform shape.
Fig. 6.
Extracted waveforms from the proposed and comparison methods across four participants. The selected waveforms were those that exhibited the strongest correlation from DistancePPG (a), FaceMeanPPG (b), FusionPPG (c), and a participant with arrhythmia (d). FusionPPG was able to extract strong waveforms across all participants, enabling the visual assessment of a cardiac arrhythmia (at t = 6 s).
Figure 6(d) shows a participant that experienced a cardiac arrhythmia. An irregular cardiac contraction was observed at t = 6 s, resulting in a delayed contraction. Such cases cannot be easily observed using standard heart rate analysis in the frequency domain. However, the irregular heartbeat and delayed follow-up contraction was observed in FusionPPG’s waveform, whereas it was not readily apparent in FaceMeanPPG or DistancePPG. This demonstrates the important of temporal signal fidelity to assess irregular cardiac events that deviate from typical waveforms.
4. Discussion
In this study, the most pulsatile areas were often found in the neck region. Figure 7 shows a typical computed pulsatility distribution overlayed onto the original frame, showing strong pulsing in the neck4. The neck contains important vascular pathways, including the carotid arteries, which are major vessels that are closely connected to the heart and are close to the surface compared to other major arteries in the body. Pulsatile information in the face is more subdued, since the small arteries and arterioles are found further down the vascular tree. Thus, many existing methods that extract signals from the face may be at a disadvantage, and miss the rich information present in the neck.
Fig. 7.
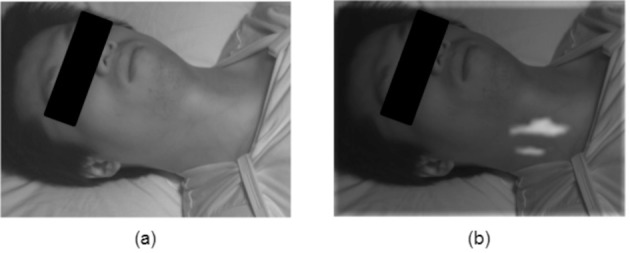
Typical pulsatility distribution based on spectral-spatial fusion. An original frame (a) is used to compute and overlay the probabilistic pulsatility distribution (b). The strongest pulsing was often observed in the neck region, contributing strongly to the blood pulse waveform extraction.
The extraction method failed on the participant who had the highest fat % of the sample. Skin folds and thick tissue layers contributed to the inability to extract a signal with any of the three methods evaluated in this study. Many existing studies do not provide participant body composition, which is an important parameter when assessing signal strength.
Traditional heart rate variability is assessed through the RR peak intervals using an electrocardiogram. However, similar timing differences can be observed and quantified using the blood pulse waveform. An important part of this waveform is the blood pulse foot, which is the minimum point just prior to inflection due to the oncoming blood pulse. The blood pulse is ejected from the heart due to left ventricular contraction, which is directly controlled by the electrical signals governing the heart mechanics. The timing difference between the ECG’s R peak and the PPG’s foot is the pulse transit time. Thus, timing differences between the blood pulse feet indicate timing differences in the heart [26]. An important characteristic that is not often discussed in PPGI studies is its ability to extract and assess abnormal waveforms (e.g., arrhythmia). In order to be useful as a health monitoring system, a PPGI system must not directly or indirectly assume normal waveforms. This was apparent in the arrhythmia case (Fig. 6(d)), where FusionPPG’s waveform was able to temporally convey an abnormal cardiac event. During validation, emphasis should be placed on detected abnormal as well as normal waveforms.
Many existing methods, including DistancePPG and FaceMeanPPG, require tracking and/or segmenting the individual’s face. However, it may be beneficial to assess pulsatility in areas other than the face (e.g., arm, hand, leg, foot). These methods will fail at this task since no face will be detected. In contrast, FusionPPG does not make any a priori assumptions about anatomical locations, and may therefore be used to assess pulsatility at other anatomical locations in future work.
Though the scope of the current study was limited to participants in supine position, motion artifacts may be problematic in other environmental conditions (e.g., exercising, ambient-based monitoring). In such cases, a motion compensation algorithm should be applied prior to computing the spectral-spatial probabilistic maps such that frames are spatially aligned. Existing single-wavelength PPGI motion compensation methods can be used for motion compensation during head movements [10, 15, 17] and exercise [4]. Furthermore, though validation was performed using the NIR spectra, the proposed method can be used by systems of any spectral content, as long as photon penetration depth and hemoglobin absorption is favorable for blood pulse identification.
Some existing color-based methods exist for automated region selection [6–9], which show increased accuracy when selecting image regions in an informed manner. The proposed method provides several advantages over these color-based methods. First, FusionPPG does not rely on multispectral color data acquisition, which may be problematic in low-light environment, imaging in high melanin density tissues [17], and imaging systems that use near infrared illumination sources for increased photon depth of penetration (e.g., for deep arterial analysis) [27]. Second, FusionPPG does not assume a cohesive region of interest. By treating each location as quasi-independent, anatomically irrelevant areas (e.g., hair, shadows) are excluded. Third, FusionPPG does not require skin tone calibration or prediction. Near infrared light is particularly suitable for analysis of various skin tones due to the decreased melanin absorption at these wavelengths [28]. Though visible light exhibits higher absorption in the visible than near infrared spectrum, one must also consider the effect of scatter and reduced absorption on photon attenuation. Primarily forward scattering photons that do not become attenuated before emitting from the tissue enable deeper tissue analysis [28] where major arteries reside. Though the fundamental nature of the PPG signal is still unknown [1,12], deeper probing and physiological prior models increase the probability of hemodynamic-induced signal fluctuations rather than motion.
5. Conclusions
We have proposed a probabilistic signal fusion framework, FusionPPG, for extracting a blood pulse waveform signal from a scene using physiologically derived prior information. This was accomplished by posing the problem as a Bayesian problem and modeling the posterior distribution as a novel probabilistic pulsatility model that incorporated spectral and spatial priors derived from blood pulse waveform physiology. Results showed signals with strong temporal fidelity. The proposed method’s improvement over the comparison methods was statistically significant (p < 0.001) by assessing correlation and normalized spectral entropy. A cardiac arrhythmia was visually identifiable in the FusionPPG’s waveform, showing future promise for cardiac illness identification. The model has presented such that it allows for future extensions based on this general theoretical framework
Funding
This work was supported by the Natural Sciences and Engineering Research Council (NSERC) of Canada, AGE-WELL NCE Inc., and the Canada Research Chairs program.
References and links
- 1.Allen J., “Photoplethysmography and its application in clinical physiological measurement,” Physiol. Meas. 28(3), R1–R39 (2007). 10.1088/0967-3334/28/3/R01 [DOI] [PubMed] [Google Scholar]
- 2.Sun Y., Thakor N., “Photoplethysmography revisited: from contact to noncontact, from point to imaging,” IEEE Trans. Biomed. Eng. 63(3), 463–477 (2016). 10.1109/TBME.2015.2476337 [DOI] [PMC free article] [PubMed] [Google Scholar]
- 3.Allen J., Howell K., “Microvascular imaging: techniques and opportunities for clinical physiological measurements,” Physiol. Meas. 35(7), R91 (2014). 10.1088/0967-3334/35/7/R91 [DOI] [PubMed] [Google Scholar]
- 4.Sun Y., Hu S., Azorin-Peris V., Greenwald S., Chambers J., Zhu Y., “Motion-compensated noncontact imaging photoplethysmography to monitor cardiorespiratory status during exercise,” J. Biomed. Opt. 16(7), 077010 (2011). 10.1117/1.3602852 [DOI] [PubMed] [Google Scholar]
- 5.Sun Y., Hu S., Azorin-Peris V., Kalawsky R., Greenwald S., “Noncontact imaging photoplethysmography to effectively access pulse rate variability,” J. Biomed. Opt. 18(6), 061205 (2013). 10.1117/1.JBO.18.6.061205 [DOI] [PubMed] [Google Scholar]
- 6.Gibert G., D’Alessandro D., Lance F., “Face detection method based on photoplethysmography,” in Proceedings of Adv. Video and Signal Based Surveillance (IEEE, 2013), pp. 449–453. [Google Scholar]
- 7.van Luijtelaar R., Wang W., Stuijk S., de Haan G., “Automatic ROI Detection for camera-based pulse-rate measurement,” in Proceedings of Asian Conf. Comput. Vision (Springer, 2014), pp. 360–374. [Google Scholar]
- 8.Wang W., Stuijk S., de Haan G., “Unsupervised subject detection via remote PPG,” IEEE Trans. Biomed. Eng. 62(11), 2629–2637 (2015). 10.1109/TBME.2015.2438321 [DOI] [PubMed] [Google Scholar]
- 9.Calvo-Gallego E., de Haan G., “Automatic ROI for remote photoplethysmography using PPG and color features,” in Proceedings of Int. Conf. Comput. Vision Theory Appl. (SCITEPRESS, 2015), pp. 357–364. [Google Scholar]
- 10.Poh M.-Z., McDuff D. J., Picard R. W., “Non-contact, automated cardiac pulse measurements using video imaging and blind source separation,” Opt. Express 18(10), 10762–10774 (2010). 10.1364/OE.18.010762 [DOI] [PubMed] [Google Scholar]
- 11.Kamshilin A. A., Miridonov S., Teplov V., Saarenheimo R., Nippolainen E., “Photoplethysmographic imaging of high spatial resolution,” Biomed. Opt. Express 2(4), 996–1006 (2011). 10.1364/BOE.2.000996 [DOI] [PMC free article] [PubMed] [Google Scholar]
- 12.Kamshilin A. A., Nippolainen E., Sidorov I. S., Vasilev P. V., Erofeev N. P., Podolian N. P., Romashko R. V., “A new look at the essence of the imaging photoplethysmography,” Sci. Rep. 5, 10494 (2015). 10.1038/srep10494 [DOI] [PMC free article] [PubMed] [Google Scholar]
- 13.McDuff D., Gontarek S., Picard R. W., “Improvements in remote cardiopulmonary measurement using a five band digital camera,” IEEE Trans. Biomed. Eng. 61(10), 2593–2601 (2014). 10.1109/TBME.2014.2323695 [DOI] [PubMed] [Google Scholar]
- 14.Xu S., Sun L., Rohde G. K., “Robust efficient estimation of heart rate pulse from video,” Biomed. Opt. Express 5(4), 1124–1135 (2014). 10.1364/BOE.5.001124 [DOI] [PMC free article] [PubMed] [Google Scholar]
- 15.Wang W., Stuijk S., De Haan G., “Exploiting spatial redundancy of image sensor for motion robust rPPG,” IEEE Trans. Biomed. Eng. 62(2), 415–425 (2015). 10.1109/TBME.2014.2356291 [DOI] [PubMed] [Google Scholar]
- 16.Anderson R. R., Parrish J. A., “The optics of human skin,” J. Invest. Dermatol. 77(1), 13–19 (1981). 10.1111/1523-1747.ep12479191 [DOI] [PubMed] [Google Scholar]
- 17.Kumar M., Veeraraghavan A., Sabharwal A., “DistancePPG: Robust non-contact vital signs monitoring using a camera,” Biomed. Opt. Express 6(5), 1565–1588 (2015). 10.1364/BOE.6.001565 [DOI] [PMC free article] [PubMed] [Google Scholar]
- 18.McDuff D., Gontarek S., Picard R. W., “Remote detection of photoplethysmographic systolic and diastolic peaks using a digital camera,” IEEE Trans. Biomed. Eng. 61(12), 2948–2954 (2014). 10.1109/TBME.2014.2340991 [DOI] [PubMed] [Google Scholar]
- 19.Tarvainen M. P., Ranta-aho P. O., Karjalainen P. A., “An advanced detrending method with application to HRV analysis,” IEEE Trans. Biomed. Eng. 49(2), 172–175 (2002). 10.1109/10.979357 [DOI] [PubMed] [Google Scholar]
- 20.Fieguth P., Statistical Image Processing and Multidimensional Modeling (Springer, 2010). [Google Scholar]
- 21.Wong A., Mishra A., Zhang W., Fieguth P., Clausi D. A., “Stochastic image denoising based on Markov-chain Monte Carlo sampling,” Signal Process. 91(8), 2112–2120 (2011). 10.1016/j.sigpro.2011.03.021 [DOI] [Google Scholar]
- 22.R-B , “Easy Pulse sensor (version 1.1) overview (part 1),” http://embedded-lab.com/blog/?p=7336). (12 December 2014).
- 23.de Haan G., Van Leest A., “Improved motion robustness of remote-ppg by using the blood volume pulse signature,” Physiol. Meas. 35(9), 1913 (2014). 10.1088/0967-3334/35/9/1913 [DOI] [PubMed] [Google Scholar]
- 24.Wander J., Morris D., “A combined segmenting and non-segmenting approach to signal quality estimation for ambulatory photoplethysmography,” Physiol. Meas. 35(12), 2543–2561 (2014). 10.1088/0967-3334/35/12/2543 [DOI] [PubMed] [Google Scholar]
- 25.Imholz B. P., Wieling W., van Montfrans G. A., Wesseling K. H., “Fifteen years experience with finger arterial pressure monitoring,” Cardiovasc. Res. 38(3), 605–616 (1998). 10.1016/S0008-6363(98)00067-4 [DOI] [PubMed] [Google Scholar]
- 26.Schäfer A., Vagedes J., “How accurate is pulse rate variability as an estimate of heart rate variability?: A review on studies comparing photoplethysmographic technology with an electrocardiogram,” Int. J. Cardiol. 166(1), 15–29 (2013). 10.1016/j.ijcard.2012.03.119 [DOI] [PubMed] [Google Scholar]
- 27.Wang L. V., Wu H.-i., Biomedical Optics: Principles and Imaging (John Wiley & Sons, 2012). [Google Scholar]
- 28.Jacques S. L., “Optical properties of biological tissues: a review,” Physics in Med. and Biol. 58(11), R37–R61 (2013). 10.1088/0031-9155/58/11/R37 [DOI] [PubMed] [Google Scholar]


