Abstract
Assessment of the cardiovascular parameters using noncontact video-based or imaging photoplethysmography (IPPG) is usually considered as inaccurate because of strong influence of motion artefacts. To optimize this technique we performed a simultaneous recording of electrocardiogram and video frames of the face for 36 healthy volunteers. We found that signal disturbances originate mainly from the stochastically enhanced dichroic notch caused by endogenous cardiovascular mechanisms, with smaller contribution of the motion artefacts. Our properly designed algorithm allowed us to increase accuracy of the pulse-transit-time measurement and visualize propagation of the pulse wave in the facial region. Thus, the accurate measurement of the pulse wave parameters with this technique suggests a sensitive approach to assess local regulation of microcirculation in various physiological and pathological states.
OCIS codes: (170.3880) Medical and biological imaging, (030.4280) Noise in imaging systems, (280.1415) Biological sensing and sensors
1. Introduction
Human heart rate, heart rate variability (HRV), and pulse transit time (PTT) are critical vital signs for medical diagnosis and estimation of the health conditions of an individual. The HRV is often used to quantify the activity of the autonomous nervous system in different physiological conditions and diseases [1–3]. The PTT defines the pulse wave velocity, which can serve as a prognostic marker for various diseases such as hypertension, diabetes, and peripheral atherosclerosis [4,5]. Both HRV and PTT rely on the measurements of the position of every cardiac cycle in the time scale. Currently electrocardiography (ECG) is a gold standard to measure HRV from the analysis of R-R intervals. An alternative of the ECG in assessment of the cardiac cycle periods is recording of the arterial-pressure pulse wave. These recordings can be provided by piezoelectric transducer [5,6], Doppler ultrasound [7,8], and photoplethysmographic (PPG) sensors [9–11]. PTT is usually defined as the time interval between the negative Q-wave of the ECG and the arrival of the foot of the arterial blood pulse at the peripheral site of measurements [9,12]. However, all these techniques (including ECG) require contacts to the body, which is often inconvenient thus motivating the researchers to seek simpler techniques of blood pulsations monitoring. Recently, video based or imaging photoplethysmography (IPPG) was introduced as a technique for distant measurement and monitoring of cardiovascular functions [13–16]. This method became very popular among researchers because of its ease of use and potentially low cost. One main advantage of IPPG is that it could be applied in different parts of the body including easily accessible ones such as the human face [17–20]. Similar to the PPG waveform, IPPG signals follows the changes of the arterial blood pressure [21], but in contrast to the contact PPG sensors these changes are measured simultaneously in many physically different areas of the body.
However, the wide use of IPPG systems is limited by low signal-to-noise ratio (SNR). Most of the researchers attribute signal disturbances, which lead to low SNR, to the motion artefacts. To recover the signal related to the cardiac activity, several algorithms of IPPG data processing were proposed [17,22–25]. These algorithms are based on the independent components analysis [17,22], principle components analysis [23], wavelet transform [24], and weighted average of different channels [25]. All of them were aimed to seek an optimal shape of the PPG waveform, which is assumed to be unique for the whole area under study. This idea stems from the suggestion that the heart is the unique source of the blood pressure wave. However, the parameters of the blood pressure wave at the peripheral site (like face or limbs) are different from the initial ones (in the heart) [6], and they could vary even in small adjacent areas because of the pulse wave propagation through the vascular system.
In this work, we used a custom-made IPPG system synchronized with the electrocardiograph to estimate PTT from the heart to each small area at the subject's face. Considering our experimental finding that the disturbances of the PPG waveform originate mainly from variable physiological parameters of the cardiovascular system caused by the stochastically enhanced dicrotic notch, a new robust algorithm of the IPPG data processing was proposed. In contrast with previous algorithms mainly devoted to visualization of blood pulsations amplitude, it allows accurate estimation of the anacrotic-wave beginning with high temporal and spatial resolution. Thus, we demonstrate for the first time to our knowledge that the proposed algorithm allows accurate mapping of PTT in the facial area. This opens new possibilities for visualization of the pulse wave propagation in different parts of the body in various physiological states and disease.
2. Methods and subjects
2.1 Participants
Measurements were carried out with 36 healthy volunteers (18 men and 18 women). Age of subjects was varying from 18 to 66 years. Experiments were carried out in the Federal Almazov North-West Medical Research Center, Saint-Petersburg, Russia. This study was conducted in accordance with the standards of application of new medical techniques laid down by Order of the Ministry of Health of the Russian Federation No.25 on 16.02.1994. The study plan was approved on February 6, 2016 (Record No. 30) by the research ethical committee of the Federal Almazov North-West Medical Research Center prior the experiments. All subjects gave their written informed consent of participation in the experiment.
2.2 Experimental protocol and setup
We collected experimental data using custom-made IPPG system synchronized with a digital electrocardiograph (model KAP-01-“Kardiotekhnika-EKG” of the Incart Ltd.). Video recording of the facial area of each subject was carried out in the sedentary position. During video recording with duration of 32 s, a subject was asked to sit comfortably, breath normally, avoid any movement, and lean his head on a properly adjusted support as schematically shown in Fig. 1. To implement ECG recordings, disposable electrodes were attached to the left and right wrists with the reference electrodes on the legs. We used two leads to collect ECG data.
Fig. 1.
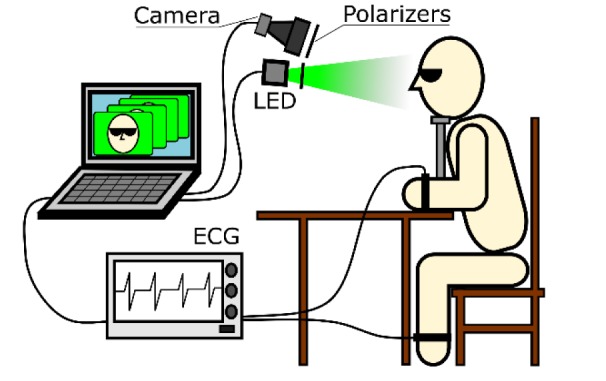
Experiment layout for simultaneous recording of imaging PPG and ECG.
All videos were recorded at 39 frames per second (fps) with the resolution of 752 × 480 pixels, and saved frame-by-frame in a personal computer in the portable network graphic (PNG) format. The optical part of the system was similar to that described in our previous work [18]. The IPPG system consisted of a digital black-and-white CMOS camera (8-bit model GigE uEye UI-5220SE of the Imaging Development Systems GmbH) and a light-emitting diode (LED) source for subject’s face illumination. We used two green LEDs with the central wavelength of 530 nm, spectral bandwidth of 40 nm, and the power of 4 W for each LED. To mitigate influence of motion artefacts, the polarization filtration technique [26], which exploits a pair of crossed polarizers, was applied (Fig. 1). The distance between the camera lens and subject under study was about 1 m. Experiments were carried out in the laboratory providing that the intensity of the LED illumination at the subject’s face was at least ten times higher than the intensity of the ambient illumination. Synchronization accuracy of the ECG and video recordings was better than one millisecond.
2.3 Data processing
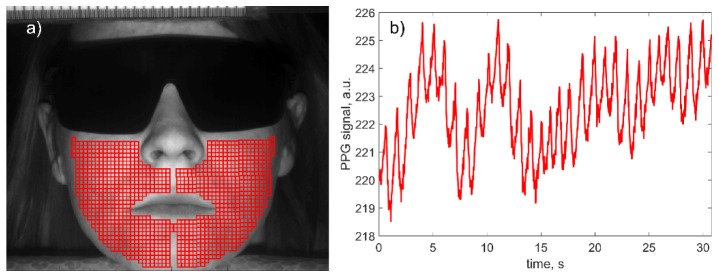
Recorded video frames were processed off-line together with the ECG signal by using custom software implemented in the MATLAB platform. In contrast to our previous algorithms of IPPG data processing, here we aimed to assess the transit time of the pulse wave, which includes the following steps. First, in the recorded image of the subject’s face, we selected manually two regions of equal area in the right and left cheeks excluding the lips and nose as shown in Fig. 2(a). These regions were completely covered by small Regions of Interest (ROI) sizing 7 × 7 pixels (2.1 × 2.1 mm2 in the face). Each ROI was chosen not to overlap an adjacent ROI but to have a common border. The average number of the selected ROIs in each individual was 917. Second, we calculated a PPG waveform as a frame-by-frame evolution of average pixel values in every chosen ROI. An example of the raw PPG waveform without any filtration is shown in Fig. 2(b). Note that no image stabilization was applied while calculating the raw PPG signal. It is seen that the PPG signal consists of alternative component (AC) modulated at the heartbeat frequency, which is superimposed with the slowly varying component (DC). Such a shape is typical for a PPG waveform [27,28].
Fig. 2.
(a) Selection of the set of ROIs in the recorded video frame, and (b) an example of the raw PPG waveform obtained from one of the selected ROIs sizing 7 × 7 pixels (2.1 × 2.1 mm2).
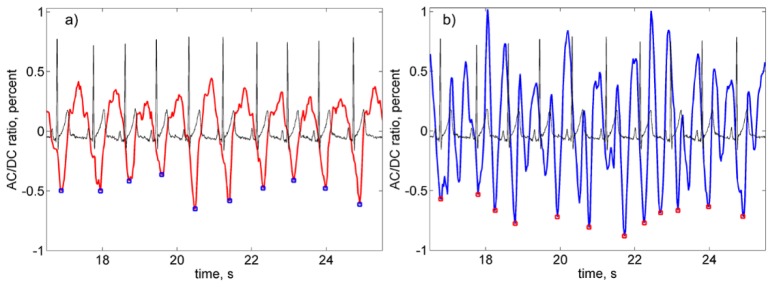
Third, we calculated AC-to-DC ratio of the raw PPG signal (thus compensating non-uniformity of the face illumination), deduced the unity from the calculated ratio, and inverted the sign. After these transformations, the waveform positively correlates with variations of arterial blood pressure in time [21,27]. An example of the filtered PPG waveform overlaid with the ECG signal is shown in Fig. 3(a). Minima and maxima of the PPG signal correspond to the diastolic and systolic pressure, respectively. Such a waveform can be used to assess the PTT as the time difference between the QRS-complex in ECG and a fiducial point in PPG. If R-peak from ECG can be detected with high accuracy and reproducibility [29], several methods (such as the minimum value, the maximum of 1st derivative, the maximum of the 2nd derivative, intersecting tangents, and diastole patch) for the fiducial-point detection from the PPG waveform were considered and compared [6,12,30,31].
Fig. 3.
Fragments of the filtered PPG waveform overlaid with synchronously recorded ECG signal. (a) PPG waveform from the ROI selected as reliable, and (b) a waveform unsatisfying both criteria of reliable ROI selection. Both ROIs were in the same cheek with the distance between their centers of 4 mm. Small squares show position of the defined minima of the PPG waveforms.
Recent comparative study showed that the minimum-value method provides good correlation with ECG in the case of the contact PPG sensor applied to the limb [31]. However, SNR in non-contact IPPG system is rather low [23–25] that is the main obstacle for direct application of this method to assess PTT. Nevertheless, here we used an algorithm based on the minimum-value method because the PPG minimum is related physiologically with the R-peak in ECG: the latter corresponds to depolarization of the left heart ventricle whereas the former is the beginning of the anacrotic wave with fast blood-pressure increase. In the example shown in Fig. 3(a), the number of R-peaks is equal to that of the PPG minima. However, this equality was not observed in every selected ROI. Typical example of the waveform in which the number of the minima does not coincide with the number of R-peaks is shown in Fig. 3(b). Both waveforms in Fig. 3 were obtained from the same set of the video data for two ROIs situated on the same cheek and spaced from one another by 4 mm.
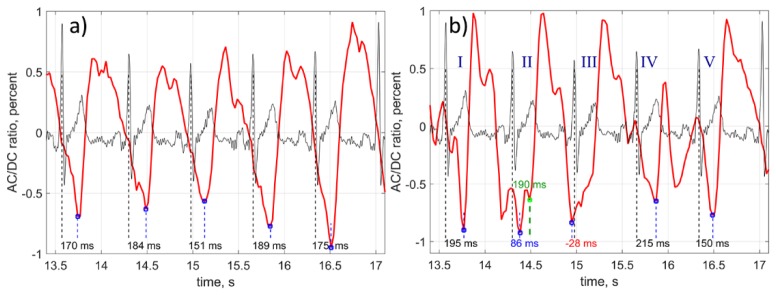
Considering the simultaneous character of the data recording and small distance between the ROIs, we hypothesize that disturbances of the waveform stem from physiological reasons, not from motion artefacts. We suggest that it is dicrotic notch which disturbs the classical shape of PPG waveforms thus resulting in incorrect definition of the anacrotic wave beginning. Occurrence of the enhanced notch is illustrated in Fig. 4 where the panel (a) shows a fragment of the waveform in which all notches are located near the maxima, whereas one can clearly see in the panel (b) two additional notches near the anacrotic wave in the waveform obtained from another ROI at the same cheek. It is worth noting that the distance between these two ROIs was only 7 mm. It should be underlined that the enhanced notches appear in different ROIs at different cardiac cycles. In other words, appearance of the enhanced notches has stochastic character in both space and time. Moreover, the frequency of the enhanced notches occurrence varies from one subject to another.
Fig. 4.
Illustration of the PPG waveform distortion by the stochastically enhanced notch. Fragment of the waveform without distortion (a), and with two notches appeared near the anacrotic wave (b). Black curves shows simultaneously recorded ECG. Both PPG waveforms were calculated from the ROIs spaced by 4.2 mm. Small blue squares show position of the found minima. Green square in the cardiac cycle II shows the position of the second local minimum defined by our algorithm.
To reveal the correct position of the anacrotic-wave beginning from the waveforms distorted by the dicrotic notches, we proposed the following algorithm. The beginning of the anacrotic wave is sought in every cardiac cycles which borders are defined by the R-peaks. However, only those minima are selected, the delay between which and R-peak is within the expected interval from 90 to 300 milliseconds. The limits of this interval were found empirically based on the data of the current study. If the waveform minimum is out of the interval, the program looks for another local minimum. The cardiac cycle in which no minimum is found within the expected interval, is removed from the consideration. Referring Fig. 4(b), the cardiac cycle III was thrown out, whereas the local minimum in the cycle II (marked by small green square) was taken into account. If the number of residual cardiac cycles is less than 10, the ROI is marked as non-reliable. Otherwise, we calculate the correlation between sequences of the periods of residual cardiac cycles estimated from PPG and ECG. Only the ROIs in which the correlation coefficient r is larger than 0.5 and significance p < 0.05 were marked as reliable and taken into account. The anacrotic wave beginning in each reliable ROI was found as the minimum position of the mean shape obtained after averaging the segments of the PPG waveform within the expected interval (90 – 300 ms) only for residual cardiac cycles. Similar technique is widely used in analysis of the ECG peaks shape [32]. PTT was calculated as the time difference between the found minimum and R-peak. In each reliable ROI we calculated the standard deviation (STD) of PTT accounting only the minima found in the residual cardiac cycles.
3. Results
3.1 Influence of dicrotic notch
To demonstrate the dicrotic-notch effect, we switched off the block of our program responsible for selection of the cardiac cycles with the PPG-minima delay within the expected interval. Nevertheless, the criterion for marking a ROI as reliable was kept the same: the correlation coefficient r > 0.5 and significance p < 0.05. This algorithm is direct application of the minimal-value method to PTT assessment. In this case no reliable ROI was found in two subjects of 36. The average number of reliable ROIs was 368, whereas the mean number of totally selected ROIs was 917. In contrast, applying the algorithm described in Sect. 2.3, reliable ROIs were found in all studied subjects with the average number of reliable ROIs increased up to 717. Note that both algorithm were compared for the same selection of the ROIs in each subject. Average percentage of reliable ROIs in the latter case was 81%, which was sufficient for statistical analysis. The minimal number of the reliable ROIs found by our new algorithm was 292.
Comparison of the STD of the mean PTT obtained in both algorithms is shown in Fig. 5. Red bars in Fig. 5 show STD calculated with the directly used method of the minimum value, whereas green bars are STD obtained with our new advanced algorithm. As one can see, STD decreases in all subjects in average by 2.3 times. Values of STD presented in Fig. 5 were averaged over all reliable ROIs in both algorithms. PTT calculated with the proposed algorithm (green bars) has STD varying from 9.8 to 24.4 ms for different subjects. Even the largest STD provided enough accuracy to resolve variability of PTT in different parts of the facial area. We interpret significant increase of the number of reliable ROIs and decrease of the STD by diminished contamination by the dicrotic notch after data processing with new algorithm.
Fig. 5.
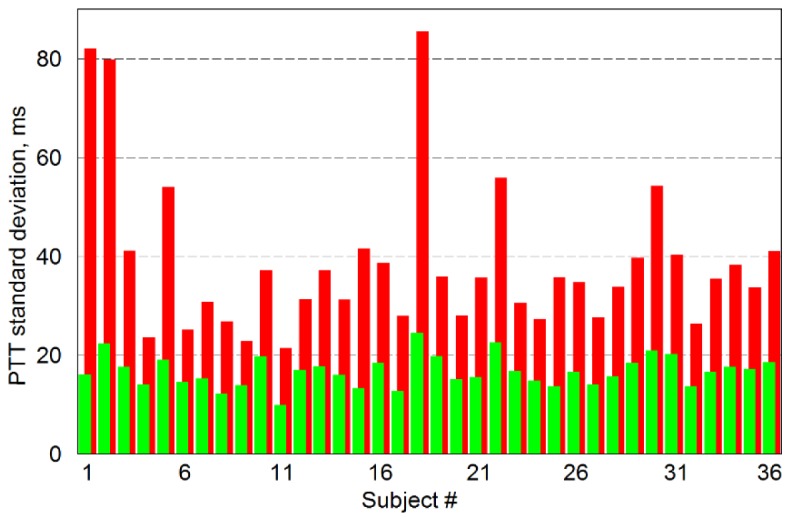
Standard deviation from the mean PTT calculated for all studied subjects. Red bars show mean STD calculated for all reliable ROI in the case of direct application of the minimal-value method when all cardiac cycles were taken into account. Green bars are STD calculated by new algorithm, which is finding PPG minima associated with the beginning of anacrotic wave in cardiac cycles distorted by dicrotic notch.
3.2 Dependence on the ROI size
On the one hand, by increasing the ROI size, we diminish the spatial resolution and may lose information about PTT change in different ROIs. On the other hand, in smaller ROI the spatial resolution is increased in expense of the increasing time of the data processing. Moreover, SNR of the PPG waveform is diminished in small ROI. Experimentally we found that for the most subjects the PTT remains the same within the statistical error while the ROI size changes from 5 × 5 to 13 × 13 pixels or from 1.5 × 1.5 to 3.5 × 3.5 mm2 in the facial area. Here we presented the data for the size of 7 × 7 pixels.
3.3 Spatial distribution of the pulse transit time
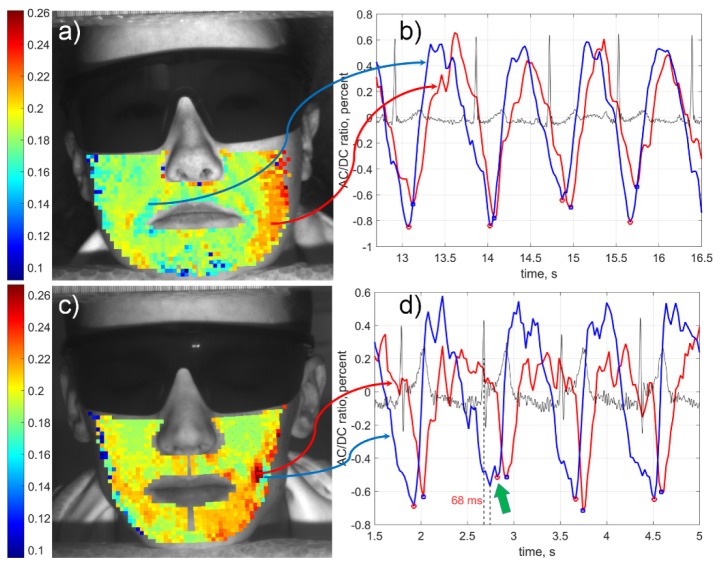
Higher accuracy of PTT estimation achieved in our algorithm allowed us not only reveal differences between subjects but also visualize spatial distribution of PTT over the face. Examples of the PTT maps calculated for two subjects from the studied cohort are shown in Fig. 6 where the transit time is coded in pseudocolor with the scale in seconds shown in the left side of each subfigure. One can see that spatial distribution of PTT in the facial area is heterogeneous for all subjects. Moreover, the pattern of PTT spatial distribution has an individual character. Typically, the PTT in the most distant ROIs from the heart (in the upper part of cheeks) is shorter than in the lower part of cheeks for all studied subjects. Notice a smooth change of the transit time magnitude between adjacent ROIs, which indirectly asserts validity of the calculated PTT maps. Graphs in Figs. 6(b) and 6(d) show fragments of PPG waveforms calculated in two ROIs with the faster (blue curve) and slower (red curve) PTT for subjects shown in Figs. 6(a) and 6(c), respectively.
Fig. 6.
PTT mapping in the facial area of two subjects (a, c) and fragments of PPG waveforms (b, d) calculated in the ROIs situated in the regions with faster (blue) and slower (red) transit time, respectively. Black curves in the graphs (b, d) are ECG simultaneously recorded with videos. The color scales on the left show PTT in seconds. Green arrow in the graph (d) points the position of the PPG minimum defined by our algorithm in the distorted cardiac cycle. The ratio of the reliable/selected ROIs was 1113/1160 and 899/900 for subjects shown in panels (a) and (c), respectively.
It is clearly seen that the blood does not pulsate synchronously in different points of the face. In contrast, there is significant difference in positions of both diastole and anacrotic part of the PPG waveform while those simultaneously measured in different points of cheeks or chin (Fig. 6(b) and 6(d)). Such increase of PTT shows the direction of the pulse wave propagation. In spite of specificity of pulse wave trajectory for each subject, the general tendency was down-inward increase of PTT. This behavior is understandable from the anatomic point of view: larger infraorbital and facial arteries supply the upper part of the face, whereas two smaller branches of the facial arteries supply the central lower part of the face [33]. The mean PTT value is specific for each subject. It varies from 140 to 210 ms.
4. Discussion
Unlike the most of previous works in photoplethysmography devoted to assessment of either pulse rate variability or pulse transit time by contact PPG sensors in the limbs [9–11,27,30], here we visualized the spatial distribution of the pulse transit time in the facial area. By using our advanced algorithm of the IPPG data processing, we precisely identified the beginning of anacrotic-wave, which helped us to achieved a high accuracy of PTT measurements. Thus, for the first time, noncontact mapping of the PTT in the face was demonstrated in this study. It opens up new opportunities for diagnostics of the number of novel pathophysiological parameters important for better understanding various diseases. While assessment of the pulse wave velocity in large blood vessels (traditionally measured either by tensometric or ultrasound Doppler techniques) is a predictor for negative prognosis of cardio-vascular diseases, the proposed technique can be used also to characterize the function of small blood vessels and endothelium. Abnormalities in microcirculation and endothelial dysfunction are often observed in patients with diabetes mellitus [34] and with metabolic syndrome [35]. Moreover, microcirculation abnormality is observed in patients with rheumatoid pathology [36]. Proximal scleroderma is important diagnostic criterion for systemic sclerosis, which is identified usually by capillaroscopy. However, distal position of the measuring zone in capillaroscopy provides only indirect information about proximal spreading of the process. The proposed method could characterize the function of the small blood vessels which is most important for early diagnosis of scleroderma. Therefore, our suggested approach provides new previously inaccessible possibilities for combined evaluation of central and peripheral blood circulation in various cardiovascular and endocrinal diseases.
In addition, our method could be applied to study peculiarities of functions of the microcirculatory bed and autonomous nervous system in migraine. Our previous studies suggested that migraine was associated with impaired vascular reactivity [37], and characterized by asynchronicity of blood pulsations in the face [18]. PTT estimation with the proposed technique could allow detection of further details of vasomotor reactivity associated with migraine, and even serve a new approach for evaluation efficiency of anti-migraine medicines.
Dicrotic notch is often attributed to the closure of the aortic valve [38]. However, analysis of the data obtained with contact PPG in fingers suggest reflections of the blood-pressure wave from small arteries in the trunk and lower limbs to be the notch origin [11,39]. It was shown that vasodilators significantly affect both the shape and position of the dicrotic notch detected in the fingers [39]. Unfortunately, no report of the dicrotic notch features in the facial area is available in the literature. Our research has revealed that the shape of the PPG signal in the facial area significantly varies not only between different ROIs but also from one cardiac cycle to another (see Figs. 4(b) and 6(b)). Very often, multiple notches are resolved within the cardiac cycle. We suggest that their appearance and stochastic enhancement arise from the interference of several pressure waves reflected from different places, including the head. Natural activity of both vascular and nervous systems might affect the position and amplitude of the notches even though the head motion is minimized.
Uneven distribution of PTT at the facial area and stochastic variations of the notches amplitude in the PPG waveform may lead to incorrect estimation of the heart rate and other cardiovascular parameters in currently popular IPPG systems, if the algorithm is based on averaging over large area of subject’s skin as it is frequently done in recent papers [13,15,16,19,20]. Our algorithm takes into account heterogeneous character of the PPG signals thus providing accurate physiological measurements of cardiovascular parameters in face of subjects. It is confirmed by significant correlation between PPG and ECG after disregarding the cycles affected by the enhanced notch. In addition, observed direction of the pulse wave propagation from the upper side of the cheeks to the lower (see Fig. 6) agrees with the anatomic location of the arteries [33].
5. Conclusion
Novel algorithm for accurate calculation of cardiovascular parameters from video recordings of subject's face was developed. We suggested that the main source of uncertainty in automatic determination of the cardiac-cycle borders is interference of multiple reflected waves of blood pressure, not motion artefacts. Scanning for cardiac cycles with PPG-signal minima distorted by dicrotic notch and subsequent withdrawing of such cycles from estimation of the mean PTT resulted in increase of the measurement accuracy. Proposed technology allows accurate estimation of the time required for the blood-pressure wave propagation from the heart to various points in the head. Moreover, capability of the technique to visualize trajectories of blood pulse propagation through the facial arteries is demonstrated. Accurate measurements of the pulse wave parameters increases capability to assess local microcirculation regulation, which depends on the physiological and pathological state.
Funding
The Russian Science Foundation financially supported the research (Grant 15-15-20012).
References and links
- 1.Khandoker A. H., Karmakar C. K., Palaniswami M., “Comparison of pulse rate variability with heart rate variability during obstructive sleep apnea,” Med. Eng. Phys. 33(2), 204–209 (2011). 10.1016/j.medengphy.2010.09.020 [DOI] [PubMed] [Google Scholar]
- 2.Rajendra Acharya U., Paul Joseph K., Kannathal N., Lim C. M., Suri J. S., “Heart rate variability: a review,” Med. Biol. Eng. Comput. 44(12), 1031–1051 (2006). 10.1007/s11517-006-0119-0 [DOI] [PubMed] [Google Scholar]
- 3.Chuang C.-C., Ye J.-J., Lin W.-C., Lee K.-T., Tai Y.-T., “Photoplethysmography variability as an alternative approach to obtain heart rate variability information in chronic pain patient,” J. Clin. Monit. Comput. 29(6), 801–806 (2015). 10.1007/s10877-015-9669-8 [DOI] [PubMed] [Google Scholar]
- 4.Woolam G. L., Schnur P. L., Vallbona C., Hoff H. E., “The pulse wave velocity as an early indicator of atherosclerosis in diabetic subjects,” Circulation 25(3), 533–539 (1962). 10.1161/01.CIR.25.3.533 [DOI] [PubMed] [Google Scholar]
- 5.Toto-Moukouo J. J., Achimastos A., Asmar R. G., Hugues C. J., Safar M. E., “Pulse wave velocity in patients with obesity and hypertension,” Am. Heart J. 112(1), 136–140 (1986). 10.1016/0002-8703(86)90691-5 [DOI] [PubMed] [Google Scholar]
- 6.Chiu Y. C., Arand P. W., Shroff S. G., Feldman T., Carroll J. D., “Determination of pulse wave velocities with computerized algorithms,” Am. Heart J. 121(5), 1460–1470 (1991). 10.1016/0002-8703(91)90153-9 [DOI] [PubMed] [Google Scholar]
- 7.Laogun A. A., Newman D. L., Gosling R. G., “Comparison of pulse wave velocity measured by Doppler shifted ultrasound and electromagnetic flowmetry,” Ultrasound Med. Biol. 3(4), 367–371 (1978). 10.1016/0301-5629(78)90078-9 [DOI] [PubMed] [Google Scholar]
- 8.Rabben S. I., Stergiopulos N., Hellevik L. R., Smiseth O. A., Slørdahl S., Urheim S., Angelsen B., “An ultrasound-based method for determining pulse wave velocity in superficial arteries,” J. Biomech. 37(10), 1615–1622 (2004). 10.1016/j.jbiomech.2003.12.031 [DOI] [PubMed] [Google Scholar]
- 9.Nitzan M., Khanokh B., Slovik Y., “The difference in pulse transit time to the toe and finger measured by photoplethysmography,” Physiol. Meas. 23(1), 85–93 (2002). 10.1088/0967-3334/23/1/308 [DOI] [PubMed] [Google Scholar]
- 10.Selvaraj N., Jaryal A., Santhosh J., Deepak K. K., Anand S., “Assessment of heart rate variability derived from finger-tip photoplethysmography as compared to electrocardiography,” J. Med. Eng. Technol. 32(6), 479–484 (2008). 10.1080/03091900701781317 [DOI] [PubMed] [Google Scholar]
- 11.Schäfer A., Vagedes J., “How accurate is pulse rate variability as an estimate of heart rate variability? A review on studies comparing photoplethysmographic technology with an electrocardiogram,” Int. J. Cardiol. 166(1), 15–29 (2013). 10.1016/j.ijcard.2012.03.119 [DOI] [PubMed] [Google Scholar]
- 12.Jago J. R., Murray A., “Repeatability of peripheral pulse measurements on ears, fingers and toes using photoelectric plethysmography,” Clin. Phys. Physiol. Meas. 9(4), 319–329 (1988). 10.1088/0143-0815/9/4/003 [DOI] [PubMed] [Google Scholar]
- 13.Sun Y., Hu S., Azorin-Peris V., Kalawsky R., Greenwald S., “Noncontact imaging photoplethysmography to effectively access pulse rate variability,” J. Biomed. Opt. 18(6), 061205 (2012). 10.1117/1.JBO.18.6.061205 [DOI] [PubMed] [Google Scholar]
- 14.Kamshilin A. A., Teplov V., Nippolainen E., Miridonov S., Giniatullin R., “Variability of microcirculation detected by blood pulsation imaging,” PLoS One 8(2), e57117 (2013). 10.1371/journal.pone.0057117 [DOI] [PMC free article] [PubMed] [Google Scholar]
- 15.Tarassenko L., Villarroel M., Guazzi A., Jorge J., Clifton D. A., Pugh C., “Non-contact video-based vital sign monitoring using ambient light and auto-regressive models,” Physiol. Meas. 35(5), 807–831 (2014). 10.1088/0967-3334/35/5/807 [DOI] [PubMed] [Google Scholar]
- 16.Shao D., Yang Y., Liu C., Tsow F., Yu H., Tao N., “Noncontact monitoring breathing pattern, exhalation flow rate and pulse transit time,” IEEE Trans. Biomed. Eng. 61(11), 2760–2767 (2014). 10.1109/TBME.2014.2327024 [DOI] [PubMed] [Google Scholar]
- 17.Holton B. D., Mannapperuma K., Lesniewski P. J., Thomas J. C., “Signal recovery in imaging photoplethysmography,” Physiol. Meas. 34(11), 1499–1511 (2013). 10.1088/0967-3334/34/11/1499 [DOI] [PubMed] [Google Scholar]
- 18.Zaproudina N., Teplov V., Nippolainen E., Lipponen J. A., Kamshilin A. A., Närhi M., Karjalainen P. A., Giniatullin R., “Asynchronicity of facial blood perfusion in migraine,” PLoS One 8(12), e80189 (2013). 10.1371/journal.pone.0080189 [DOI] [PMC free article] [PubMed] [Google Scholar]
- 19.Yu Y.-P., Raveendran P., Lim C.-L., “Dynamic heart rate measurements from video sequences,” Biomed. Opt. Express 6(7), 2466–2480 (2015). 10.1364/BOE.6.002466 [DOI] [PMC free article] [PubMed] [Google Scholar]
- 20.Moreno J., Ramos-Castro J., Movellan J., Parrado E., Rodas G., Capdevila L., “Facial video-based photoplethysmography to detect HRV at rest,” Int. J. Sports Med. 36(6), 474–480 (2015). 10.1055/s-0034-1398530 [DOI] [PubMed] [Google Scholar]
- 21.Kamshilin A. A., Nippolainen E., Sidorov I. S., Vasilev P. V., Erofeev N. P., Podolian N. P., Romashko R. V., “A new look at the essence of the imaging photoplethysmography,” Sci. Rep. 5(5), 10494 (2015). 10.1038/srep10494 [DOI] [PMC free article] [PubMed] [Google Scholar]
- 22.Poh M.-Z., McDuff D. J., Picard R. W., “Advancements in noncontact, multiparameter physiological measurements using a webcam,” IEEE Trans. Biomed. Eng. 58(1), 7–11 (2011). 10.1109/TBME.2010.2086456 [DOI] [PubMed] [Google Scholar]
- 23.Yu Y.-P., Raveendran P., Lim C.-L., Kwan B.-H., “Dynamic heart rate estimation using principal component analysis,” Biomed. Opt. Express 6(11), 4610–4618 (2015). 10.1364/BOE.6.004610 [DOI] [PMC free article] [PubMed] [Google Scholar]
- 24.Bal U., “Non-contact estimation of heart rate and oxygen saturation using ambient light,” Biomed. Opt. Express 6(1), 86–97 (2015). 10.1364/BOE.6.000086 [DOI] [PMC free article] [PubMed] [Google Scholar]
- 25.Kumar M., Veeraraghavan A., Sabharwal A., “DistancePPG: Robust non-contact vital signs monitoring using a camera,” Biomed. Opt. Express 6(5), 1565–1588 (2015). 10.1364/BOE.6.001565 [DOI] [PMC free article] [PubMed] [Google Scholar]
- 26.Sidorov I. S., Volynsky M. A., Kamshilin A. A., “Influence of polarization filtration on the information readout from pulsating blood vessels,” Biomed. Opt. Express 7(7), 2469–2474 (2016). 10.1364/BOE.7.002469 [DOI] [PMC free article] [PubMed] [Google Scholar]
- 27.Allen J., “Photoplethysmography and its application in clinical physiological measurement,” Physiol. Meas. 28(3), R1–R39 (2007). 10.1088/0967-3334/28/3/R01 [DOI] [PubMed] [Google Scholar]
- 28.Sahni R., “Noninvasive monitoring by photoplethysmography,” Clin. Perinatol. 39(3), 573–583 (2012). 10.1016/j.clp.2012.06.012 [DOI] [PubMed] [Google Scholar]
- 29.Ruha A., Sallinen S., Nissilä S., “A real-time microprocessor QRS detector system with a 1-ms timing accuracy for the measurement of ambulatory HRV,” IEEE Trans. Biomed. Eng. 44(3), 159–167 (1997). 10.1109/10.554762 [DOI] [PubMed] [Google Scholar]
- 30.Posada-Quintero H. F., Delisle-Rodríguez D., Cuadra-Sanz M. B., Fernández de la Vara-Prieto R. R., “Evaluation of pulse rate variability obtained by the pulse onsets of the photoplethysmographic signal,” Physiol. Meas. 34(2), 179–187 (2013). 10.1088/0967-3334/34/2/179 [DOI] [PubMed] [Google Scholar]
- 31.Hemon M. C., Phillips J. P., “Comparison of foot finding methods for deriving instantaneous pulse rates from photoplethysmographic signals,” J. Clin. Monit. Comput. 30(2), 157–168 (2016). 10.1007/s10877-015-9695-6 [DOI] [PubMed] [Google Scholar]
- 32.Mehta D., Camm A. J., “Signal-averaged electrocardiography and the significance of late potentials in patients with “idiopathic” ventricular tachycardia: a review,” Clin. Cardiol. 12(6), 307–312 (1989). 10.1002/clc.4960120605 [DOI] [PubMed] [Google Scholar]
- 33.Saladin K., Anatomy & physiology: The unity of form and function, (McGraw-Hill Education, New York, 2015). [Google Scholar]
- 34.Tiftikcioglu B. I., Bilgin S., Duksal T., Kose S., Zorlu Y., “Autonomic neuropathy and endothelial dysfunction in patients with impaired glucose tolerance or type 2 diabetes mellitus,” Medicine (Baltimore) 95(14), e3340 (2016). 10.1097/MD.0000000000003340 [DOI] [PMC free article] [PubMed] [Google Scholar]
- 35.Kupaev V., Borisov O., Marutina E., Yan Y.-X., Wang W., “Integration of suboptimal health status and endothelial dysfunction as a new aspect for risk evaluation of cardiovascular disease,” EPMA J. 7(1), 19 (2016). 10.1186/s13167-016-0068-0 [DOI] [PMC free article] [PubMed] [Google Scholar]
- 36.Silva I., Loureiro T., Teixeira A., Almeida I., Mansilha A., Vasconcelos C., Almeida R., “Digital ulcers in systemic sclerosis: role of flow-mediated dilatation and capillaroscopy as risk assessment tools,” Eur. J. Dermatol. 25(5), 444–451 (2015). [DOI] [PubMed] [Google Scholar]
- 37.Mamontov O. V., Babayan L., Amelin A. V., Giniatullin R., Kamshilin A. A., “Autonomous control of cardiovascular reactivity in patients with episodic and chronic forms of migraine,” J. Headache Pain 17(1), 52 (2016). 10.1186/s10194-016-0645-6 [DOI] [PMC free article] [PubMed] [Google Scholar]
- 38.Hoeksel S. A. A. P., Jansen J. R. C., Blom J. A., Schreuder J. J., “Detection of dicrotic notch in arterial pressure signals,” J. Clin. Monit. 13(5), 309–316 (1997). 10.1023/A:1007414906294 [DOI] [PubMed] [Google Scholar]
- 39.Chowienczyk P. J., Kelly R. P., MacCallum H., Millasseau S. C., Andersson T. L. G., Gosling R. G., Ritter J. M., Anggård E. E., “Photoplethysmographic assessment of pulse wave reflection: blunted response to endothelium-dependent beta2-adrenergic vasodilation in type II diabetes mellitus,” J. Am. Coll. Cardiol. 34(7), 2007–2014 (1999). 10.1016/S0735-1097(99)00441-6 [DOI] [PubMed] [Google Scholar]


