Abstract
The purpose of this study was to assess the effect of pulsed amplitude modulated ultrasound (pAMUS) on the level of mineralization in osteoblast cell in comparison to cells stimulated with low-intensity pulsed ultrasound (LIPUS). To make the ultrasound effects more enhanced and targeted at region of interest, this study uses a novel approach of applying pulsed amplitude modulated ultrasound to osteoblast cells. The pAMUS signal was generated using two signal generators. Pulsed signal was amplified through a power amplifier and drove two identical focused ultrasound probes, focusing at the same point in the culture dish. The effects of pAMUS were evaluated using a pAMUS signal of 45 kHz and 100 kHz with 20% duty cycle. The hydrophone verified the formation of a focal point at equal distances (16 mm) from the surface of both transducers. Intensity profile using computer controlled 2D scanner showed circular focal point with a diameter of approximately 10 mm. The effect of the signal was studied using MC3T3-E1 cells cultured in osteogenic medium at time points Day 7, 12 and 18. The cells were analyzed for ALP activity and calcium mineralization. The pAMUS significantly increased the ALP activity and matrix calcification in comparison with LIPUS stimulated cultures.
Keywords: Low intensity pulsed ultrasound, Amplitude modulated ultrasound, Bone adaptation, Osteoporosis, Acoustic streaming, Osteoblast, Mechanotransduction, Mineralization
Introduction
Pulsed ultrasound stimulation is highly effective in accelerating bone healing in fresh fractures and non-unions.8,9,15,16,26 Clinical studies also show faster healing rate with ultrasound stimulation.6,10,11,14,20 In vivo studies show increased mechanical strength in bone tissues after ultrasound application in different stages of bone healing.1 Cellular level effects of ultrasound have been studied using osteoblast cells. In these studies, pulsed ultrasound stimulation has increased matrix calcification, alkaline phosphatase (ALP) activity and transcription of different transcription factors. 13,23,25,27
Ultrasound has been shown to enhance bone growth but the ultrasound parameters responsible for osteogenesis are still not known. To optimize the effect of ultrasound on bone growth, it is important to optimize the ultrasound signal. The ultrasound stimulators used in clinical applications are designed for bone tissue, usually embedded in muscle and other soft tissues; thus it can caused adverse effects on surrounding soft tissue. Ultrasound pressure wave can induce cavitations in soft tissue surrounding the bone as they have higher concentration of microbubbles compare to bone tissue. Feril et al.7 have discussed that formation of cavitations in cellular membrane can lead to cell death if cell is unable to repair disorientations in the cellular membrane. These cavitations depending on the ultrasound energy can also affect other organelles inside the cell. The prolonged ultrasound treatment can induce formation of free radicals inside the cells, which can reduce cellular response and induce cell necrosis.7 Furthermore, the surrounding tissues cause the loss of ultrasound energy; this can reduce the efficiency of treatment.
Dynamic mechanical stimulation studies in vivo low level vibrations have shown significant increase in bone mass by inducing microstrains in bone tissue.17,19 It is expected that low level ultrasound with amplitude modulation will generate similar matrix mineralization in vitro experiments.
Pulsed ultrasound signal creates a pressure wave, when it comes in contact with medium, it generates unidirectional displacement known as acoustic streaming. Acoustic streaming induces shear stress and strain on the cells and initiates mechanotransduction pathway. The mechanism of ultrasound effects on cell proliferation and differentiation hasn't been fully understood yet. Thus different studies have applied different ultrasound parameters such as intensities,2,21,22 frequency2 to optimize mineralization to enhance bone mechanical properties.
This study evaluates the mineralization in osteoblast cells, when stimulated with focused pulsed amplitude modulated ultrasound sound (pAMUS) and compared with low intensity pulsed ultrasound (LIPUS) at intensity of 5 mW/cm2 (Fig. 1). PAMUS is expected to provide enhanced mechanical stimulation to the cells as it compromised of amplitude modulated signal in which signal amplitude varies with respect to modulated signal. PAMUS is different from LIPUS in the signal amplitude modulation as LIPUS signal has no modulation. It is expected modulation property of pAMUS will increase dynamic mechanical loading of signal thus increase bone mineralization significantly when compared to non-modulated LIPUS signal. Furthermore due to low intensity and energy level pAMUS wouldn't induce cavitations in soft tissue surrounding bone. It is expected that amplitude modulation will mediate the ultrasound signals in a more dynamic way with lower frequencies (e.g. 45 kHz and 100 kHz) in the stimulated region, which may further trigger local mechanical perturbation and enhance mineralization in osteoblast cells with optimized acoustic energy in the focal point, through a novel low energy pulsed amplitude modulated ultrasound (pAMUS) configuration, which comprise of modulated and carrier frequency. The objective of this study is to optimize the ultrasound signal that can be used for bone healing and mineralization. It is hypothesized that pAMUS signal will enhance mineralization in osteoblast cells at accelerated rate than the regular LIPUS. To evaluate this hypothesis, we designed a novel set up with two low energy focal transducers focusing at a focal region. The effect of pAMUS stimulations was determined by analyzing ALP activity and matrix calcification and comparing it with pulsed ultrasound stimulations and no ultrasound stimulations.
Figure 1.
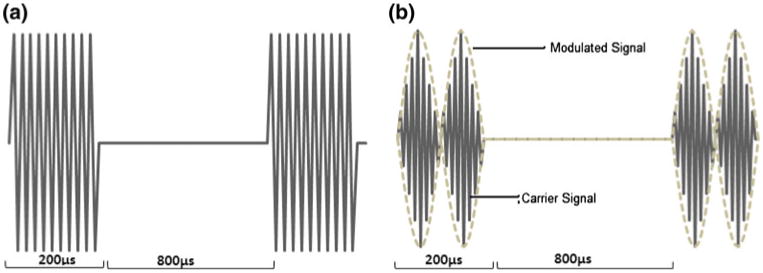
Ultrasound signals used in this study (normalized scale). (a): Non-modulated pulsed Ultrasound signal, 20% duty cycle, 5 mW/cm2, 1 MHz. (b): Pulsed Amplitude Modulated Ultrasound signal, 20% duty cycle, 5 mW/cm2. The carrying frequency (fc) is approximately 1 MHz. The modulated frequencies (fm) are 45 kHz and 100 kHz.
Materials and Methods
Signal Modulation
Considering the effects of ultrasound at muscle and skin tissue along with energy loss to soft tissue surrounding the bone, this study analyzes the application of focused and low energy pAMUS in osteoblast cells. To get maximum signal strength at focal point, two focused ultrasound signals with different frequencies are focused at the same focal region. When two signals of different frequencies are combined at focal point, they form modulated ultrasound signal. Amplitude modulated signal consist of a “carrier signal” and a “modulate signal,” the modulating signal changes the amplitude of the carrier signal (Fig. 1).
The setup in this study combines two ultrasound frequencies at focal point. Both signals are sinusoidal waves given by:
| (1) |
| (2) |
At focal point these two signals combine to give:
| (3) |
Using sum to product identities:
| (4) |
| (5) |
| (6) |
This equation is comparable to amplitude modulated signal which is given by:
| (7) |
For simplification ϕc and ϕm can be considered equal to zero as they describe initial phase of modulated and carrier frequencies.
| (8) |
| (9) |
| (10) |
where f1 is the ultrasound frequency 1, f2 is the ultrasound frequency 2, Fm is the modulation frequency, Fc is the carrier frequency, Φc is the carrier signal phase, Φm is the modulated signal phase.
Both ultrasound signals would be focused at the same focal point thus providing the maximum energy to the cells in the focal region.
Ultrasound Setup
To achieve the pAMUS signal, two focused transducer were focused at the focal point. To generate the ultrasound signal, function generator (Model DS345 30 MHz Function/Arbitrary Waveform Generator, Stanford Research Systems, Inc., Sunnyvale, CA) was used to trigger the two secondary function generators, Function Generator 1 & 2(AFG3021 Single Channel Arbitrary/Function Generator, Tektronix, Inc., Tequipment.net, Long Branch, NJ, USA). The secondary function generator generates a pulsed ultrasound signal with 20% duty cycle (200 μs/800 μs). To generate pAMUS, the generators were set at different frequencies. Pulsed signals are then processed through a power amplifier (Model 2350 Dual Channel High Voltage Precision Power Amplifier, TEGAM, Inc., Geneva, OH, USA). Two focused transducers (Panametrics NDT, V303, 13 mm diameter, 16 mm focal point and 1 MHz Olympus Corporation), were driven by amplified signals. Figure 2 illustrates the experimental setup with detailed specifications and formation of amplitude modulated signal at focal point.
Figure 2.
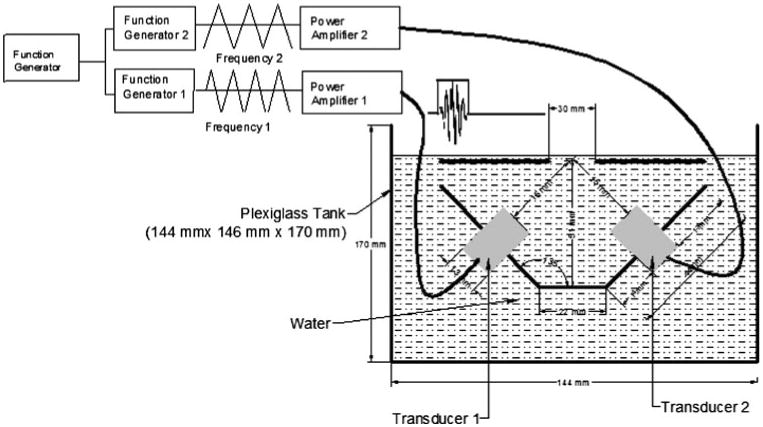
Ultrasound setup to generate focused pulsed amplitude modulated ultrasound (pAMUS). Primary function generator trigger primary signal which get fed into two secondary function generators. Two secondary generators generate two different ultrasound frequencies which get amplified by power amplifiers. Two focused transducers convert the signal to form acoustic wave, both focused at same point. The lab-tek Chamber well was placed at the stage with hole in it which enable acoustic wave to stimulate cells.
An aluminum holder was designed with a horizontal base and two arms at 135° to the base. The transducer was held perpendicular to each arm to get both transducers to focus at same point and generate amplitude modulated signal. A plastic plate was design with a hole of 30 × 30 mm at the focal point of transducers. This plastic surface acted as a stage for the Lab-tek chamber slide (Nunc, Thermo Fisher Scientific, Rochester) and the hole provides the point of access for ultrasound to stimulate the cells. The set up was contained in a Plexi glass tank. The tank also held degassed water to fill the void between transducers and Lab-Tek Chambers (Fig. 2). To verify the formation of amplitude modulated acoustic wave and to confirm the focal position, high performance hydrophone (HP Series High Performance Hydrophone Measurement System, Precision Acoustics, Ltd. Dorchester, UK) was used. The hydrophone was attached to a computer controlled scanner which enabled the hydrophone to sweep through the surface in X and Y direction with resolution of 5 mm. To verify the frequency, both transducer were set to produce ultrasound at 1 MHz, which gives 0 MHz modulated frequency and 1 MHz carrier frequency. This frequency was chosen to test the system considering equations of carrier frequency (11) and modulated frequency (12):
| (11) |
| (12) |
The wave signal was verified using oscilloscope (TDS 430A 400 MHz Two Channel Digital Real-Time Oscilloscope, Tektronix, Inc. Tequipment.net, Long Branch, NJ, USA) attached to the hydrophone. To confirm the formation of modulated ultrasound waves, system was tested using different frequencies. The intensity of signal was measured using the results from hydrophone 2D scan data with resolution of 5 mm. The wave pattern for pAMUS signal was detected using low frequency hydrophone (TC4013 Miniature Reference Hydrophone, 1 Hz–170 kHz, Reson Inc) in the focal region. This data was plotted relative to XY axis using Matlab v7.1, the area under the graph represents the average intensity over the area of focal point which is approximately 5 mW/cm2. In this study two amplitude modulated frequencies were studied, 45 kHz and 100 kHz. These values were selected after conducting the literature search. Recent studies show that low frequency ultrasound, ranging from 20 to 140 kHz, can enhance enzymatic activity3–5,29,30 in different cells. The activation frequency can be different for different enzymes.18 The literature search didn't retrieve any particular low frequency for enzymes involved in bone mineralization.
Considering the modulation frequency Eq. (2), transducer 1 was set to 1 MHz and transducer 2 was set at 1.09 MHz to generate 45 kHz signal and for 100 kHz signal, transducer 1 was set at 1 MHz and transducer 2 was set at 1.20 MHz. As explained in previous section modulated frequency forms an envelope around carrier frequency thus cells can sense modulated frequency. To confirm the formation of desired frequencies focus region was scanned to confirm the wave pattern using hydrophone. Cells from whole well (well surface area = 1.8 cm2, 1 × 0.8 cm) were used to analyses changes in ALP activity and matrix mineralization.
Cell Culture
Murine Calvaria derived MC3T3-E1,28 a preosteoblast cell line (ATCC, LGC Promochem, France) was cultured in alpha-Modified Essential Medium (α-MEM, Hyclone) supplemented with 10% Fetal Bovine Serum (FBS) and 100 μL/mL Pen-strep in an incubator, set at 5% CO2 and 37 °C. Cells were seeded at 10,000 cell per well (well surface area = 1.8 cm2, 1 × 0.8 cm). Cells were allowed to reach a confluent state and the experiment was started on Day 8 of post confluency. This allows cells to make their extracellular matrix and increase their adherence to the plate and reduce cell detachment during ultrasound treatment. To induce mineralization, 10 mM glycerophosphate and 50 μg/mL of ascorbic acid was added to cell culture medium at 7th day of post confluency. During the experiment, medium was changed on every 3rd day till Day 10 and every day after 10th day. Medium was changed in all samples at same time.
Cells were distributed into four groups: Sham, cells were exposed to no ultrasound; control, was exposed to pulsed ultrasound sound at 1 MHz with no amplitude modulation; two experimental groups with 100 kHz and 45 kHz pAMUS frequencies, respectively. Control and experimental groups were exposed to ultrasound for 15 min each day. In order to place the cells at focal point; each well was placed on stage which had a hole of 30 mm × 30 mm. The gap between transducers and Lab-tek chambers was filled with degassed water. The whole set up was place inside an incubator to provide the optimal conditions for cells to grow and proliferate. Each well was filled with 0.75 mL of medium. The volume of medium was chosen considering the formation of resultant standing wave.
Alkaline Phosphatase Assay
Alkaline phosphatase (ALP) is a membrane bound enzyme which provides phosphate for formation of calcium phosphate (hydroxyapatite). ALP turnover has been used as a marker for bone mineralization.
Cell samples were collected at Day 7, 12 and 18 (n = 5 samples per group per day point) and sonicated for 5 min to induce cell lysis in 1 mL distilled water. 500 μL solution was extracted and was used for ALP activity assay. Remaining cell extract was stored for calcium assay.
P-Nitrophenyl Phosphate Liquid Substrate System (sigma)(100 μL) was added to the extracted samples from each group at D7, 12 and 18(100 μL) to each well of 96 well plate. Samples were then incubated for 60 min at 37 °C in incubator, reaction was stopped using 100 μL of 0.1 N NaOH. Absorbance was read at 405 nm, all the samples were analyzed three times. The amount of ALP activity was determined using nitrophenol dilutions as standard. The results were normalized with total number of cells in each sample.
Alizarin Red Staining
At Day 7, 12 and 18 (n = 3 for each time point) matrix calcification was analyzed using alizarin red staining. Samples were fixed using 70% ethanol for 1 h at room temperature and stained in 40 mM alizarin red at pH 4.2 for 10 min. Cultures were washed thoroughly with tapped water, allowed to dry at room temperature for an hour for imaging. Images were obtained using Axiovert 2000 M Inverted microscope (Carl Zeiss, USA) at 2.5× and 10× magnifications. To quantify the degree of staining in each sample cultures were destained with 10% cetylpyridinium chloride solution in 10 mM sodium phosphate for 15 min at room temperature. Aliquots of each sample were transferred in triplicate to 96 well-plate (Falcon™, NJ) and absorbance was measured at 562 nm. To calculate the relative density of stain in each sample optical density was compared to a known concentration of alizarin red diluted with 10 mM sodium phosphate containing 10% cetylpyridinium.12,24
Calcium Assay
Considering the semi-objective nature of Alizarin red de-staining, calcification results were verified using Calcium reagent (Diagnostic Chemicals/Genzyme-Product 1420 Arsenazo III). 1 N acetic acid was added to reminder of the samples (n = 5, for each sample at every time point) and were left overnight with gentle agitation. Amount of calcium was quantified by analyzing triplicates of equal amounts of samples and Arsenazo in 96 well plate. Different dilutions of calcium in distilled water were used as standard and measured at 650 nm to relative calcium concentration in the matrix.
Statistical Analysis
All the data was presented in ± standard deviation (SD). Results were analyzed using one-way analysis of variance (ANOVA) and Student t-test. Neumann Kouls post-hoc test was used to verify trends in ANOVA analyses. Statistical significance was set at p < 0.05.
Results
Field Verification and Formation of pAMUS
Ultrasound energy was focused at circular focal region with a diameter of 10 mm, measured by 2-D hydrophone scan. Figure 3 shows the image of 2-D intensity scan with ultrasound energy confined at circular focal area with 10 mm in diameter (78.54 mm2). Figure 3a shows acoustic energy profile at focal point relative to grayscale values. Lab-Tek chamber well has 180 mm2 culturing area and 44% of cells were stimulated in each well (Fig. 3b).
Figure 3.
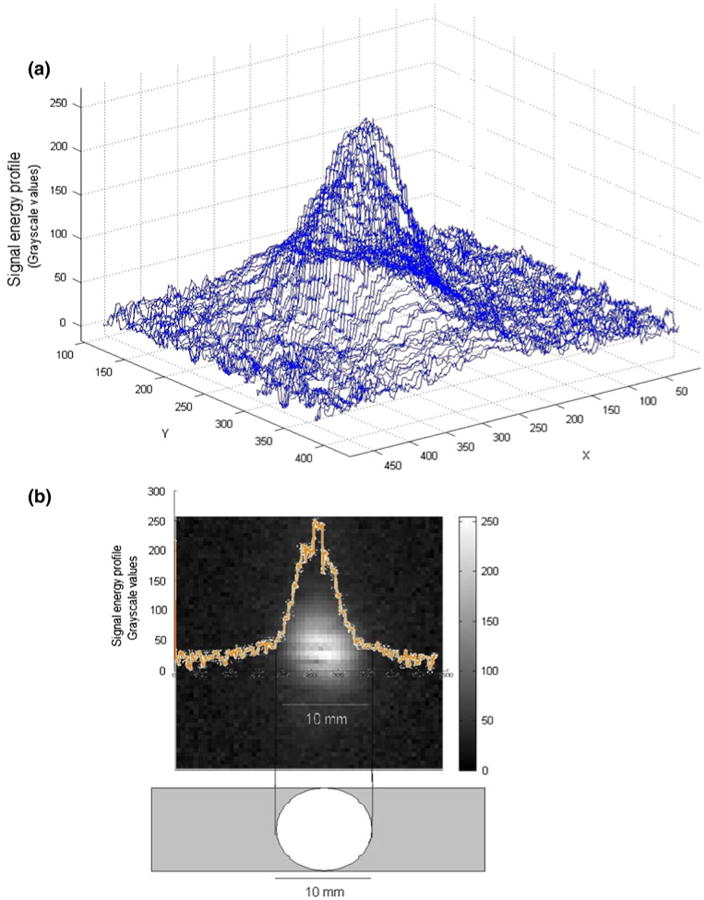
Energy profile at acoustic focal point (a) Energy profile at focal point showing energy values relative to grayscale; (b) focal point (10 mm, 78.54 mm2) positioning in lab-Tek well (180.0 mm2) and acoustic energy distribution at focal region.
The wave form was captured by a digitized Oscilloscope attached to the hydrophone. To observe the formation of amplitude modulated waves, two different sets of frequencies were used. In the first set we tested 1 and 1.1 MHz frequencies (Δf: 0.1 MHz, fc: 1.05 MHz), the resultant modulated frequency of 0.047 kHz was observed which lies in close approximation to theoretical value of 0.05 kHz. In the second set frequencies of 1 and 1.045 MHz (Δf: 0.045 MHz, fc: 1.0225 MHz) were tested, 0.0229 kHz modulated frequency was observed in comparison to 0.0225 kHz. Figures 4a and 4b show the wave pattern for first and second set of frequencies respectively. Further Fig. 4 implies the formation of amplitude modulated frequency with carrier and modulated components.
Figure 4.
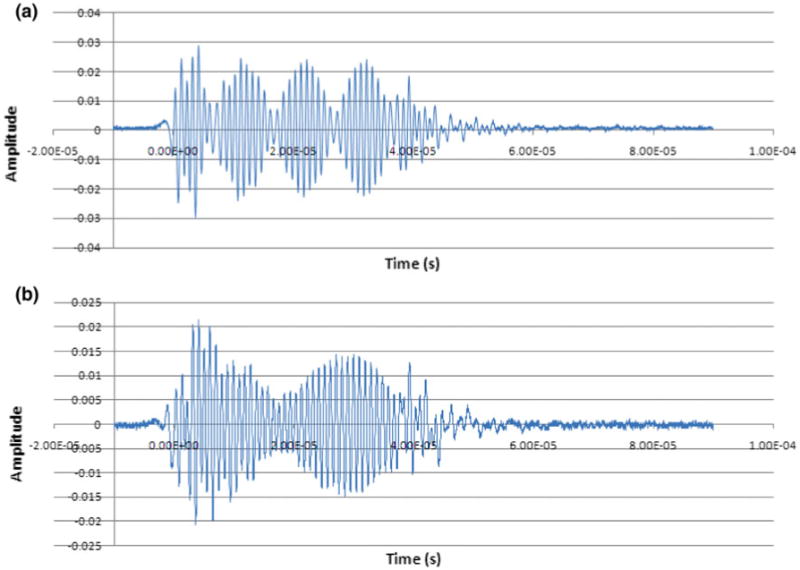
The acoustic waveform for amplitude modulated ultrasound measured at the focal zone. Graphical representation of beat waveforms detected at the focal point. In both graphs ‘a’ and ‘b’, the experimental modulation frequency (fe) was approximately same as the theoretical modulation frequency (fm). (a) Frequency 1 (f1) = 1.10 MHz, frequency 2 (f2) = 1.1 MHz, Δf = 100.0 kHz, fe = 50.0 kHz, fm = 47 kHz; (b) f1 = 1.1 MHz, f2 = 1.045 MHz, Δf = 45.0 kHz, fe = 22.5 kHz and fm = 22.9 kHz.
Alkaline Phosphatase Activity
ALP activity was measured at Day 7, 12 and 18. All the cultures showed increase in ALP activity but it is significantly higher in ultrasound stimulated cultures. The pAMUS stimulated cultures show significantly higher ALP activity at Day 12 (4 and 5 fold increase in 45 kHz and 100 kHz pAMUS relative to LIPUS controls). The pulsed ultrasound stimulated showed increase in ALP activity at Day 18 but remains lower than pAMUS stimulated cultures. Figure 5 shows the difference in ALP activity in different groups.
Figure 5.
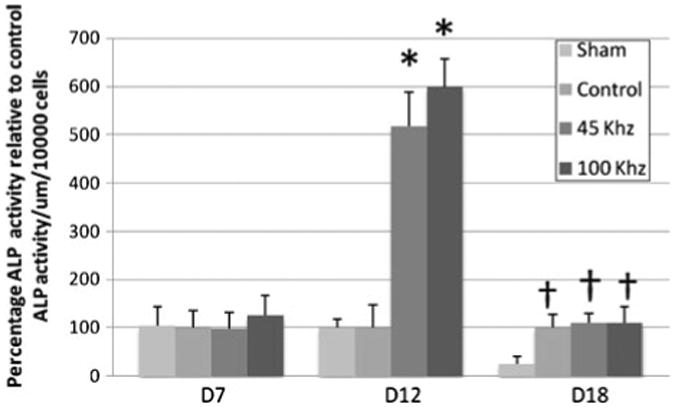
Alkaline phosphatase enzymatic activity in pAMUS, LIPUS and no ultrasound cultures. Alkaline phosphatase activity of cultures of MC3T3-E1 at day 7,12 and 18, ultrasound treatments were given for 15 min per day. Alkaline phosphatase results were normalized to number of cells. Cultures were distributed in four groups, cultures with no ultrasound treatment (sham), pulsed ultrasound stimulation (control), 45 kHz and 100 kHz pulsed amplitude modulated ultrasound (pAMUS) stimulated group. Each data point is representative of the mean of five independent experiments per time point ± standard deviation. 45 kHz and 100 kHz pAMUS stimulated cultures show significant increase of 4 and 5 fold (*p < 0.001, n = 5) in comparison to pUS stimulated cultures and non-treated cultures at Day 12. At day 18 there is no significant difference between pAMUS and LIPUS stimulated cultures, ultrasound treated cultures show significant increase relative to non-treated cultures (†p < 0.01, n = 5). Statistical significance was calculated by student t-test and one-way ANOVA.
Mineralization
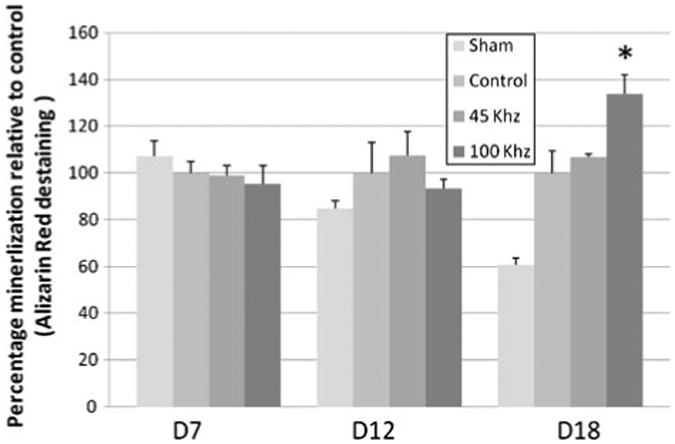
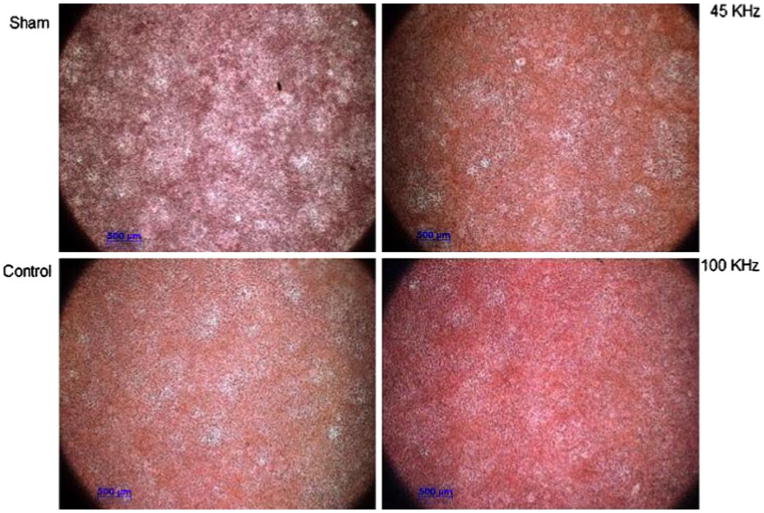
Mineralization was assessed using alizarin red staining within cultures at Day 7, 12 and 18 with 45 kHz and 100 kHz pAMUS, pulsed ultrasound and no ultrasound. The pAMUS stimulated cultures showed higher level of mineralization relative to pulsed-US stimulated cultures at Day 18, least mineralization was observed in no ultrasound cultures. Figure 6 shows images from Day 18 at 2.5× magnification. Cultures were destained and optical density was measured at 562 nm. 100 kHz pAMUS samples had significantly increased mineralization compared to cultures stimulated with pulsed-US or no ultrasound. 100 kHz pAMUS samples show 33.74 ± 8.37% higher calcium levels relative to controls (cultures stimulated with pulsed ultrasound) (Fig. 7).
Figure 6.
Alizarin red staining at day 18 in non-stimulated, LIPUS stimulated and 45 kHz and 100 kHz pAMUS stimulated MC3T3-E1 cultures. Higher level of staining was observed in 45 kHz and 100 kHz pAMUS stimulated samples most dense in 100 kHz cultures which show denser alizarin red patches. Pulsed ultrasound stimulated cultures show alizarin red stain but comparatively less dense than pAMUS stimulated cultures. Non-treated cultures show least amount of stain which visible white (no-stain) patches.
Figure 7.
Alizarin red de-staining results using 10% cetylpyridinium in sodium phosphate relative to pulsed ultrasound treated cultures. Alizarin red MC3T3-E1 cultures were destained and quantified at OD562nm. Significant increase (33.74 ± 8.37%) in matrix calcification was observed at day 18 in 100 kHz pAMUS stimulated samples relative to LIPUS treated samples. 45 kHz samples didn't show significant increase (*p < 0.005, n = 3). Statistical significance was calculated using student t-test and one-way ANOVA; error bars represent ± standard deviation.
Alizarin red staining results were verified using calcium regent assay and analyzed at 650 nm. Figure 8 confirms the results from alizarin red staining, significant increase in matrix calcification was determined in 100 kHz pAMUS cultures relative to 45 kHz pAMUS, pulsed-US and no ultrasound cultures. Calcium assay determines 27.75 ± 10.13% more calcium in 100 kHz samples relative to pulsed-US stimulated samples.
Figure 8.
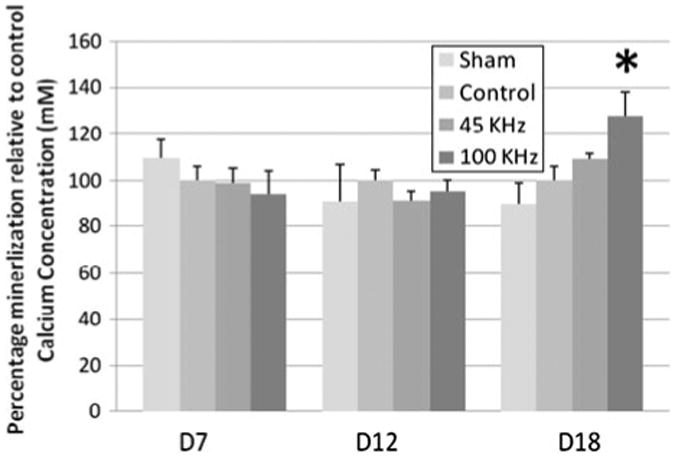
Callcium Mineralization assessment at day 7, 12 and 18 in MC3T3-E1 cultures using calcium regeant assay relative to LIPUS cultures. Alizarin red staining results were confirmed using calcium reagent assay at OD650nm. pAMUS and LIPUS samples were stimulated for 15 min everday. Statisitically significant increase(27.75 ± 10.13%, *p < 0.05, n = 5) in 100 kHz pAMUS stimulated cultures at day 18 relative to pUS stimulated cultures. No significant change was observed between 45 kHz pAMUS and LIPUS stimulated cultures. Significance was calcuated by Student t-test and one-way ANOVA, error bars represent ± standard deviation.
Discussion
The data has indicated that modulated ultrasound is capable to increase biomineralization in osteoblast-like cells. This study confirmed previous findings that low energy ultrasound is capable of accelerating bone cell response. However, the data from pAMUS demonstrated stronger mineralization expression than non-modulated LIPUS, which suggests that modulated ultrasound provided enhanced stimulation due to its acoustic properties. This study compared amplitude modulated signal to non-modulated pulsed ultrasound signal at low intensity (5 mW/cm2). Considering pAMUS increased mineralization significantly relative to LIPUS, this potentially implies that pAMUS can further enhance bone mineralization if used at same intensity levels as of LIPUS in vitro, in vivo and even at the clinical application. LIPUS treatment use a non-focal ultrasound, which is susceptible to energy lose to pre and post bone tissue along with undesirable effects to soft tissue surrounding bone. This setup can potentially overcome this issue by using two low energy signals to produce a higher energy signal at site of interest thus reducing the energy lose and undesirable effects to surrounding soft tissue.
The high levels of biomineralization with pAMUS signal suggest that signal amplitude modulation may play an important role in mechanotransduction in osteoblast. More studies need to be conducted to know the exact mechanism through which enhanced mineralization is achieved but it can be speculated that underlying mechanism of mechanotransduction are same as of LIPUS but pAMUS increases the mechanotransduction due to amplitude variability. The pAMUS has shown enhanced mineralization thus has potential to be used in accelerating bone healing, non-unions, osteoporosis, osteopenia and post-menopausal bone loss.
The results from ALP activity showed significant increase in 100 kHz and 45 kHz pAMUS stimulated cultures relative to pulsed-US stimulated and no ultrasound cultures at Day 12. At Day 18 ALP activity also get elevated in pulsed-US cultures but remains significantly less then 100 kHz pAMUS samples. The increase in pulsed-US was expected as different studies have shown increase in ALP activity in osteoblast when stimulated with pulsed-US.25,27 Sham cultures show a gradual increasing but significantly low ALP activity than ultrasound stimulated cultures.
Mineralization results had significantly higher mineralization in 100 kHz pAMUS stimulated cultures (27–33%) but increase in 45 kHz pAMUS cultures was moderate (6–9%) compare to pulsed ultrasound stimulated cultures. 45 kHz pAMUS stimulated cultures had significantly higher ALP activity than pulsed ultrasound but didn't show any significant increase in calcification. The process of mineralization involves many enzymes and it is possible that 45 kHz pAMUS can activate alkaline phosphatase enzyme but didn't activate other important enzymes needed for calcification of matrix as different frequencies can activate different enzymes,18 thus the overall mineralization didn't increased significantly. In alizarin red assay it was expected to see higher calcified area in focal region and relatively lesser calcification in non-stimulated area but alizarin red stain was distributed all over the sample. This can be due to the process of cellular induction and formation of acoustic streaming, which can spread over the total area of well and induce mechanotransduction in non-stimulated cells.
This study only looked at ALP activity and matrix calcification as markers for pAMUS effects on osteoblast cells, and more analysis would be required to determine the effects of pAMUS on transcription and gene levels. It would also be beneficial to analyze the spatial distribution of the calcium mineralization in samples and see if there are any differences, which can't be accessed easily. Current study proved the acceleration of mineralization in osteoblast cells when exposed to pAMUS but considering the experimental setup, application of two transducers at certain angle and particular distance from focal point can be an issue. This setup requires a high level of precision as small changes in angel and distance can disturbed the focal region. Furthermore, it is important to consider if such a setup can be used or adopted into in vivo application or not. This study only looks at two experimental frequencies with stimulation time of 15 min per day thus it can't address the question of application time and its effects on mineralization.
In summary, the study was aiming to analyze the effects of modulated ultrasound signal in comparison with plain pulsed ultrasound on mineralization in osteoblast cells. The study has demonstrated the promising results that pAMUS has higher effectiveness of triggering initial osteoblastic mineralization than LIPUS.
We speculate that this increased mineralization is due to the modified format of mechanical wave at 45 kHz and 100 kHz frequencies, which enhanced mechanotransduction of cell membrane, e.g., by activation of surface integrin and further use of low frequencies can trigger enzymatic activity in osteoblast cells. The enhanced mineralization in pAMUS relative to traditional pulsed ultrasound suggests that amplitude modulation can further enhance the mineralization process in osteoblast and osteogenic activities. Thus, the pAMUS may further accelerate bone healing process more effectively.
Acknowledgments
This research is kindly supported by the National Institute of Health (R01 AR52379 and R01 AR49286), the US Army Medical Research and Materiel Command, the National Space Biomedical Research Institute through NASA contract NCC 9-58, and NYSTAR.
References
- 1.Azuma Y, Ito M, Harada Y, Takagi H, Ohta T, Jingushi S. Low-intensity pulsed ultrasound accelerates rat femoral fracture healing by acting on the various cellular reactions in the fracture callus. J Bone Miner Res. 2001;16:671–680. doi: 10.1359/jbmr.2001.16.4.671. [DOI] [PubMed] [Google Scholar]
- 2.Chen SH, Chiu CY, Yeh JM, Wang SH. Effect of low intensity ultrasounds on the growth of osteoblasts. Conf Proc IEEE Eng Med Biol Soc. 2007:5834–5837. doi: 10.1109/IEMBS.2007.4353674. [DOI] [PubMed] [Google Scholar]
- 3.Entezari MH, Petrier C. A combination of ultrasound and oxidative enzyme: sono-biodegradation of substituted phenols. Ultrason Sonochem. 2003;10:241–246. doi: 10.1016/S1350-4177(03)00087-7. [DOI] [PubMed] [Google Scholar]
- 4.Entezari MH, Petrier C. A combination of ultrasound and oxidative enzyme: sono-enzyme degradation of phenols in a mixture. Ultrason Sonochem. 2005;12:283–288. doi: 10.1016/j.ultsonch.2004.01.040. [DOI] [PubMed] [Google Scholar]
- 5.Erinc K, Yamani MH, Starling RC, Crowe T, Hobbs R, Bott-Silverman C, Rincon G, Young JB, Feng J, Cook DJ, Smedira N, Tuzcu EM. The effect of combined Angiotensin-converting enzyme inhibition and calcium antagonism on allograft coronary vasculopathy validated by intravascular ultrasound. J Heart Lung Transplant. 2005;24:1033–1038. doi: 10.1016/j.healun.2004.06.005. [DOI] [PubMed] [Google Scholar]
- 6.Esenwein SA, Dudda M, Pommer A, Hopf KF, Kutscha-Lissberg F, Muhr G. Efficiency of low-intensity pulsed ultrasound on distraction osteogenesis in case of delayed callotasis—clinical results. Zentralbl Chir. 2004;129:413–420. doi: 10.1055/s-2004-820398. [DOI] [PubMed] [Google Scholar]
- 7.Feril LB, Jr, Kondo T. Biological effects of low intensity ultrasound: the mechanism involved, and its implications on therapy and on biosafety of ultrasound. J Radiat Res (Tokyo) 2004;45:479–489. doi: 10.1269/jrr.45.479. [DOI] [PubMed] [Google Scholar]
- 8.Frankel VH, Mizuho K. Management of non-union with pulsed low-intensity ultrasound therapy— international results. Surg Technol Int. 2002;10:195–200. [PubMed] [Google Scholar]
- 9.Gebauer D, Correll J. Pulsed low-intensity ultrasound: a new salvage procedure for delayed unions and nonunions after leg lengthening in children. J Pediatr Orthop. 2005;25:750–754. doi: 10.1097/01.bpo.0000173245.12184.7e. [DOI] [PubMed] [Google Scholar]
- 10.Gebauer D, Mayr E, Orthner E, Ryaby JP. Low-intensity pulsed ultrasound: effects on nonunions. Ultrasound Med Biol. 2005;31:1391–1402. doi: 10.1016/j.ultrasmedbio.2005.06.002. [DOI] [PubMed] [Google Scholar]
- 11.Leung KS, Lee WS, Tsui HF, Liu PP, Cheung WH. Complex tibial fracture outcomes following treatment with low-intensity pulsed ultrasound. Ultrasound Med Biol. 2004;30:389–395. doi: 10.1016/j.ultrasmedbio.2003.11.008. [DOI] [PubMed] [Google Scholar]
- 12.Liu H, Li W, Gao C, Kumagai Y, Blacher RW, DenBesten PK. Dentonin, a fragment of MEPE, enhanced dental pulp stem cell proliferation. J Dent Res. 2004;83:496–499. doi: 10.1177/154405910408300612. [DOI] [PubMed] [Google Scholar]
- 13.Lu H, Qin L, Lee K, Cheung W, Chan K, Leung K. Identification of genes responsive to low-intensity pulsed ultrasound stimulations. Biochem Biophys Res Commun. 2009;378:569–573. doi: 10.1016/j.bbrc.2008.11.074. [DOI] [PubMed] [Google Scholar]
- 14.Luthje P, Nurmi-Luthje I. Non-union of the clavicle and delayed union of the proximal fifth metatarsal treated with low-intensity pulsed ultrasound in two soccer players. J Sports Med Phys Fitness. 2006;46:476–480. [PubMed] [Google Scholar]
- 15.Mayr E, Mockl C, Lenich A, Ecker M, Ruter A. Is low intensity ultrasound effective in treatment of disorders of fracture healing? Unfallchirurg. 2002;105:108–115. doi: 10.1007/s001130100301. [DOI] [PubMed] [Google Scholar]
- 16.Nolte PA, van der Krans A, Patka P, Janssen IM, Ryaby JP, Albers GH. Low-intensity pulsed ultrasound in the treatment of nonunions. J Trauma. 2001;51:693–702. doi: 10.1097/00005373-200110000-00012. discussion 702–3. [DOI] [PubMed] [Google Scholar]
- 17.Qin YX, Lam H, Ferreri S, Rubin C. Dynamic skeletal muscle stimulation and its potential in bone adaptation. J Musculoskelet Neuronal Interact. 2010;10:12–24. [PMC free article] [PubMed] [Google Scholar]
- 18.Rokhina EV, Lens P, Virkutyte J. Low-frequency ultrasound in biotechnology: state of the art. Trends Biotechnol. 2009;27:298–306. doi: 10.1016/j.tibtech.2009.02.001. [DOI] [PubMed] [Google Scholar]
- 19.Rubin C, Judex S, Qin YX. Low-level mechanical signals and their potential as a non-pharmacological intervention for osteoporosis. Age Ageing. 2006;35(Suppl 2):ii32–ii36. doi: 10.1093/ageing/afl082. [DOI] [PubMed] [Google Scholar]
- 20.Rutten S, Nolte PA, Korstjens CM, van Duin MA, Klein-Nulend J. Low-intensity pulsed ultrasound increases bone volume, osteoid thickness and mineral apposition rate in the area of fracture healing in patients with a delayed union of the osteotomized fibula. Bone. 2008;43:348–354. doi: 10.1016/j.bone.2008.04.010. [DOI] [PubMed] [Google Scholar]
- 21.Saito M, Fujii K, Tanaka T, Soshi S. Effect of low- and high-intensity pulsed ultrasound on collagen post-translational modifications in MC3T3-E1 osteoblasts. Calcif Tissue Int. 2004;75:384–395. doi: 10.1007/s00223-004-0292-9. [DOI] [PubMed] [Google Scholar]
- 22.Saito M, Soshi S, Tanaka T, Fujii K. Intensity-related differences in collagen post-translational modification in MC3T3-E1 osteoblasts after exposure to low-and high-intensity pulsed ultrasound. Bone. 2004;35:644–655. doi: 10.1016/j.bone.2004.04.024. [DOI] [PubMed] [Google Scholar]
- 23.Sena K, Leven RM, Mazhar K, Sumner DR, Virdi AS. Early gene response to low-intensity pulsed ultrasound in rat osteoblastic cells. Ultrasound Med Biol. 2005;31:703–708. doi: 10.1016/j.ultrasmedbio.2005.01.013. [DOI] [PubMed] [Google Scholar]
- 24.Stanford CM, Jacobson PA, Eanes ED, Lembke LA, Midura RJ. Rapidly forming apatitic mineral in an osteoblastic cell line (UMR 106-01 BSP) J Biol Chem. 1995;270:9420–9428. doi: 10.1074/jbc.270.16.9420. [DOI] [PubMed] [Google Scholar]
- 25.Suzuki A, Takayama T, Suzuki N, Sato M, Fukuda T, Ito K. Daily low-intensity pulsed ultrasound-mediated osteogenic differentiation in rat osteoblasts. Acta Biochim Biophys Sin (Shanghai) 2009;41:108–115. doi: 10.1093/abbs/gmn012. [DOI] [PubMed] [Google Scholar]
- 26.Takikawa S, Matsui N, Kokubu T, Tsunoda M, Fujioka H, Mizuno K, Azuma Y. Low-intensity pulsed ultrasound initiates bone healing in rat nonunion fracture model. J Ultrasound Med. 2001;20:197–205. doi: 10.7863/jum.2001.20.3.197. [DOI] [PubMed] [Google Scholar]
- 27.Unsworth J, Kaneez S, Harris S, Ridgway J, Fenwick S, Chenery D, Harrison A. Pulsed low intensity ultrasound enhances mineralisation in preosteoblast cells. Ultrasound Med Biol. 2007;33:1468–1474. doi: 10.1016/j.ultrasmedbio.2006.12.003. [DOI] [PubMed] [Google Scholar]
- 28.Wang D, Christensen K, Chawla K, Xiao G, Krebsbach PH, Franceschi RT. Isolation and characterization of MC3T3-E1 preosteoblast subclones with distinct in vitro and in vivo differentiation/mineralization potential. J Bone Miner Res. 1999;14:893–903. doi: 10.1359/jbmr.1999.14.6.893. [DOI] [PubMed] [Google Scholar]
- 29.Wu J, Ge X. Oxidative burst, jasmonic acid biosynthesis, and taxol production induced by low-energy ultrasound in Taxus chinensis cell suspension cultures. Biotechnol Bioeng. 2004;85:714–721. doi: 10.1002/bit.10911. [DOI] [PubMed] [Google Scholar]
- 30.Yu G, He P, Shao L, Zhu Y. Enzyme extraction by ultrasound from sludge flocs. J Environ Sci. 2009;21:204–210. doi: 10.1016/s1001-0742(08)62252-4. [DOI] [PubMed] [Google Scholar]


