

Abstract
Since the beginning of the 1980s, cryo-electron microscopy of a thin film of vitrified aqueous suspension has made it possible to observe biological particles in their native state, in the absence of the usual artefacts of dehydration and staining. Combined with 3-d reconstruction, it has become an important tool for structural molecular biology. Larger objects such as cells and tissues cannot generally be squeezed in a thin enough film. Cryo-electron microscopy of vitreous sections (CEMOVIS) provides then a solution. It requires vitrification of a sizable piece of biological material and cutting it into ultrathin sections, which are observed in the vitrified state. Each of these operations raises serious difficulties that have now been overcome. In general, the native state seen with CEMOVIS is very different from what has been seen before and it is seen in more detail. CEMOVIS will give its full potential when combined with computerized electron tomography for 3-d reconstruction.
Keywords: bacterial envelope, desmosome, high-pressure freezing, intermediate filament, vitrification
Cryo-electron microscopy and vitrification
In the early days of the European Molecular Biology Laboratory in Heidelberg, we were learning how to deal with frozen water in the electron microscope (EM). One of us (AM) decided to improve cooling by immersing the sprayed water droplets in liquid ethane rather than in liquid nitrogen. The result was a surprise: instead of the usual ice crystals observed at −160°C, the drops looked structureless and electron diffraction confirmed that the material was amorphous. The explanation came with warming: at −135°C, the drops abruptly transformed into a polycrystal, easily identified as cubic ice, a known low-temperature form of ice. For the first time, vitrified liquid water had been seen in an EM. In spite of the fact that existence of vitreous water had just been demonstrated (Mayer and Brüggeller, 1980), our finding was difficult to publish since it was generally believed that vitrification of liquid water is impossible for thermodynamical reasons. The article was eventually published (Dubochet and McDowall, 1981) but the lasting conflict between theory and experiment remains to date, demonstrating that there is something essential that is still not understood about water (Angell, 2004). When the solution is finally found, it could have deep consequences for biology as well.
The thin film vitrification method (1984)
The finding that liquid water can be vitrified could rapidly be turned into a practical method thanks to three fortunate circumstances. (1) Vitrification needs a very high cooling rate but microscopists observe very thin objects. Vitrification becomes possible just when the thickness of the specimen is right for EM observation. (2) The formation of a film of solution, thin enough to be observed by transmission EM, was considered to be a major difficulty until it was found that a large self-supporting water film of submicron thickness forms by itself and can remain for seconds before breaking. (3) Electron microscopists are accustomed to stain specimens in order to increase contrast. The prognostic for visualizing unstained particles floating in water was not good. Experience has proved otherwise; in many cases, fine details are better seen unstained in their aqueous environment than dry and stained on a supporting film. This is because it is not the contrast that is important but the signal to noise ratio, and the latter is best in vitreous water, in the absence of stain and supporting film, where the only source of noise is electron statistic. Thanks to these three advantageous situations, and to the development of stable cryo-EMs and cryo-specimen holders, it was possible to develop cryo-EM of thin vitrified layers of biological suspensions into a simple and reliable method (Adrian et al, 1984; Dubochet et al, 1988). Water, which had always been considered as a disturbance in EM, regained its noble status of biological matter's first constituent and cryo-EM became a major tool of structural molecular biology and proteomics (Abbott, 2002).
CEMOVIS
But cryo-EM of vitrified thin layers applies only to objects small enough to fit in the thin liquid film. The method is well adapted for macromolecules and their complexes, for viruses and for many filamentous structures. Some small organelles have also been observed and even thin regions of whole cells in favourable cases. But anything in the range of 1 μm or larger remains inaccessible because it is too thick to be observed by normal transmission EM.
The limitation of the thin film vitrification method can only be overcome if bulk specimens, at least the size of several typical cells or of a small biopsy, can be vitrified and cut into sections. This is what Cryo-EM Of Vitreous Sections (CEMOVIS) does. The idea dates from the late 1950s (Fernandez-Moran, 1985) and our own involvement has been continuous since the beginning of our cryo-EM effort. The start was promising. It was found that, while crystalline water can only be fractured, vitreous water can be cut and some impressive images of liver, muscle and bacteria were obtained (reviewed in Dubochet et al, 1988). However, the depth of vitrification that can be achieved in cells and tissues is only in the 10 μm range and in most cases, sectioning produces more shavings than bona fide vitreous sections. CEMOVIS has reached maturity after 20 years. It is now possible to observe for the first time by EM cells and tissues in their intact natural state with unprecedented resolution. What is obvious from these observations is that the native state looks amazingly different from what conventional EM has shown over half a century. Furthermore, it shows it with more and finer details (Gautier et al, 1986; McDowall et al, 1986; Michel et al, 1991; Lepault et al, 1992; Richter, 1994b; Dubochet and Sartori Blanc, 2001; Leforestier et al, 2001; Sartori Blanc et al, 2001; Matias et al, 2003; Norlén et al, 2003; Al-Amoudi et al, 2004).
What makes us claim that CEMOVIS is now a practical method ready for general application and what is the recipe to make it work? Our best answer lies in the images presented below, which should speak for themselves, and in the formula
 |
which states that the probability of a successful observation with CEMOVIS (P) is the product of the probability of success of all the different steps leading from the original biological material to the final observation. These steps are: S=obtaining a good biological sample; I=installing the sample in the high-pressure freezer; V=vitrifying; E=extracting the sample from the freezer; M=mounting in the cryo-microtome; C=cutting; A=adjusting the cutting conditions and environment; T=transferring the section on the grid; T=transferring the grid in the EM; O=observing; R=recording the image at low dose. None of these operations requires exceptional skill or luck but all of them must be successfully accomplished. A single miss and the whole experiment is lost. The wretched scientist whose success rate for each operation averages 60% will hardly get one good micrograph per year of assiduous work. The recipe for success with CEMOVIS lies therefore simply in a systematic training of every movement and every step until each of them is perfectly mastered. This may seem demanding to some scientists but any surgeon prepares himself in the same way before opening his first patient. So we hope, at least! A detailed account of the know-how required for CEMOVIS operation is presented elsewhere (Dubochet et al, 1988; Richter et al, 1991; Richter, 1994a, 1994b; Sartori Blanc et al, 1998; Studer et al, 2001; Al-Amoudi et al, 2002, 2004).
Progress in two domains has been of crucial importance. The first one is high-pressure freezing, which made it possible to increase the size of a typical biological sample that can be vitrified from 10 to 100 μm range (Moor, 1987; Studer et al, 1989; Sartori et al, 1993). Bulky specimens can now be observed without interference from surface effects or damage caused by the biopsy. The second progress comes from a better understanding of the cutting process. Unlike resin-embedded materials, which behave more or less like elastic substances, regaining their original shape after section, vitreous materials are, by definition, high-viscosity fluids like butter or honey. Cutting a thin vitreous section is a challenge implying a trade-off between two evils: plastic flow and fracture. Considerable effort has been made to understand and optimize the process (Dubochet et al, 1988; Richter, 1994b, 1994c; Sartori Blanc et al, 1998; Al-Amoudi et al, 2002, 2003). An experienced operator can now reproducibly obtain ribbons of homogeneous, ca. 50 nm thick sections in which biological structures are remarkably preserved.
Illustration of CEMOVIS
Bacteria
Figure 1 shows Gram-negative bacteria prepared by conventional resin embedding (A) and CEMOVIS (B). There are indeed better preparation methods than the one used for (A) (see below) but it is representative of a majority of present time observations. The most conspicuous difference between the dry and the vitreous preparations comes from the fact that (A) is mainly an image of stain distribution, whereas (B) shows the mass-contrast of native unaltered material. In the stained preparation, the outer membrane and plasma membrane (white arrows) have the classical aspect of a bilayer due to stain deposition on both the sides of the hydrophobic central region. Membranes shown by CEMOVIS represent the true mass distribution. It is apparent for example that the outer membrane contains more material and is slightly thicker than the inner membrane. A more detailed analysis shows the asymmetry of the outer membrane (Matias et al, 2003) and reveals the fine structure of the peptidoglycan layer (black arrow in B).
Figure 1.
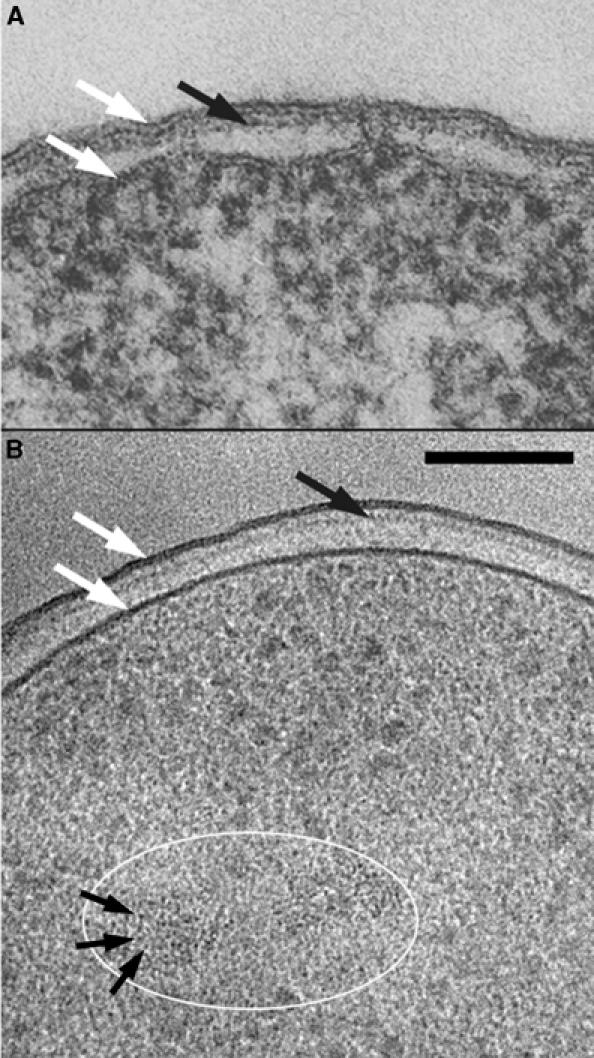
Gram-negative bacteria. (A) Escherichia coli K12 embedded in conventional resin (from Beveridge, 1999, Figure 1, with permission). (B) Pseudomonas aeruginosa PAO1 prepared by CEMOVIS (Matias et al, 2003). The cells in exponential growth were put in 20% (wt/vol) dextran (42 kDa) and vitrified in a Leica EMPACT (Vienna, Austria) high-pressure freezer. The sections were cut at −160°C in a Leica UCS/FCS cryomicrotome with a 45° Diatome diamond cryo-knife (Biel, Switzerland). Observation was made at −180°C in a Philips CM12 EM (Eindhoven, The Netherlands) operating at 80 kV and equipped with a Gatan 626 cryo-specimen holder (Warrendale, PA) and a Gatan 600CW Multiscan CCD camera. The total electron dose did not exceed 800 e/nm2. Technical details are described in previous publications (Dubochet et al, 1988; Al-Amoudi et al, 2002) or are in preparation. White arrows: cell membrane and outer membrane; black arrows: peptidoglycan layer; the white ellipse marks a region of the nucleoid; small black arrows: 2 nm high-contrast dots identified as portions of DNA filaments seen along their axis. Scale bar: 100 nm.
The other difference comes from the fact that in conventional preparations, the material is always more or less aggregated, since particles floating in a liquid cannot remain unattached upon chemical fixation and dehydration. In this respect, freeze substitution (see below) is better than conventional plastic embedding (as in A) but aggregation can never be completely avoided in dry specimens. The extent of aggregation is demonstrated by comparing (A) and (B), noticing in particular the irregular shape of the envelope with the ‘bridges' between the outer and plasma membranes and the patchy aspect of the cytoplasm in the dry specimen. The bacterial nucleoid is especially aggregation prone (Robinow and Kellenberger, 1994), contributing thus to leave its detailed structure unsolved. With CEMOVIS, the nucleoid is recognized as a ribosome-free region. Bundles of locally parallel DNA can probably be identified (ellipse) since the 2 nm highly contrasted dots (small arrows) are characteristic of locally straight fragments of double-stranded DNA seen along their axis (Dubochet et al, 1994; Richter, 1994b; Sartori Blanc et al, 2001) thus providing the first direct view of local molecular organization of a bacterial chromosome. Direct visualization of DNA is however limited to those regions where the molecules are favourably oriented.
Cyanobacteria are a good test material because of their numerous internal structures and their complex envelope. Their highly hydrated extracellular matrix is especially difficult to preserve by classical embedding methods. More suitable methods such as freeze substitution have nevertheless allowed detailed studies revealing external layers such as S-layers, serrated layers, capsule, sheath and slime (Hoiczyk and Baumeister, 1995; Sleytr and Beveridge, 1999).
Figure 2 shows at low (A) and high (B) magnifications the envelope of the cyanobacterium Lyngbyia majuscula prepared by CEMOVIS. The extraordinary diversity and extension of the external layers is visible in (A). At this low magnification, the fine structure of the extracellular matrix is not clearly visible but at least three zones can be recognized (marked I–III). The medium in which the bacteria are floating is recognized here because it is abundantly crevassed (white asterisk). The most external layer of the extracellular matrix (zone I) is identified by its smooth appearance, contrasting with the rough aspect of the external medium. Zone II, which is slightly crevassed, contains irregular structures. Zone III is a narrow, low-density region. When seen at a high magnification (B), the structure of the envelope appears as never seen before. By comparing this micrograph with the images of similar cyanobacteria (e.g. Hoiczyk and Baumeister, 1995; Figure 1A and D), the following structures can be identified with confidence: cell membrane (CM), peptidoglycan (P) and outer membrane (OM). The layer with a remarkable periodicity of ca. 13 nm is probably the S-layer. Its structure has been studied at a high resolution in the isolated form, but, in plastic embedding, its fine structure remains generally unresolved (Sleytr and Beveridge, 1999). Besides these major features, the figure reveals several additional layers (black arrows), difficult to correlate with published conventional observations. Other micrographs reveal a periodic organization in several of these layers (Al-Amoudi et al, 2004). External to the putative S-layer we can recognize zone III from Figure 2A, characterized by a network of very thin filaments (visible in other micrographs) and zone II showing, under favourable orientation, a bundle of distant, ca. 4 nm diameter filaments (Figure 2B, arrowheads).
Figure 2.
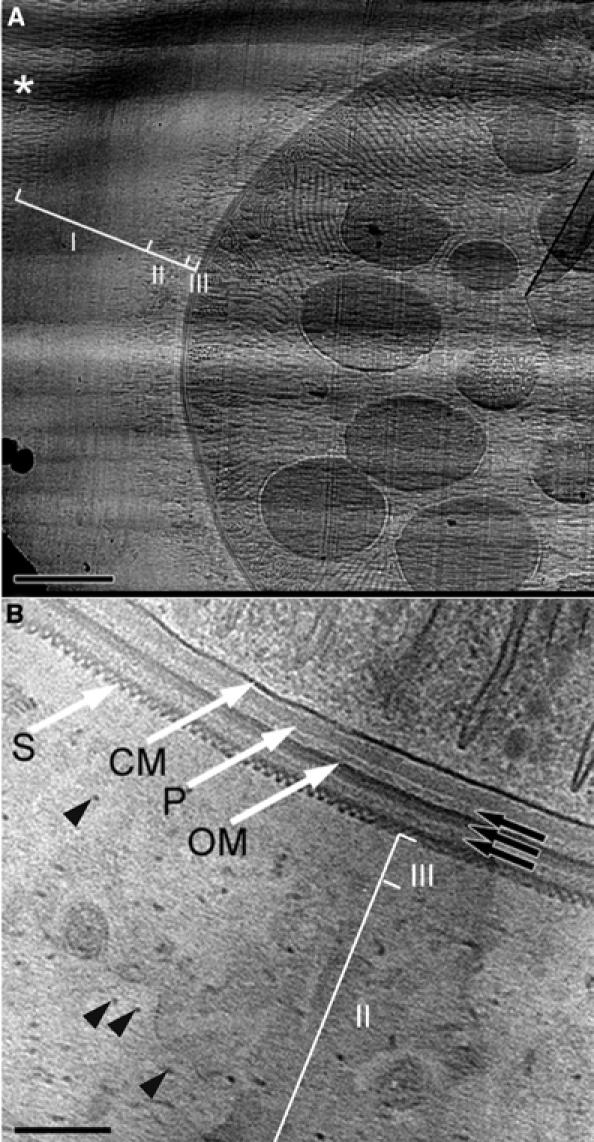
Cyanobacterium L. majuscula prepared by CEMOVIS. (A) Low-magnification view. I, II and III are different zones of the extracellular matrix; white asterisk: bulk medium with crevasses. Scale bar: 1 μm. (B) High-magnification view of the envelope. CM: cell membrane; P: peptidoglycan; OM: outer membrane; S: putative S-layer; black arrows: additional layers; II and III: zones of the extracellular matrix; black arrowheads: filaments in zone II. Scale bar: 100 nm.
It is evident that such highly hydrated fibrous structures are impossible to preserve faithfully upon removal of the liquid medium in which the fibres are floating. For such delicate structures and also for the exquisite fine detail of the envelope shown above, CEMOVIS opens a new domain for structural biological investigation.
Tissue
Figure 3A shows an epidermal desmosome prepared by freeze substitution from a recent study that led to a remarkable 3-d reconstruction by electron tomography (He et al, 2003). Figure 3B–D, from an ongoing study on human skin formation (Norlén et al, 2003; Al-Amoudi et al, 2004; Norlén and Al-Amoudi, 2004), is obtained with CEMOVIS from a ca. 150 μm thick fully vitrified biopsy in which the different strata of the epidermis can be viewed under equally good conditions. Here again the comparison, which should be put in the context of the large amount of available structural and functional data (Garrod et al, 2002; see also Alberts et al, 2002, p 1073), demonstrates that what CEMOVIS shows is different from what has been seen before and it is seen in greater detail. We note in particular the following: (1) the cell membranes (black arrows), seen as stain-repelling regions in (A) and as dense 4 nm thick bilayers in the native state (B); (2) the intracellular plaque (white arrows), where intermediate filaments (IFs) are thought to be attached, is diffuse in (A) whereas in the native state it appears as an 8 nm thick layer 10 nm under the cell membrane, frequently displaying a 7 nm periodicity (white arrowhead); (3) in (B), the extracellular space (square bracket) contains a fine regular arrangement of cadherin proteins (ca. 5 nm periodicity) not visible in (A). (B) shows that cadherin molecules are straight and regularly arranged, whereas previous observations have shown them as bent and irregularly spaced.
Figure 3.
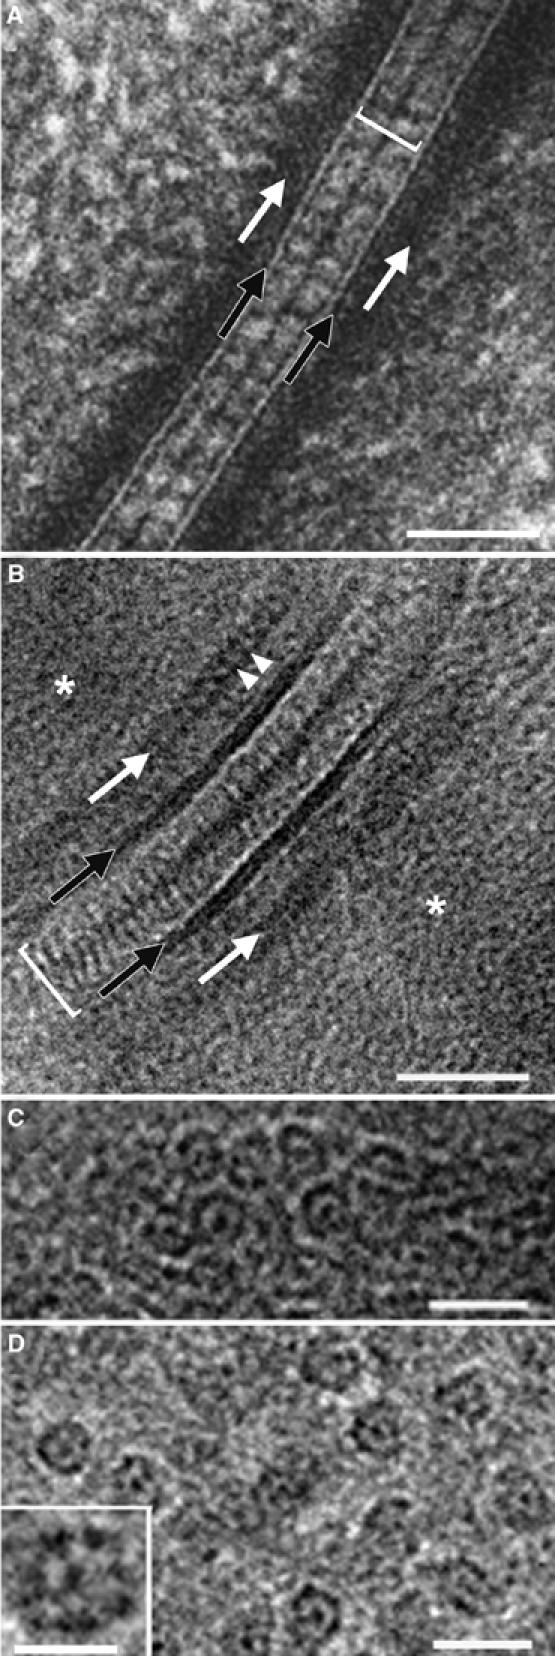
Epidermal desmosome and IFs. (A) Desmosome from neonatal mouse epidermis prepared by freeze substitution (from He et al, 2003, from Figure 1B, with permission). (B) Human desmosome at midportion of the viable part of forearm epidermis prepared by CEMOVIS. A ca. 200 μm thick layer was sliced with a razor blade and immediately cooled in a Baltec HPM 010 (Balzers, Liechtenstein) high-pressure freezing apparatus. The rest of the preparation was as for Figure 2B. See text for more explanations. (C) Same region as in (B) but with IFs oriented along the viewing direction. (D) As in (C) but in stratum corneum. The fine structure of the IFs is best resolved in the thinnest sections (inset). (C, D) Modified from Norlén and Al-Amoudi (2004), with permission. Section thickness: 70 nm (B, C); less than 50 nm (D). Scale bar: 50 nm (A, B); 20 nm (C, D); 10 nm (inset, D).
The apparent absence of IFs attached to the intracellular plaque and the lack of characteristic structures in a large area of the native specimen image (Figure 3B, asterisk) does not mean that no structural information is present in these regions. In contrast to conventional preparations, all the structural features of the native specimen are present in the vitreous section down to atomic resolution (except for cutting-induced deformations and electron-beam damage). The problem is that they are generally uninterpretable because of superposition effects over the thickness of the section. IFs are easily recognized when they are oriented along the viewing direction as it is the case in Figure 3C and D. Their still unresolved internal structure (Parry and Steinert, 1999) shows a central density, and the arrangement of the protofilaments is visible in the thinnest sections (Figure 3D, inset).
Finally, it is noteworthy that the dimensions measured by CEMOVIS (taking into account the deformation along the cutting direction) are typically larger by 15% or more than in fixed dehydrated specimens. This effect is similar to what is observed with biological particles in a thin vitrified film and it is probably the consequence of aggregation effects in dry preparation protocols. Ergo, the diameter of IFs is ca. 11.5 nm instead of the generally reported 10 nm and the desmosomal gap is 34 nm instead of 28 nm.
Conclusion and prospect
Figure 4 is a stereoview of an 895 bp double-stranded DNA showing the helical path of the supercoiled molecule floating in a thin layer of vitrified solution. For an electron microscopist, familiar with the classical method and with the strict requirement for stain or metal shadow for visualizing DNA, this 3-d view of the native state may appear as a surprise. Although Figure 4 is not a cryosection of a native cell but a thin vitrified layer of a diluted solution, it demonstrates that the major limitation of EM is not the lack of contrast of native structures at the molecular level. The other figures further demonstrate that with CEMOVIS, the advantage of cryo-EM can, in principle, be extended to any cells and tissues. What is left as the major limitation is only the plethora of information throughout the thickness of the section.
Figure 4.
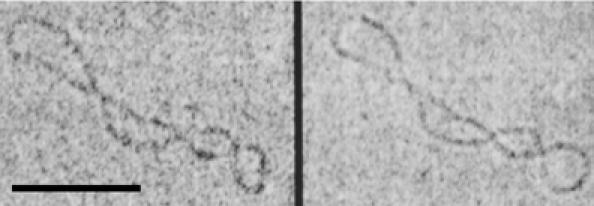
Stereo-pair of an 895 bp supercoiled double-stranded DNA molecule. Preparation by vitrification of a thin layer of 200 μg/ml DNA solution. Tilt angle: ±15°. The first exposure is on the right. Electron dose for each micrograph: ca. 2000 e/nm2. Scale bar: 50 nm. Courtesy Dr Jan Bednar.
Computerized electron tomography (CET) may offer further promotion of CEMOVIS as a tool for structural biology. This method, which is old in principle (Hegerl and Hoppe, 1976), has recently been successfully implemented in practice and applied to semithin (ca. 200 nm) vitrified specimens (Nicastro et al, 2000; Medalia et al, 2002). It consists in recording a large number of tilted images (typically 100) from which a 3-d model of the specimen is calculated. The challenge is formidable since the total electron dose cannot exceed the dose used for two (or few) normal images, the required mechanical precision is extreme and the whole recording process must be fully automated. Nevertheless, the method works! Resolution around 6 nm has been convincingly reported in reconstructed images. Applying CET to the much thinner specimens obtained with CEMOVIS should make a resolution below 3 nm possible.
A 3-d map of the cell, with a resolution similar to Figure 4, showing for example the path of the DNA in chromatin would be of tremendous interest. It could be fitted with atomic maps of macromolecules and complex particles such as DNA, nucleosomes, ribosomes, etc. The dream of an atomic map of the cell may be at hand (Grünewald et al, 2003; Sali et al, 2003).
Acknowledgments
We thank Drs V Matias and T Beveridge for the Gram-negative bacteria, A Burja, J Fuerst and R Webb for the cyanobacteria, T Beveridge for Figure 1A, W He and D Strokes for Figure 3A, J Bednar for Figure 4 and all of them for useful discussions.
This article is dedicated to the memory of Sir John Kendrew who supported our effort when there were good reasons not to do so.
References
- Abbott A (2002) The society of proteins. Nature 417: 894–896 [DOI] [PubMed] [Google Scholar]
- Adrian M, Dubochet J, Lepault J, McDowall AW (1984) Cryo-electron microscopy of viruses. Nature 308: 32–36 [DOI] [PubMed] [Google Scholar]
- Al-Amoudi A, Dubochet J, Gnaegi H, Lüthi W, Studer D (2003) An oscillating cryo-knife reduces cutting-induced deformation of vitreous ultrathin sections. J Microsc 212: 26–33 [DOI] [PubMed] [Google Scholar]
- Al-Amoudi A, Dubochet J, Studer D (2002) Amorphous solid water produced by cryosectioning of crystalline ice at 113 K. J Microsc 207: 146–153 [DOI] [PubMed] [Google Scholar]
- Al-Amoudi A, Norlén LPO, Dubochet J (2004) Cryo-electron microscopy of vitreous sections of native biological cells and tissues. J Struct Biol (in press) [DOI] [PubMed] [Google Scholar]
- Alberts B, Johnson A, Lewis J, Raff M, Roberts K, Walter P (2002) Molecular Biology of the Cell. New York, London: Garland Publishing Inc. [Google Scholar]
- Angell CA (2004) Amorphous water. Annu Rev Phys Chem 55: 559–583 [DOI] [PubMed] [Google Scholar]
- Beveridge TJ (1999) Structures of Gram-negative cell walls and their derived membrane vesicles. J Bacteriol 181: 4725–4733 [DOI] [PMC free article] [PubMed] [Google Scholar]
- Dubochet J, Adrian M, Chang J-J, Homo J-C, Lepault J, McDowall AW, Schultz P (1988) Cryo-electron microscopy of vitrified specimens. Q Rev Biophys 21: 129–228 [DOI] [PubMed] [Google Scholar]
- Dubochet J, Bednar J, Furrer P, Stasiak A (1994) Cryo-electron microscopy of DNA. In Nucleic Acids and Molecular Biology, Eckstein F, Lilley DMJ (eds) Vol. 8, pp 41–55. Berlin: Springer-Verlag [Google Scholar]
- Dubochet J, McDowall AW (1981) Vitrification of pure water for electron microscopy. J Microsc 124: RP3–RP4 [Google Scholar]
- Dubochet J, Sartori Blanc N (2001) The cell in absence of aggregation artifacts. Micron 32: 91–99 [DOI] [PubMed] [Google Scholar]
- Fernandez-Moran H (1985) Cryo-electron microscopy and ultramicrotomy: reminiscences and reflections. In Adv Electronics Electron Phys. Academic Press suppl. 16, pp 167–223 [Google Scholar]
- Garrod DR, Merritt AJ, Nie Z (2002) Desmosomal cadherins. Curr Opin Cell Biol 14: 537–545 [DOI] [PubMed] [Google Scholar]
- Gautier A, Michel-Salamin L, Tosi-Couture E, McDowall AW, Dubochet J (1986) Electron microscopy of the chromosomes of dinoflagellates in situ: confirmation of Bouligand's liquid crystal hypothesis. J Ultrastruct Mol Struct Res 97: 10–30 [Google Scholar]
- Grünewald K, Medalia O, Gross A, Steven AC, Baumeister W (2003) Prospects of electron cryotomography to visualize macromolecular complexes inside cellular compartments: implications of crowding. Biophys Chem 100: 577–591 [DOI] [PubMed] [Google Scholar]
- He W, Cowin P, Stokes DL (2003) Untangling desmosomal knots with electron tomography. Science 302: 109–113 [DOI] [PubMed] [Google Scholar]
- Hegerl R, Hoppe W (1976) Influence of electron noise on three-dimensional reconstruction. Z Naturforsch 31a: 1717–1721 [Google Scholar]
- Hoiczyk E, Baumeister W (1995) Envelope structure of four gliding filamentous cyanobacteria. J Bacteriol 177: 2387–2395 [DOI] [PMC free article] [PubMed] [Google Scholar]
- Leforestier A, Dubochet J, Livolant F (2001) Bilayers of nucleosome core particles. Biophys J 81: 2414–2421 [DOI] [PMC free article] [PubMed] [Google Scholar]
- Lepault J, Ranck J-L, Erk I (1992) Electron cryomicroscopy of frozen-hydrated biological specimens: analysis of freezing artifacts by X-ray cryocrystallography. Ultramicroscopy 46: 19–24 [DOI] [PubMed] [Google Scholar]
- Matias VRF, Al-Amoudi A, Dubochet J, Beveridge TJ (2003) Cryo-transmission electron microscopy of frozen-hydrated sections of Gram-negative bacteria. J Bacteriol 185: 6112–6118 [DOI] [PMC free article] [PubMed] [Google Scholar]
- Mayer E, Brüggeller P (1980) Complete vitrification in pure liquid water and dilute aqueous solutions. Nature 288: 569–571 [Google Scholar]
- McDowall AW, Smith JM, Dubochet J (1986) Cryo-electron microscopy of vitrified chromosomes in situ. EMBO J 5: 1395–1402 [DOI] [PMC free article] [PubMed] [Google Scholar]
- Medalia O, Weber I, Frangakis AS, Nicastro D, Gerisch G, Baumeister W (2002) Macromolecular architecture in eukaryotic cells visualized by cryoelectron tomography. Science 298: 1209–1213 [DOI] [PubMed] [Google Scholar]
- Michel M, Hillmann T, Müller M (1991) Cryosectioning of plant material frozen at high pressure. J Microsc 163: 13–18 [Google Scholar]
- Moor H (1987) Theory and practice of high pressure freezing. In Cryotechniques in Biological Electron Microscopy, Steinbrecht RA, Zierold K (eds) pp 175–191. Heidelberg: Springer [Google Scholar]
- Nicastro D, Frangakis AS, Typke D, Baumeister W (2000) Cryo-electron tomography of Neurospora mitochondria. J Struct Biol 129: 48–56 [DOI] [PubMed] [Google Scholar]
- Norlén L, Al-Amoudi A (2004) Stratum corneum keratin structure, function and formation—the cubic rod-packing and membrane templating model. J Invest Dermatol (in press) [DOI] [PubMed] [Google Scholar]
- Norlén L, Al-Amoudi A, Dubochet J (2003) A cryotransmission electron microscopy study of skin barrier formation. J Invest Dermatol 120: 555–560 [DOI] [PubMed] [Google Scholar]
- Parry DA, Steinert PM (1999) Intermediate filaments: molecular architecture, assembly, dynamics and polymorphism. Q Rev Biophys 32: 99–187 [DOI] [PubMed] [Google Scholar]
- Richter K (1994a) A cryoglue to mount vitreous biological specimens for cryoultramicrotomy at 110 K. J Microsc 173: 143–147 [DOI] [PubMed] [Google Scholar]
- Richter K (1994b) Cutting artefacts on ultrathin cryosections of biological bulk specimens. Micron 25: 297–308 [DOI] [PubMed] [Google Scholar]
- Richter K (1994c) High-density morphologies of ice in high-pressure frozen biological specimens. Ultramicroscopy 53: 237–249 [DOI] [PubMed] [Google Scholar]
- Richter K, Gnägi H, Dubochet J (1991) A model for cryosectioning based on the morphology of vitrified ultrathin sections. J Microsc 163: 19–28 [DOI] [PubMed] [Google Scholar]
- Robinow C, Kellenberger E (1994) The bacterial nucleoid revisited. Microbiol Rev 58: 211–232 [DOI] [PMC free article] [PubMed] [Google Scholar]
- Sali A, Glaeser R, Earnest T, Baumeister W (2003) From words to literature in structural proteomics. Nature 422: 216–225 [DOI] [PubMed] [Google Scholar]
- Sartori Blanc N, Senn A, Leforestier A, Livolant F, Dubochet J (2001) DNA in human and stallion spermatozoa forms local hexagonal packing with twist and many defects. J Struct Biol 134: 76–81 [DOI] [PubMed] [Google Scholar]
- Sartori Blanc N, Studer D, Ruhl K, Dubochet J (1998) Electron beam-induced changes in vitreous sections of biological samples. J Microsc 192: 194–201 [DOI] [PubMed] [Google Scholar]
- Sartori N, Richter K, Dubochet J (1993) Vitrification depth can be increased more than 10 fold by high pressure freezing. J Microsc 172: 55–61 [Google Scholar]
- Sleytr UB, Beveridge TJ (1999) Bacterial S-layers. Trends Microbiol 7: 253–260 [DOI] [PubMed] [Google Scholar]
- Studer D, Graber W, Al-Amoudi A, Eggli P (2001) A new approach for cryofixation by high-pressure freezing. J Microsc 203: 285–294 [DOI] [PubMed] [Google Scholar]
- Studer D, Michel M, Müller M (1989) High pressure freezing comes of age. Scanning Microsc 3: 253–269 [PubMed] [Google Scholar]