

Abstract
Background
Patients with Crohn's disease (CD) encompass a heterogeneous disease spectrum, with variable healthcare utilization and expenditure patterns. Lémann Index (LI) is a metric that quantifies cumulative bowel damage and has shown utility in delineating distinct disease phenotypes.
Aim
To characterize the financial burden from all medical care in a CD cohort in relation to variations in LI-based disease phenotypes.
Methods
CD patients with 5 year(y) follow-up from a prospective registry were included. LI was calculated from first (LI1) and last (LI2) clinical encounters. Change in score (LI2-LI1) or Delta LI (DLI) was used for association analysis with healthcare expenditures.
Results
A total of 243 CD patients formed the study population [median age 44y; 58% female; median disease duration 12y]. DLI was used to define disease trajectories: DLI<0 (indicating improving bowel damage); DLI=0 (stable); DLI>0 (worsening); which comprised 15.6%, 30.9% and 53.5% of the cohort respectively. Patients with DLI>0 had significantly higher CD-related surgeries, healthcare utilization, medication (steroids and biologics) use as well as higher median 5y total and stratified charges compared to the other groups. Total 5y expenditure was $56 million; 67% of which was related to hospitalization. Total expense showed independent positive correlation with LI2 (p=0.001) and DLI (p=0.001), and negative correlation with age (p=0.029) and 5y quality of life score (p=0.024).
Conclusion
The financial burden of CD is significantly associated with worsening bowel damage. Further research should focus on the prediction and management of the costliest/sickest CD patients.
Keywords: Crohn's disease, Lémann Index, healthcare expenditure
Introduction
Crohn's disease (CD) is a chronic inflammatory disorder with a relapsing-remitting course,(1) that exhibits a heterogeneous disease spectrum. While some patients experience a relatively quiescent course, others have frequent flares and severe ongoing subclinical inflammation. Continued luminal inflammatory activity leads to the development of stricturing and/or penetrating complications, in turn contributing to increased need for aggressive therapies, including anti-tumor necrosis factor (TNF) agents, surgeries, hospitalizations and other healthcare utilization.(1, 2) Lémann Index (LI) quantifies the digestive tract damage mediated by CD over time. (3, 4) Calculation of the index involves grading of each segment of the gastrointestinal tract (with grades and segments being pre-defined) on three parameters (presence of stricturing or penetrating complications and surgical resection), while using data obtained from cross sectional and endoscopic imaging. (3, 4) Change in LI or Delta LI (DLI) is an effective means of stratifying patients into distinct, clinically meaningful, CD phenotypes.(5, 6) We previously demonstrated that patients with aggressive disease phenotypes, as reflected by rapidly increasing LI, had higher disease activity and greater healthcare utilization during the interim across which DLI was tracked.(5)
Financial burden from CD care is substantial and amounts to nearly $25,282-$26,192 annually (per patient) in the United States.(7) Healthcare expenditure in CD is largely dependent on the need for surgical intervention, expensive biologic therapies and hospitalization.(8-12) Due to variable disease course; financial burden is also not uniform across CD patients and prior studies have shown that the highest 2% of the patients disproportionately account for 34% of the total costs. (11) Delineating these high utilizers of the healthcare system is essential in identifying more aggressive disease patterns which may warrant a change in our therapeutic algorithm, as well as to help in intensifying other cost reduction strategies in this patient subset. (13)
In prior studies poor socioeconomic status and presence of comorbid medical and psychiatric conditions have been identified as risk factors for high utilization in patients with inflammatory bowel disease (IBD). (14-16) In our previous study additional factors such as black race, use of opiates, penetrating CD phenotype and the use of more aggressive medical therapy at first visit were baseline characteristics that showed association with increased healthcare utilization and expenditure over the next five years.(17) Given the ability of change in LI to delineate distinct CD phenotypes, we aimed to characterize the financial burden from all medical care in a 5-year prospective cohort of CD patients stratified into LI-based disease phenotypes and to evaluate its utility in identifying the subset of costliest patients.
Materials and Methods
Study Population
This was an observational study conducted using a prospectively maintained, longitudinal natural history registry of consented IBD patients, that is housed at the University of Pittsburgh Medical Center, which is a tertiary adult digestive disease center. Patients with a definitive CD diagnosis and with regular follow up (defined as having at least one IBD clinic visit in each year) between January 1, 2009 and December 31, 2013 were identified. Patients with CD of less than 3 month duration were excluded. Charge data for the included patients was obtained for all healthcare services (i.e. not limited to gastrointestinal care) at the UPMC system (which includes >20 hospitals and > 500 outpatient sites) for the years 2009-2013. Patients with charge data missing for more than one consecutive year were excluded. Method of calculation of LI (4) and inclusion & exclusion criteria imposed on patients during calculation of LI for such a cohort has been described in detail in our prior studies.(5, 6) Briefly, patients who had undergone two or more CD related diagnostic imaging (endoscopic or radiologic) tests at least three years apart during the period of follow-up were included. Those who had undergone CD related surgery during the study period without CD related diagnostic imaging tests both preceding and following the surgery were excluded. Diagnostic tests' reports were reviewed and used to calculate LI with a Microsoft Excel based calculator. An example of LI calculation is presented in supplementary Table 1. Finally, patients with LI calculated at two time points (distinguished as LI1 and LI2), and with complete financial healthcare data for the period of interest formed the study cohort. The study was approved by University of Pittsburgh Institutional Review Board (PRO14050636) and confidentiality was maintained for all study material.
Demographics, Clinical Data and Delta Lémann Index
Patient demographics, disease characteristics, including Montreal classification at diagnosis, (18) healthcare utilization, treatment related details (including steroids, immunomodulators, anti-TNF agents, opiates and anti-depressants) during the study and surgical history were extracted from the registry with manual confirmation using the electronic medical record. We chose to focus mainly on the medications used for direct management of Crohn's disease, which are steroids, immunomodulators and anti-TNF agents, as well as medications that are commonly used for symptom management in these patients; namely narcotic analgesics and anti-depressants. Management of each patient's clinical data, including diagnostic testing and prescription of medications was performed based on their provider's discretion. Change in LI (LI2-LI1) was designated as Delta Lémann Index (DLI) and was used to stratify patients into three distinct categories of disease evolution: improvement (DLI<0), no change (DLI=0) or deterioration (DLI>0). Disease activity was gauged prospectively at each clinical visit using metrics such as Harvey Bradshaw Index (HBI)(19) and inflammatory biomarkers such as erythrocyte sedimentation rate (ESR) and C-reactive protein (CRP). Elevation in ESR and CRP were defined as values greater than 20mm/hr and 0.8mg/dl respectively, according to our institutional laboratory's upper limit of normal. Biomarkers and medications were charted on a range from 1-5, based on number of years with one or more abnormal values, or one or more prescriptions respectively. Health related quality of life was gauged prospectively using the Short Inflammatory Bowel Disease Questionnaire (SIBDQ).(20)
Financial Charge Data
Charge data was made available by the Center for Assistance in Research using the EMR, which is an information technology support group at UPMC. Since charges are institutionally specific, they provide a good framework for spending patterns, whereas costs reflect a payer or societal perspective.(21) Hence we chose to focus on the former. Total financial charges were broken down as professional service, inpatient care and outpatient medication (immunomodulator and anti-TNF agent) charges. The choice of approximating only these medications is due to their relatively dominant contribution to medication expenses. Professional service charges comprised physician or specialized personnel fees for outpatient clinic visits and testing (laboratory, radiology, endoscopy, pathology and other diagnostic tests such as echocardiogram, mammogram, pulmonary function tests etc), emergency department (ED) testing and physician services, and fees for outpatient surgery and anesthesia services. Inpatient charges included fees for boarding, administration, medication, diagnostic testing and procedural charges, and surgery incurred during hospitalization. Outpatient biologic agent charges were imputed using average Medicare Part B Allowance Limit statistics (available at http://www.cms.gov/Medicare/Medicare-Fee-for-Service-Part-B-Drugs/McrPartBDrugAvgSalesPrice/index.html) using conservative standard dosing guidelines (infliximab: 5 mg/kg every 8 weeks, adalimumab 40 mg every 2 weeks, certolizumab: 400 mg every 4 weeks) to approximate mean annual biologic cost. If a patient received a biologic agent as an inpatient (typically as a single dose), this was accounted for in the total inpatient hospitalization charge using institution specific charge rates. Outpatient pharmacy charges and total parenteral nutrition charges were not available for inclusion in our charge data as these were insurance payer derived rather than from the healthcare system. All charges were in US dollars and were inflated to 2013 base year using Consumer Price Index adjustment rates (http://www.bLI.gov/data/inflation_calculator.htm).
Statistical Analysis
Given the skewed distribution of financial charges and healthcare utilization, data distribution was deemed non normal by the Kolmogorov-Smirnov test. Categorical variables are expressed as percentages and continuous variables as median [inter- quartile range (IQR)]. Chi squared analysis was used for contingency tables. Difference between groups was evaluated using Mann Whitney U test and Kruskal Walis test for nonparametric continuous data. Since the total financial charges violated normality it was log transformed and then used as the dependent variable for univariate analysis that assessed its correlation with demographic and disease characteristics including disease parameters as per Montreal classification, (18) activity metrics, inflammatory markers, LI scores and DLI. Given that surgery, healthcare visits, hospitalizations and medications during the study period would strongly influence financial charges these variables were not included in the regression analysis. Covariates demonstrating p<0.1 in univariate analysis were included in the multivariate linear regression analysis. The 19.1 SPSS statistical software (SPSS, Chicago, USA) was used to perform all analyses. P values <0.05 were considered statistically significant. All tests were two-sided.
Results
Study Population
In the IBD registry, 430 patients with a definite diagnosis of CD and with regular follow-up between 2009 and 2013 were identified. Amongst them, 363 patients had LI calculated at two time points, 6 months apart during the study period. Complete financial charge data was available for 243 of them and these patients formed the study population. The study cohort comprised 58% females, median age of 44 years (IQR: 34-56) and median disease duration of 12 years (IQR: 7-19) (Table 1). Nearly 72% (175/243) of our patients had undergone at least one CD-related surgical procedure prior to study inclusion and 102 (42%) patients required CD-related surgery during the study period. Psychiatric co-morbidities were concomitantly present in 32% (78/243) of the study population.
Table 1. Demographic and clinical characteristics of Crohn's disease patients (n =243) included in the study.
| Total | n =243 |
|---|---|
|
| |
| Females, n (%) | 141 (58) |
|
| |
| Age (years), median (IQR) | 44 (34-56) |
|
| |
| Caucasian ethnicity, n (%) | 235 (96.7) |
|
| |
| BMI (kg/m2), median (IQR) | 25.1 (22.2-28.6) |
|
| |
| Smoking, n (%) | |
| Never | 123 (50.9) |
| Former | 41 (16.9) |
| Current | 78 (32.2) |
|
| |
| Age at diagnosis (years), median (IQR) | 28 (23-38) |
|
| |
| Disease duration (years), median (IQR) | 12 (7-19) |
|
| |
| Disease location (as per Montreal classification (18), n (%) | |
| L1 (ileal) | 57 (23.5) |
| L2 (colonic) | 51 (20.9) |
| L3 (ileocolonic) | 134 (55) |
| L4 (isolated upper digestive) | 1 (0.4) |
|
| |
| Disease behavior (as per Montreal classification (18), n (%) | |
| B1 (non stricturing, non penetrating) | 84 (34.6) |
| B2 (stricturing) | 72 (29.6) |
| B3 (penetrating) | 48 (19.8) |
| P (perianal disease) | 39 (16.1) |
|
| |
| CRS prior to study, n (%) | 175 (72) |
|
| |
| CRS during the study, n (%) | 102 (42) |
|
| |
| Psychiatrics co-morbidities, n (%) | 78 (32) |
|
| |
| LI1, median (IQR) | 8.3 (1.3-12.3) |
|
| |
| LI2, median (IQR) | 8.9 (2.5-20.6) |
|
| |
| DLI, median (IQR) | 0.4 (0-3.8) |
|
| |
| Months between LI1 and LI2, median (IQR) | 48 (42-55) |
|
| |
| 5y SIBDQ, median (IQR) | 50 (40-58) |
|
| |
| 5y HBI, median (IQR) | 4.2 (2-7.2) |
n: number of patients; IQR: interquartile range; BMI: Body Mass Index; CRS: Crohn's disease related surgery (both outpatient and inpatient); LI1: Lémann Index 1; LI2: Lémann index 2; DLI: Delta Lémann Index; SIBDQ: Short inflammatory bowel disease questionnaire; HBI: Harvey Bradshaw Index y: years
For the entire cohort, the median LI1 was 8.3 (IQR: 1.3-12.3), median LI2 was 8.9 (IQR: 2.5-20.6) and the median DLI was 0.4 (IQR: 0-3.8) (Table 1). The median interval between LI1 and LI2 was 48 months (IQR: 42-55). Regarding changes in DLI, majority of the patients in the cohort showed worsening gut destruction (53.5%) during the 5 years, which was mostly secondary to surgical resection, followed by development of ileal strictures or perianal fistulas; while 30.9% showed stable disease and 15.6% experienced improvement in bowel damage (Table 2).
Table 2. Demographic, clinical, biochemical, quality of life, healthcare utilization and treatment patterns across Crohn's disease phenotypes defined by Delta Lémann Index.
| Improving (A) DLI: < 0 |
Stable (B) DLI: 0 |
Worsening (C) DLI: >0 |
A vs B vs C P value |
A vs C P value |
B vs C P value |
|
|---|---|---|---|---|---|---|
|
| ||||||
| Patients, n (%) | 38 (15.6) | 75 (30.9) | 130 (53.5) | NA | NA | NA |
|
| ||||||
| Females, n (%) | 19 (50) | 46 (61.3) | 76 (58.5) | 0.509 | 0.36 | 0.768 |
|
| ||||||
| Age(y), median (IQR) | 43 (33-52) | 47 (37-61) | 44 (33-54) | 0.06 | 0.706 | 0.037 |
|
| ||||||
| BMI (kg/m2), median (IQR) | 24.2 (22.7- 28.1) | 26.1 (22.9-30.1) | 25.2 (21.5-28.1) | 0.166 | .919 | 0.071 |
|
| ||||||
| Smokers, n (%) | 0.368 | 0.239 | 0.440 | |||
| Never | 22 (57.9) | 41 (54.7) | 60 (46.5) | |||
| Former | 3 (7.9) | 14 (18.7) | 24 (18.6) | |||
| Current | 13 (34.2) | 20 (26.7) | 45 (34.9) | |||
|
| ||||||
| Age at diagnosis (y), median (IQR) | 28.5 (22.5-38.5) | 28 (24-35) | 28.5 (22-40) | 0.898 | 0.956 | 0.648 |
|
| ||||||
| Disease duration (y), median (IQR) | 10.5 (4.5-16) | 13 (8-26) | 10 (6-18) | 0.029 | 0.547 | 0.021 |
|
| ||||||
| Disease location, n (%)(18) | ||||||
| L1 (ileal) | 5 (13.2) | 22 (29.3) | 30 (23.3) | 0.163 | 0.256 | 0.405 |
| L2 (colonic) | 15 (39.5) | 12 (16) | 24 (18.6) | 0.009 | 0.01 | 0.706 |
| L3 (ileocolonic) | 18 (47.4) | 41 (54.7) | 75 (57.7) | 0.556 | 0.354 | 0.770 |
| L4 (isolated upper digestive) | 0 | 0 | 1 (0.8) | N/A | N/A | N/A |
|
| ||||||
| Disease behavior, n (%)(18) | ||||||
| B1 (non stricturing, non penetrating) | 17 (44.7) | 37 (49.3) | 30 (23.1) | 0.002 | 0.023 | 0.001 |
| B2 (stricturing) | 11 (28.9) | 19 (25.3) | 42 (32.3) | 0.035 | 0.264 | 0.017 |
| B3 (penetrating) | 5 (13.2) | 13 (17.3) | 30 (23.1) | 0.242 | 0.836 | 0.250 |
| P (perianal disease) | 5 (13.2) | 6 (8) | 28 (21.5) | 0.014 | 0.671 | 0.015 |
|
| ||||||
| CRS prior to study, n (%) | 17 (44.7) | 49 (65.3) | 109 (83.8) | <0.001 | <0.001 | 0.003 |
|
| ||||||
| CRS during study, n (%) | 4 (10.5) | 12 (16) | 86 (66.2) | <0.001 | <0.001 | <0.001 |
|
| ||||||
| Psychiatrics co-morbidities, n (%) | 8 (21.1) | 19 (26.8) | 51 (40.8) | 0.029 | 0.034 | 0.063 |
|
| ||||||
| LI1, median (IQR) | 7.5 (2.3-10.5) | 8.3 (0-10.8) | 8.3 (1.3-12.3) | 0.357 | 0.903 | 0.156 |
|
| ||||||
| LI2, median (IQR) | 3.5 (0-8.3) | 8.3 (0-10.8) | 13.1 (8.3-31.7) | <0.001 | <0.001 | <0.001 |
|
| ||||||
| DLI, median (IQR) | -2.3 (-3.2 - -0.6) | 0 | 3.2 (1.2-8.8) | <0.001 | <0.001 | <0.001 |
|
| ||||||
| Months between LI1 and LI2, median (IQR) | 46.5 (40-54) | 47 (41-52) | 50 (43-56) | 0.095 | 0.193 | 0.041 |
|
| ||||||
| ESR elevation (/5y), median (IQR) | 1 (0-3) | 1 (0-2) | 1 (0-3) | 0.057 | 0.714 | 0.016 |
|
| ||||||
| CRP elevation (/5y), median (IQR) | 0.5 (0-2) | 0 (0-1) | 1 (0-2) | <0.001 | 0.03 | <0.001 |
|
| ||||||
| 5y SIBDQ, median (IQR) | 51.5 (44-61) | 53 (44-59) | 47 (39-57) | 0.036 | 0.047 | 0.034 |
|
| ||||||
| 5y HBI, median (IQR) |
3.9 (1.6-7.2) | 5.8 (2-6.2) | 4.8 (2.5-7.5) | 0.299 | 0.313 | 0.153 |
|
| ||||||
| IBD clinic visits, median (IQR) | 7 (5-13) | 6 (4-9) | 12 (7-19) | <0.001 | 0.006 | <0.001 |
|
| ||||||
| ED visits, median (IQR) |
0 (0-1) | 1 (0-2) | 2 (0-5) | 0.002 | 0.002 | 0.016 |
|
| ||||||
| Phone calls to IBD clinic, median (IQR) |
20 (12-28) | 18 (10-28.5) | 32 (15.5-52) | <0.001 | 0.012 | <0.001 |
|
| ||||||
| Hospitalizations, median (IQR) | 2 (1-3) | 1 (1-3) | 2 (1-4.5) | 0.104 | 0.561 | 0.036 |
|
| ||||||
| Steroid use (/5y), median (IQR) | 0 (0-2) | 0 (0-1) | 1 (0-3) | 0.001 | 0.114 | <0.001 |
|
| ||||||
| Immunomodulator use (/5y), median (IQR) | 1.5 (0-4) | 2 (0-5) | 2 (0-4) | 0.583 | 0.317 | 0.909 |
|
| ||||||
| Anti-TNF use (/5y), median (IQR) | 1.5 (0-4) | 0 (0-2) | 2 (0-3) | 0.009 | 0.818 | 0.002 |
|
| ||||||
| Anti-depressant use (/5y), median (IQR) | 0 (0-2) | 0 (0-1) | 0 (0-1) | 0.586 | 0.547 | 0.522 |
|
| ||||||
| Opioid use (/5y), median (IQR) | 0 (0-1) | 0 (0-2) | 1 (0-2) | 0.049 | 0.041 | 0.065 |
n: Number of patients; IQR: Interquartile range; BMI: Body Mass Index; CRS: Crohn's disease related surgery (both outpatient and inpatient); LI1: Lémann Index 1; LI2: Lémann index 2; DLI: Delta Lémann Index; ESR: Erythrocyte sedimentation rate; CRP: C-reactive protein; SIBDQ: Short inflammatory bowel disease questionnaire; HBI: Harvey Bradshaw Index; IBD: Inflammatory bowel disease; ED: Emergency department; TNF: Tumor necrosis factor; y: years; NA: Not applicable
Subgroup analysis
There was no significant difference with regards to gender, age, body mass index (BMI), smoking status or age at diagnosis across the DLI trajectories (Table 2). Disease duration was longer in the stable damage group (p=0.029). Features of disease location such as colonic involvement alone, showed significant differences across the groups (p=0.042). Non-stricturing non-penetrating phenotype was less common among the worsening disease group (p=0.002). Worsening disease group was more likely to have stricturing disease (p=0.035) and perianal involvement (p=0.014). They also had significantly higher CD related surgical exposure both prior and during the study (for both comparisons, p<0.001). This subset of patients suffered from psychiatric co-morbidities more frequently as well (p=0.029). LI1 showed no significant variation across the groups (p=0.357), however LI2 and DLI were significantly higher in the worsening disease phenotype (p<0.001 for both parameters). The duration across which DLI was calculated was not different across the groups (p=0.095), however on individual comparison between the stable and worsening group, this duration was noted to be significantly higher in the latter (p=0.042). Further comparison of characteristics between the stable and worsening groups was performed after adjusting for this variation in interval between the two LI assessments. Detailed results of the comparison of individual groups are listed in Table 2.
CRP elevation showed significant variability (p<0.001) with more frequent elevations noted in patients in the worsening group and the variation in elevation in ESR also showed a trend towards significance (p=0.057). Median 5y HBI scores were not different across the groups (p=0.299), however patients in the worsening trajectory had significantly lower median 5y SIBDQ scores (p=0.036). Patients with worsening trajectory had greater number of phone calls and visits to the IBD clinic (p<0.001 for both) and the ED (p=0.002); however comparison of hospitalizations showed no significant difference (p=0.104). The frequency of steroid (p=0.001), anti-TNF (p=0.009) and opioid (p=0.049) agent use was significantly higher in the worsening subset. However, use of immunomodulators (p=0.583) and anti-depressants (p=0.586) did not show significant variation.
Financial Data
Healthcare charges for the 243 study patients between 2009 and 2013 totaled $56,523,835 with median charge of $116,838 (IQR: $45,643 – $240,398) per patient. Expenditure patterns were markedly skewed with 53.5% of the cohort (patients with DLI>0) accounting for 77.5% of the total cost burden and this trend was noted for all categories of charges (Table 3 and Figure 1). While the median 5y charges were largely comparable at $73,698 and $68,244 for patients in the improving and stable groups (p=0.796), it was markedly higher at $187,579 in patients of the worsening group (p<0.001 for comparison with each of the other trajectories). For the cohort, hospitalization and anti-TNF agent use accounted for 67% and 15.2% of the total charges, respectively. There was a trend of increase in proportion of charges accounted for by hospitalizations across the three trajectories (improving vs stable vs worsening: 45.4% vs. 51.7% vs. 72%) and a corresponding decrease in the share of expenses attributed to anti-TNF therapy (improving vs. stable vs. worsening: 34.4% vs. 22% vs. 12%). Proportion of expenditure attributed to surgeries (both outpatient and inpatient) were delineated and were found to be 10% for the entire cohort and showed a trend for increase across the three groups (improving vs. stable vs. worsening: 4% vs. 6.4% vs. 10.7%) as seen in Figure 2. Multivariate linear regression analysis showed independent significant positive correlation of log transformed total 5y healthcare expenditure with LI2 (Coefficient=0.01, p=0.001) and DLI (Coefficient=0.014, p=0.001), and negative correlation with age (Coefficient=-0.007, p=0.029) and 5y SIBDQ (Coefficient=-0.007, p=0.024) (Table 4). Also log transformed total 5y surgical expenditure showed significant positive correlation with DLI (Coefficient=0.019, p<0.001), IBD clinic visits (Coefficient=0.013, p=0.02), hospitalizations (Coefficient=0.062, p<0.001) and narcotic use (Coefficient=0.069, p=0.033) and negative correlation with telephone calls to the IBD clinic (Coefficient=-0.004, p=0.004).
Table 3. Five year healthcare expenditure patterns (all values in USD) across Crohn's disease phenotypes defined by Delta Lémann Index.
| Improving (A) DLI: < 0 |
Stable (B) DLI: 0 |
Worsening (C) DLI: >0 |
A vs B vs C P value |
A vs C P value |
B vs C P value |
|
|---|---|---|---|---|---|---|
|
| ||||||
| Total financial charges | 4,318,374.95 | 8,410,712.3 | 43,794,747.75 | <0.001 | <0.001 | <0.001 |
|
| ||||||
| Median financial charges (5y) | 73,698 (35,161-131,214.6) | 68,244.2 (26,118-129,469.1) | 187,579.3 (87,688.9- 312,902.4) | <0.001 | <0.001 | <0.001 |
|
| ||||||
| Inpatient care& | 0 (0-32,806.3) | 0 (0-51,631.8) | 104,773 (69,503-215,028.8) | <0.001 | <0.001 | <0.001 |
|
| ||||||
| Inpatient Surgery | 0 (0-1640) | 0 (0-2284) | 7225 (0-13911) | <0.001 | <0.001 | <0.001 |
|
| ||||||
| Professional charges& | 19,157 (10,316-25,340) | 19,505 (12,140-30,603) | 34,281.2 (21,616-58,354) | <0.001 | <0.001 | <0.001 |
| Outpatient care^ | 2,236 (1,520-3,966) | 2,851 (1,340-5,499) | 3,787 (2,395-6,130) | 0.006 | 0.006 | <0.015 |
| ED care^ | 270 (0-446) | 446 (0-1,222) | 776 (0-1,998) | 0.006 | 0.785 | 0.024 |
| Radiology | 714 (233-2,164) | 1,292 (197-2,711) | 1,571 (639-4,203) | 0.002 | 0.002 | 0.012 |
| Endoscopy | 6,250 (4,961-10,125) | 6,409 (4,731-8,441) | 7,097 (4,848-9,803) | 0.001 | 0.785 | 0.121 |
| Outpatient surgery | 0 (0-1,221) | 876 (0-5,619) | 10,842 (855-23,780) | <0.001 | <0.001 | <0.001 |
| Miscellaneous^^ | 23,256.5 (12,555-30,919.58) | 25,409 (16,058.2-39,357) | 40,530.8 (25,298-67,702.4) | <0.001 | <0.001 | <0.001 |
|
| ||||||
| Outpatient immunomodulator therapy& | 138.9 (0-704.3) | 281.7 (0-704.3) | 281.7 (0-704.3) | 0.525 | 0.336 | 0.682 |
|
| ||||||
| Outpatient anti-TNF therapy& | 28,448 (0-83,478) | 0 (0-44,591) | 34,609 (0-66,886.6 | 0.005 | 0.637 | <0.001 |
For Kruskal walis test across 3 groups,
For Mann Whitney U test between group A and C,
For Mann Whitney U test between group B and C
USD: US dollars; DLI: Delta Lémann Index; ED: Emergency department; TNF: Tumor necrosis factor
Sum of these parameters constitute total financial charges
Charges listed have overlap with radiology, endoscopy, outpatient surgery and miscellaneous sections
Laboratory + Pathology+ Vaccination
Figure 1. Charges incurred in common healthcare utilization domains across Crohn's disease trajectories defined by Delta Lémann Index (All amounts in USD).
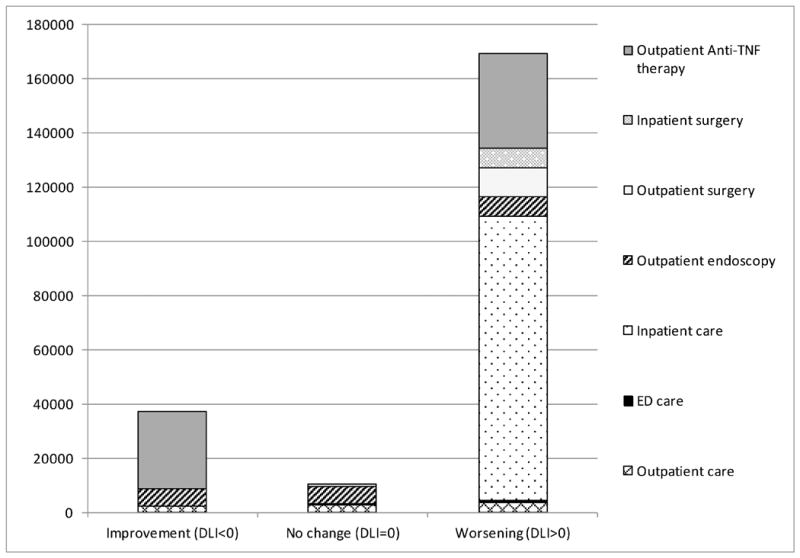
ED: Emergency department; TNF: Tumor necrosis factor; USD: United States Dollar
Figure 2. Percentage of total healthcare expenditure attributed to professional services, inpatient care and medications for (a) entire study cohort and (b,c and d) each Delta Lémann Index based subset.
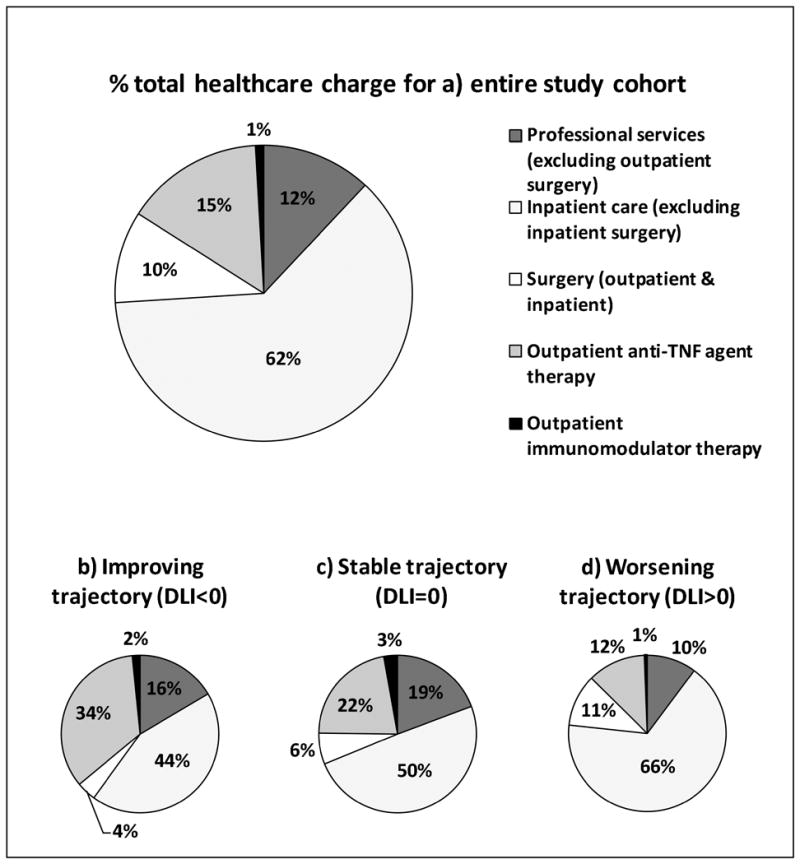
TNF: Tumor necrosis factor; DLI: Delta Lémann Index
Table 4. Determinants of cumulative healthcare expenditure in patients with Crohn's disease based on the multivariate linear regression analysis.
| Independent variables | Coefficient | (95% CI) | P value |
|---|---|---|---|
| Age (y) | -0.007 | -0.013 - -0.001 | 0.029 |
| Age at diagnosis (y) | 0.005 | -0.001 – 0.012 | 0.127 |
| CRS prior to study | 0.058 | -0.111 – 0.227 | 0.499 |
| LI2 | 0.01 | 0.004 – 0.0158 | 0.001 |
| DLI | 0.014 | 0.006 – 0.022 | 0.001 |
| ESR elevation (/5y) | 0.011 | -0.037 – 0.599 | 0.645 |
| CRP elevation (/5y) | 0.023 | -0.033 – 0.080 | 0.412 |
| 5y SIBDQ | -0.007 | -0.014 - -0.001 | 0.024 |
| 5y HBI | 0.01 | -0.007 – 0.027 | 0.242 |
| Phone calls to IBD clinic | 0.001 | -0.001 – 0.004 | 0.175 |
| Psychiatric co-morbidities | 0.068 | -0.072 – 0.209 | 0.335 |
y: years; CRS: Crohn's disease related surgery (both outpatient and inpatient); LI2: Lémann index 2; DLI: Delta Lémann Index; CRP: C-reactive protein; SIBDQ: Short inflammatory bowel disease questionnaire; HBI: Harvey Bradhsaw Index; IBD: Inflammatory bowel disease
Discussion
In this study we found that CD exacted a significant medical financial burden over five years, which was largely secondary to hospitalizations and advanced medical therapies. CD patients with the aggressive LI phenotype showed significantly greater healthcare utilization and correspondingly incurred a disproportionately higher financial charge burden compared to the rest of the cohort. Healthcare expenditure is independently associated with DLI.
CD is a progressive inflammatory disease state and development of complications such as fibrostenotic stricture or penetrating lesions (fistula and abscess) of the bowel requiring surgical management is frequent. Nearly half of the CD patients require surgery within 10 years from diagnosis and the cumulative incidence of first, second and third procedures is as high as 60%, 48% and 54% at 20 years after diagnosis;(22) thus amounting to significant healthcare burden. This is reflected in the financial burden from the disease, which in the United States has been estimated at $10.9-15.5 billion per year.(7)
Given the heterogeneity in disease course and complications, the financial burden from CD is known to be skewed. Previous studies have suggested that the upper quartile of costs accounted for 80% of the total financial expenses.(10) In our prior five year analysis of 1600 patients with IBD, 54.8% (n=876) of whom had CD, a subset of 9% of patients were found to account for 51.2% of the five year cumulative financial charges for the entire cohort.(17) With the rising cost of healthcare in the US, there is now a mounting interest to identify these high utilizers so that interventions to improve co-ordination of care and preventive care for them maybe tailored and better enforced. (23)
Several studies have highlighted disease characteristics associated with high expenditures which have included presence of co-morbid medical and psychiatric conditions, higher disease activity scores & elevated inflammatory biomarkers, worse health related quality of life scores, higher healthcare utilization, need for chronic steroid or immunosuppressive drug therapy and surgical procedures.(9, 10, 17) While these studies define conditions associated with high expenditures, it does not provide a means of delineating these high utilizing groups. This need for identifying the high utilizers with the aggressive disease course is also important in the realm of changing therapeutic strategies in CD. There is now a growing consensus that the focus in management of CD should shift from symptom and inflammation control to pre-emptively preventing organ damage and minimizing long term sequelae to attempt to alter disease course. This would warrant the early use of expensive anti-TNF therapy and Lémann Index trajectory could serve as a primary outcome tool in the assessment of efficacy of such novel therapeutic strategies.
While there is still debate regarding the content validity, inter rater reliability, ideal diagnostic modality for index calculation and efficient and effective incorporation of LI into clinical practice, LI has been shown to reflect disease course and shows worsening with persistent clinical activity (24) and improvement with anti-TNF therapy.(25) Change in LI or DLI has been demonstrated to be a useful tool to chart CD trajectory and segregate heterogeneous disease phenotypes.(5, 6) Stratification of our study cohort based on DLI showed that more often patients showed worsening (53.5%) or stable bowel damage (30.9%), with a smaller fraction showing improvement in LI (15.6%). Also, a significant share of patients (42%) underwent CD related surgery during the 5y study period which could potentially be explained by two factors; firstly given that this registry is housed at a tertiary level digestive disease center our patient population is more often sicker than the usual general IBD population and secondly since patients who undergo surgery are more likely to undergo multiple sets of diagnostic testing, their likelihood of inclusion in the study is increased.
Despite the shorter duration of CD in the worsening group, a significantly greater proportion of the patients showed a stricturing phenotype or had perianal involvement and had undergone CD related surgery prior to the study period, thus suggestive of a more aggressive disease course. In addition, they also suffered from psychiatric co-morbidities more frequently; which merit the closer attention of our therapeutic interventions, since they stem from or result in an inability to cope and eventually influence healthcare utilization and expenditure. During the 5y observation period, this aggressive disease group demonstrated significantly higher disease activity (more frequent elevation of CRP), greater healthcare utilization (more IBD clinic visits and phone calls and ED visits), greater need for aggressive medical therapies (steroid, anti-TNF agent use and surgery) and worse quality of life (lower SIBDQ scores) compared to the rest of the cohort. Surprisingly, the variability in ESR elevation and HBI scores was not significantly different across the groups and may reflect on the performance and limitations of these metrics as disease activity assessment tools in CD patients; however more studies with larger study populations would be required to investigate these patterns further. Interestingly the use of steroids and anti-TNF agents was comparable in both the extreme phenotypes, suggestive of a similar inflammatory course in both trajectories, but with varied response to treatment.
Upon comparing the stable and worsening trajectory it's noted that the patients in the former were older, more likely to have non-stricturing non-penetrating disease behavior, longer disease duration, lower frequency of inflammatory biomarker elevation, less healthcare utilization (IBD clinic, ED visits and hospitalizations) and need for steroids and anti-TNF agents; which provides further evidence for minimal underlying inflammatory activity and disease stability in this subset of patients.
The median annual healthcare expenditure per patient for our cohort was $23,368, which is comparable to prior population estimates of $25,282-$26,192. However, on subgroup analysis we noted that improving ($14,739.6) and stable ($13,648.84) disease groups had lower median charges, while the median for the worsening disease group was notably higher ($37,515.86). As expected, healthcare expenditure mirrored the pattern of utilization across each trajectory. Patients with bowel damage deterioration incurred disproportionately greater expenses on all fronts compared to the rest of the cohort. The only expense domain where the three groups were comparable was charges for immunomodulators, which is not surprising given that their use was similar in all groups. Although number of hospitalizations was not significantly different across the groups, inpatient charges were markedly higher in the worsening group due to greater frequency of inpatient diagnostic tests and procedures. Expenses for patients in improving and stable groups were largely comparable, except for surgical charges which were significantly higher in the latter (p=0.021) given that a greater fraction of these patients underwent CD related surgery during the study (16.0% vs 10.6%). Results of the regression analysis suggest that higher total 5y financial charges are associated with higher LI2 and DLI and lower 5y SIBDQ scores.
This study has several strengths. First, the prospective monitoring of the cohort for five years allows for temporal variation in disease activity to assess longitudinal patterns of disease burden. Second, availability of in-depth analysis of disease characteristics and health care expenditure patterns allows correlation between disease activity and financial burden and identification of specific areas of utilization which may benefit from cost reducing interventions. Third, the evaluation of total healthcare expenditure, rather than gastrointestinal care related expenses alone gives a holistic perspective of the disease and its impact on various aspects of a patient's well-being, and may reveal noteworthy associations on further analysis in future studies.
Our study is not without limitations. First, total financial burden was restricted to healthcare services at our hospital system. As financial charges vary between institutions, the generalizability of our results may be limited. Also, we were unable to assess healthcare obtained at centers apart from our own, thus potentially under-accounting the utilization and charge patterns of the cohort. Secondly, several traits of the Lemann Index are still under debate, with some of them being - ideal diagnostic modality for index calculation, consistency across evaluators and time efficiency for calculation. The limitations that arise with calculating LI retrospectively have been elucidated in detail in our prior studies (5, 6) and would apply to the current study as well, which include shortcomings such as non-protocolized diagnostic testing and use of variable combination of tests for index calculation, which might both affect precision of scores; hence we chose to focus on the trend in index values over time rather than absolute values and this reflects a practical incorporation of this tool and a real world analysis of the disease course in these patients. Third, baseline characteristics of the study cohort showed highly variable disease duration and phenotypes; which are well known to influence the likelihood of development of complications, thus potentially impacting LI (1, 2, 26) as well as healthcare utilization, and hence we only chose to focus on change in damage and its association with health status during the study period.
In conclusion, care of patients with CD constitutes a significant medical financial burden with a subpopulation of patients accounting for disproportionately high expenditure. Delta Lémann Index is a useful tool for distinguishing clinically distinct and meaningful CD phenotypes. We demonstrate that it is also useful to reveal and characterize the disparity in healthcare expenses in these patients. Further research should focus on patients in the worsening LI trajectories who suffer the most aggressive disease patterns and represent the highest utilizers of the healthcare system.
Acknowledgments
Grant Support: Benjamin Click reports support from National Institute of Health training grant 5T32DK063922-12 (PI: David Whitcomb, MD PhD). Ioannis Koutroubakis reports support by a sabbatical salary of Medical Faculty University of Crete, Greece. David G. Binion and Michael A. Dunn report support from Grant W81XWH-11-2-0133 from the US Army Medical Research and Materiel Command.
Disclosure of funding received for this work: None
References
- 1.Peyrin-Biroulet L, Loftus EV, Jr, Colombel JF, et al. The natural history of adult Crohn's disease in population-based cohorts. Am J Gastroenterol. 2010;105:289–297. doi: 10.1038/ajg.2009.579. [DOI] [PubMed] [Google Scholar]
- 2.Louis E, Collard A, Oger AF, et al. Behaviour of Crohn's disease according to the Vienna classification: changing pattern over the course of the disease. Gut. 2001;49:777–782. doi: 10.1136/gut.49.6.777. [DOI] [PMC free article] [PubMed] [Google Scholar]
- 3.Pariente B, Cosnes J, Danese S, et al. Development of the Crohn's disease digestive damage score, the Lemann score. Inflammatory bowel diseases. 2011;17:1415–1422. doi: 10.1002/ibd.21506. [DOI] [PMC free article] [PubMed] [Google Scholar]
- 4.Pariente B, Mary JY, Danese S, et al. Development of the lemann index to assess digestive tract damage in patients with Crohn's disease. Gastroenterology. 2015;148:52–63 e53. doi: 10.1053/j.gastro.2014.09.015. [DOI] [PubMed] [Google Scholar]
- 5.Bhagya Rao B, Koutroubakis IE, Ramos Rivers C, et al. Delineation of Crohn's Disease Trajectories Using Change in Lemann Index: A Natural History Study. Journal of clinical gastroenterology. 2016;50:476–482. doi: 10.1097/MCG.0000000000000463. [DOI] [PubMed] [Google Scholar]
- 6.Bhagya Rao B, Koutroubakis IE, Rivers CR, et al. Correlation of anemia status with worsening bowel damage as measured by Lemann Index in patients with Crohn's disease. Digestive and liver disease : official journal of the Italian Society of Gastroenterology and the Italian Association for the Study of the Liver. 2016;48:626–631. doi: 10.1016/j.dld.2016.02.020. [DOI] [PubMed] [Google Scholar]
- 7.Yu AP, Cabanilla LA, Wu EQ, et al. The costs of Crohn's disease in the United States and other Western countries: a systematic review. Current medical research and opinion. 2008;24:319–328. doi: 10.1185/030079908x260790. [DOI] [PubMed] [Google Scholar]
- 8.Cohen RD, Larson LR, Roth JM, et al. The cost of hospitalization in Crohn's disease. Am J Gastroenterol. 2000;95:524–530. doi: 10.1111/j.1572-0241.2000.01779.x. [DOI] [PubMed] [Google Scholar]
- 9.Silverstein MD, Loftus EV, Sandborn WJ, et al. Clinical course and costs of care for Crohn's disease: Markov model analysis of a population-based cohort. Gastroenterology. 1999;117:49–57. doi: 10.1016/s0016-5085(99)70549-4. [DOI] [PubMed] [Google Scholar]
- 10.Feagan BG, Vreeland MG, Larson LR, et al. Annual cost of care for Crohn's disease: a payor perspective. Am J Gastroenterol. 2000;95:1955–1960. doi: 10.1111/j.1572-0241.2000.02261.x. [DOI] [PubMed] [Google Scholar]
- 11.Hay JW, Hay AR. Inflammatory bowel disease: costs-of-illness. Journal of clinical gastroenterology. 1992;14:309–317. doi: 10.1097/00004836-199206000-00009. [DOI] [PubMed] [Google Scholar]
- 12.van der Valk ME, Mangen MJ, Leenders M, et al. Healthcare costs of inflammatory bowel disease have shifted from hospitalisation and surgery towards anti-TNFalpha therapy: results from the COIN study. Gut. 2014;63:72–79. doi: 10.1136/gutjnl-2012-303376. [DOI] [PubMed] [Google Scholar]
- 13.Foundation RWJ. Super-utilizer summit: common themes from innovative complex care management programs. Available at: http://wwwrwjforg/en/library/research/2013/10/super-utilizer-summithtml.
- 14.Hempstead K, Delia D, Cantor JC, et al. The fragmentation of hospital use among a cohort of high utilizers: implications for emerging care coordination strategies for patients with multiple chronic conditions. Medical care. 2014;52(Suppl 3):S67–74. doi: 10.1097/MLR.0000000000000049. [DOI] [PubMed] [Google Scholar]
- 15.Mautner DB, Pang H, Brenner JC, et al. Generating hypotheses about care needs of high utilizers: lessons from patient interviews. Population health management. 2013;16(Suppl 1):S26–33. doi: 10.1089/pop.2013.0033. [DOI] [PubMed] [Google Scholar]
- 16.Gawande A. The hot spotters: can we lower medical costs by giving the neediest patients better care? New Yorker (New York, NY : 1925. 2011:40–51. [PubMed] [Google Scholar]
- 17.Click B, Ramos Rivers C, Koutroubakis IE, et al. Demographic and Clinical Predictors of High Healthcare Use in Patients with Inflammatory Bowel Disease. Inflammatory bowel diseases. 2016;22:1442–1449. doi: 10.1097/MIB.0000000000000763. [DOI] [PMC free article] [PubMed] [Google Scholar]
- 18.Silverberg MS, Satsangi J, Ahmad T, et al. Toward an integrated clinical, molecular and serological classification of inflammatory bowel disease: report of a Working Party of the 2005 Montreal World Congress of Gastroenterology. Canadian journal of gastroenterology = Journal canadien de gastroenterologie. 2005;19(Suppl A):5A–36A. doi: 10.1155/2005/269076. [DOI] [PubMed] [Google Scholar]
- 19.Harvey RF, Bradshaw JM. A simple index of Crohn's-disease activity. Lancet (London, England) 1980;1:514. doi: 10.1016/s0140-6736(80)92767-1. [DOI] [PubMed] [Google Scholar]
- 20.Irvine EJ, Zhou Q, Thompson AK. The Short Inflammatory Bowel Disease Questionnaire: a quality of life instrument for community physicians managing inflammatory bowel disease. CCRPT Investigators. Canadian Crohn's Relapse Prevention Trial. Am J Gastroenterol. 1996;91:1571–1578. [PubMed] [Google Scholar]
- 21.Jiang J, Click B, Anderson AM, et al. Group-Based Trajectory Modeling of Healthcare Financial Charges in Inflammatory Bowel Disease: A Comprehensive Phenotype. Clinical and translational gastroenterology. 2016;7:e181. doi: 10.1038/ctg.2016.39. [DOI] [PMC free article] [PubMed] [Google Scholar]
- 22.Dhillon SLLEJ, Tremaine WJ, et al. The natural history of surgery for Crohns disease in a population-based cohort from Olmsted County, Minnesota (Abstract 825) Am J Gastroenterol. 2005;100:S305. [Google Scholar]
- 23.Mulder BJ, Tzeng HM, Vecchioni ND. Preventing avoidable rehospitalizations by understanding the characteristics of “frequent fliers”. Journal of nursing care quality. 2012;27:77–82. doi: 10.1097/NCQ.0b013e318229fddc. [DOI] [PubMed] [Google Scholar]
- 24.Gilletta C, Lewin M, Bourrier A, et al. Changes in the Lemann Index Values During the First Years of Crohn's Disease. Clinical gastroenterology and hepatology : the official clinical practice journal of the American Gastroenterological Association. 2015;13:1633–1640 e1633. doi: 10.1016/j.cgh.2015.02.041. [DOI] [PubMed] [Google Scholar]
- 25.Fiorino G, Bonifacio C, Peyrin-Biroulet L, et al. Prospective comparison of computed tomography enterography and magnetic resonance enterography for assessment of disease activity and complications in ileocolonic Crohn's disease. Inflammatory bowel diseases. 2011;17:1073–1080. doi: 10.1002/ibd.21533. [DOI] [PubMed] [Google Scholar]
- 26.Thia KT, Sandborn WJ, Harmsen WS, et al. Risk factors associated with progression to intestinal complications of Crohn's disease in a population-based cohort. Gastroenterology. 2010;139:1147–1155. doi: 10.1053/j.gastro.2010.06.070. [DOI] [PMC free article] [PubMed] [Google Scholar]