Abstract
In this study, we developed a computational framework to investigate the impact of leaflet geometry of a transcatheter aortic valve (TAV) on the leaflet stress distribution, aiming at optimizing TAV leaflet design to reduce its peak stress. Utilizing a generic TAV model developed previously [Li and Sun, Annals of Biomedical Engineering, 2010. 38(8): 2690-2701], we first parametrized the 2D leaflet geometry by mathematical equations, then by perturbing the parameters of the equations, we could automatically generate a new leaflet design, remesh the 2D leaflet model and generate a 3D leaflet model from the 2D design via a Python script. Approximately 500 different leaflet designs were investigated by simulating TAV closure under the nominal circular deployment and physiological loading conditions. From the simulation results, we identified a new leaflet design that could reduce the previously reported valve peak stress by about 5%. The parametric analysis also revealed that increasing the free edge width had the highest overall impact on decreasing the peak stress. A similar computational analysis was further performed for a TAV deployed in an abnormal, asymmetric elliptical configuration. We found that a minimal free edge height of 0.46 mm should be adopted to prevent central backflow leakage. This increase of the free edge height resulted in an increase of the leaflet peak stress. Furthermore, the parametric study revealed a complex response surface for the impact of the leaflet geometric parameters on the peak stress, underscoring the importance of performing a numerical optimization to obtain the optimal TAV leaflet design.
Keywords: Heart valve biomechanics, Optimization analysis, Finite element analysis, Transcatheter aortic valve implantation, Aortic stenosis
INTRODUCTION
Since the first procedure in 2002 [1], there have been more than 150,000 transcatheter aortic valve (TAV) implantations worldwide [2, 3]. The results of several large multicenter registries [4-12], and the randomized PARTNER trails [6, 7, 13] have provided definitive data confirming this treatment as an alternative to the standard surgical aortic valve replacement in inoperable and high-risk aortic stenosis (AS) patients. Currently, TAV implantation is considered as an established technique for the treatment of patients with severe symptomatic AS. In addition, there has been a recent trend toward a more extensive use of TAV devices in patients with an intermediate to high-risk profile [14]. Although significant experience has been gained and outcomes of TAV implantations are encouraging with a 3-year survival rate of 71.6% [15], various periprocedural complications such as acute kidney injury, vascular complications, pacemaker implantation, paravalvular regurgitation, and major bleeding have been reported [4, 12, 15-17]. Furthermore, due to more constraints on TAV leaflets [18], the long-term durability and safety of TAV devices need to be evaluated and studied carefully [19-21].
Interestingly, most of the TAV devices are fabricated from either bovine pericardium (BP) [19] or porcine pericardium (PP) [11] tissues. However, surgical pericardial valves have limited durability. Of the surgical pericardial valves available in the U.S., one pericardial valve, the Carpentier-Edwards PERIMOUNT (CEP) valve, stands out with clinically proven long-term durability. During the 1980s, there were other surgical pericardial valves, but they were discontinued due to their dismal long-term performances and high failure rates. One of them was the Ionescu-Shiley (IS) valve (distributed between 1976 and 1987 by Shiley Inc, Irvine, CA), and another was the Hancock pericardial xenograft valve (by Hancock Laboratory in Irvine, CA). Failures of IS [22-24] and Hancock [25-28] were extensively reported from 1984 through 1991. The most distressing and primary causes of valve failures reported of both IS and Hancock pericardial valves were early cusp wear and tear near the commissural regions where the leaflets were sewn to the supporting frame. The lack of frame flexure at the commissural regions was also thought to play a role in the accelerated fatigue damage of the leaflets. Note that failures of IS and Hancock pericardial valves were mostly reported 3-6 years after implantation.
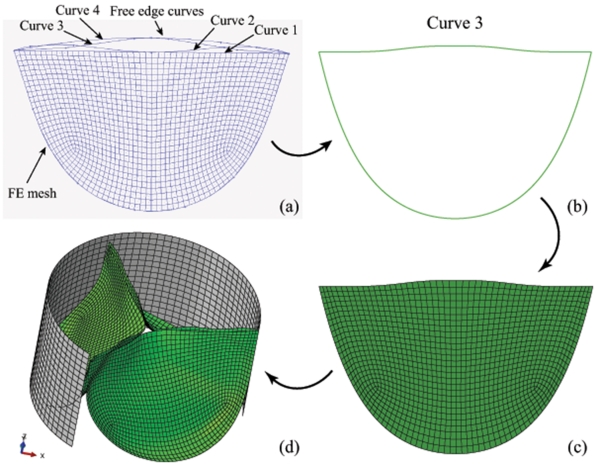
Studies have shown that the regions of tear in bioprosthetic heart valve (BHV) correlate with the regions of high tensile and bending stresses [29, 30]. Stress concentrations within the leaflet can either directly accelerate tissue structural fatigue damage or initiate calcification by causing structural disintegration, thereby enabling multiple calcification pathways that lead to valve failure [31, 32]. Although details of the process are unclear, it is widely accepted that valve designs which reduce leaflet stress are likely to provide improved long-term durability [33]. Because TAVs must be crimped into a small diameter catheter for delivery and deployment, they are subject to additional design constraints compared to traditional surgical BHVs, such as thinner leaflets and lack of valve stent-tip deflection, which may further impede its long-term durability. Our previous study indicated that TAV leaflet peak stress is up to 38% higher than in a surgical BHV [34] due to these constraints [18, 35]. Furthermore, the presence of aortic root and valve calcification may result in elliptical TAV deployment, which has been shown to further increase leaflet stress and may lead to central backflow leakage [35, 36]. To mitigate the high leaflet stress and prevent the central backflow leakage of TAVs, one option is to adjust the 2D leaflet design. Several different leaflet free edge curves, shown in Fig. 1(a), have been proposed [35]; however, the exact impact of various 2D leaflet shapes is unknown.
Figure 1.
The 2D leaflet geometry used to generate 3D TAV model: (a) the alternative designs of 2D TAV leaflet, (b) new 2D leaflet geometry based on curve 3, (c) remeshed 2D leaflet model, and (d) constructed 3D TAV model with “stent” (2/3 model shown).
In this study we present a computational framework to investigate the impact of 2D leaflet geometry on TAV peak stress in both circular and elliptical configurations. The computational analysis was initiated with the parameterization of the 2D TAV leaflet geometry, allowing for various perturbations of the leaflet design to be automatically generated. Then, each 2D leaflet design was virtually assembled into a 3D TAV model through FE simulations, and valve closure deformation of the 3D TAV under a transvalvular pressure of 120 mmHg was simulated. The peak leaflet stress was obtained for a parametric analysis of about 500 different leaflet designs. The entire computational analysis was carried out automatically by using Python scripts which call the ABAQUS/Standard solver (Dassault Systèmes SIMULIA Corp., Johnston, RI, USA) within SIMULIA Isight (Dassault Systèmes SIMULIA Corp., Johnston, RI, USA).
MATERIALS AND METHODS
Virtual Assembly of a Heart Valve in FE simulation
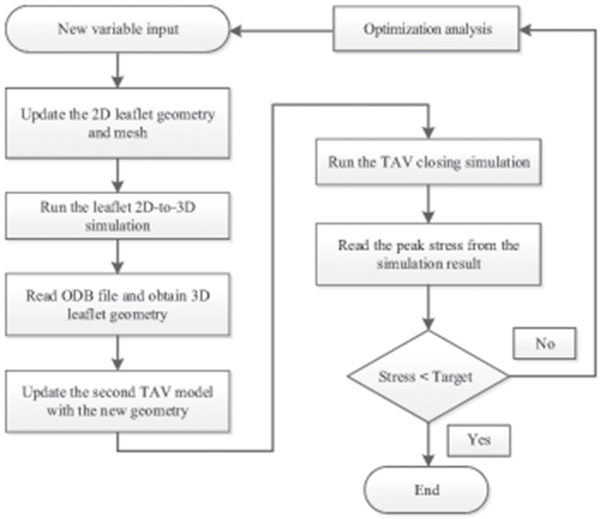
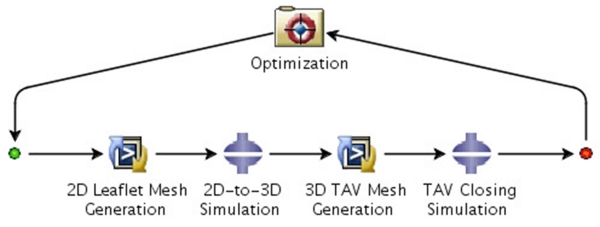
Pericardial tissue valves are fabricated from a flat sheet of chemically-treated bovine or porcine pericardial tissue. The fabrication process typically starts with a die-cut, or more recently a laser-cut, of flat tissue into a 2D leaflet shape. A valve assembler carefully stitches three identical flat leaflets onto a cylindrical stent using sutures. This valve fabrication process can be approximated in computational simulations by generating 2D FE models of the flat leaflets, and mimicking the sewing process by applying loading and displacement boundary conditions to virtually mount the leaflets to the specific locations on the stent. Thus, a 3D FE model of a tissue valve can be automatically generated, and the valve leaflet peak stress can be investigated. In current study, this virtual assembly process of a TAV model is repeated automatically for 500 different valve leaflet designs. Therefore, it is essential to use mathematical equations to describe, i.e., parameterization of, the 2D valve leaflet geometry. Illustrated in Fig. 2 is a flowchart of the overall design of the study. The details of the key steps of the study are described in the following sections:
-
(1)
Parameterization of 2D TAV leaflet geometry.
-
(2)
Remeshing of 2D leaflet FE model.
-
(3)
Generation of 3D TAV leaflet FE model from 2D leaflet design.
-
(4)
Simulation of the 3D TAV closure.
-
(5)
Determination of the design space for all the variables.
-
(6)
Optimization of TAV leaflet design under circular configuration.
-
(7)
Optimization of TAV leaflet design under elliptical configuration.
-
(8)
Evaluation of effects of design variables on TAV peak stress.
Figure 2.
Flowchart for parametric study of TAV leaflet design.
Parameterization of 2D TAV Leaflet Geometry
In this study, we adopted a semilunar shaped 2D leaflet design, typical for TAVs, which was described in our previous studies [18, 35]. The 2D leaflet geometry consists of two boundary edges. One is the leaflet free edge; the other is the leaflet-stent attachment edge. The leaflet free and attachment edges were originally assigned as a straight line connecting two commissures and an exponential curve (half of the edge), respectively, in our previous studies [18, 35]. Curves 2–4 in Fig. 1(a) represent potential alternatives to the straight line free edge [35]. Here, we developed a novel equation to describe one half of the curve 3 as:
| (1) |
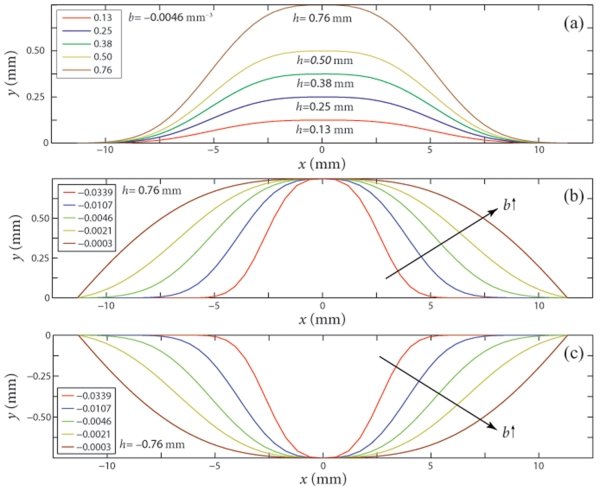
where h, b, u and m are coefficients. Note for one half of curve 3 the variable x (mm) should belong to x ∈ {x | u ≤ x ≤ m}. The parameters of Eq. (1) have the following physical characteristics: h (mm) denotes the height of the leaflet free edge, and the parameter b (mm−3) controls the overall width of the free edge in the circumferential direction. The parameters u (mm) and m (mm) denote the minimum and maximum values of variable x, respectively. The parameter h can also be negative which means the free edge is concave in shape, i.e., the free edge is below the straight line linking the two commissures.
Curve 3 of Fig. 1 was chosen for this study because the radially extended free edge may provide a better leaflet coaptation if the valve is deployed in an elliptical configuration. Due to the symmetry condition of the leaflet about the y-axis, only half of the leaflet needs to be determined by Eq. (1). We let the parameter u to be at the center of leaflet free edge, so u=0 mm, as shown in Fig. 3. Consequently, the total width of the leaflet free edge is determined by m only.
Figure 3.
Impact of design variables (a) h; (b) b for h > 0 and (c) b for h < 0 on the leaflet free edge shape. Note: u = 0 mm and m = 10.92 mm.
In this study, we also assumed that the arc length of the leaflet-stent attachment edge is a constant so that the new leaflet design could be “sutured” to the stent along the same path as the original design. Based on this assumption, the two end points of a new leaflet-stent attachment edge would determine the width of the leaflet free edge (m), i.e., m could not be a variable. Therefore, only h and b were chosen as the design variables to describe the free edge change in the study. The effects of design variables h and b on the leaflet free edge shape are shown in Fig. 3.
To parameterize half of the original leaflet-stent attachment edge, we developed the following exponential function,
| (2) |
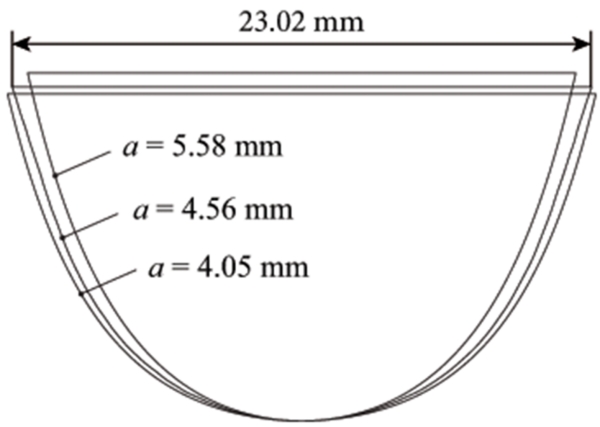
where a (mm) and c (mm−2) are coefficients, x (mm) is a variable. Since an increase in a or c in Eq. (2) leads to a simultaneous increase in ya, in this study we set c = 6.79 mm−2 which was determined based on the initial 2D leaflet design [18], only a was chosen as a design variable to describe the leaflet-stent attachment. An increase in variable a would reduce the width of the leaflet, as shown in Fig. 4. The arc length S of the leaflet attachment edge, described by Eq. (2), was computed by
| (3) |
where l and r denote the coordinates of the start and end points of the curve (half of the 2D leaflet-stent attachment edge) in the circumferential direction. The start point, l, is measured from the center point of the leaflet attachment edge (Fig. 4). The end point, r, at the leaflet commissure, was determined based on S. Since the arc length S was assumed to be a constant, once the end point was found, the coefficient m in Eq. (1) could be determined.
Figure 4.
Effect of design variable a on the leaflet attachment edge shape. Note: c = 6.79 mm−2 was used in this plot.
Remeshing of 2D Leaflet Model
The 2D leaflet geometry (one leaflet) was discretized into 1316 large strain shell elements (ABAQUS element S4R, a four-node quadrilateral finite strain element with reduced integration, and S3R, a 3-node triangular finite strain element with reduced integration) with constant thickness, as shown in Fig. 1(c). To accommodate the new leaflet edges, the mesh of the 2D leaflet model needs to be updated and remeshed. Here we kept the same node number and element connectivity for all leaflet models, thus, only the coordinates of the nodes near the leaflet edges were rearranged in order to maintain a relatively uniform element size. The remeshing of the 2D leaflet geometry was carried out by an ABAQUS Python script.
Generation of 3D TAV Geometry
With a new 2D leaflet mesh, the geometry of a 3D TAV model was virtually assembled automatically by FE simulations in ABAQUS (Fig. 2) via Python script. Briefly, the difference between the new 2D leaflet-stent attachment edge and the 3D stent suturing line was computed for each node in the same coordinate system. Then, displacement boundary conditions were applied at each node along the edge to translate the node to its corresponding position along the 3D stent suturing line. One leaflet model was first constructed in 3D, and the other two were then created by 120-degree symmetry. The new 3D leaflet geometry was used as an initial, undeformed configuration of the valve.
Material Properties of Leaflets and “Stent”
We have previously reported planar biaxial mechanical properties of thin bovine pericardial (BP) tissue [18] which were used in this study. A generalized Fung-type nonlinear anisotropic hyperelastic material model [37, 38] was utilized to characterize the mechanical behavior of thin BP:
| (4) |
where c and Ai, i = 1, 2, … 6, are material constants. For each material constant, the mean value of 10 specimens was determined, as listed in Table 1, and incorporated into the TAV FE models. The mean tissue thickness of 0.24 mm was adopted for the TAV leaflet based on our measurements [18].
Table 1.
Mean material constants of Fung-type hyperelastic model for thin bovine pericardium
| Parameters | c (kPa) | A 1 | A 2 | A 3 | A 4 | A 5 | A 6 |
|---|---|---|---|---|---|---|---|
| Mean | 16.27 | 66.73 | 34.52 | 1.29 | 24.09 | 0.77 | 0.53 |
The TAV “stent” was modeled as a circular cylindrical tube with a linear elastic material for the simulation of TAV in the elliptical configuration only. The Young’s modulus and Poisson’s ratio of the stent material are 200 GPa and 0.3, respectively.
Finite Element Modeling of TAV
The computational methods for modeling a TAV deployed in the circular [18] and elliptical configurations with various degrees of eccentricity [35] have been previously described. Briefly, to simulate a TAV in an elliptical configuration, we started with the circular TAV leaflet model mounted inside a circular cylindrical tube acting as the inner surface of the stent. The cylindrical tube was discretized with 1564 shell elements (S4R). All the nodes on the three leaflet attachment edges were constrained by using the “TIE” method in ABAQUS such that there were no relative translational displacements between the three attachment edges and the tube. An eccentricity of 0.5 was chosen in this study because it is representative of a typical elliptical TAV configuration [35]. To simulate the scenario which could cause valve central backflow leakage, the major axis of an elliptical TAV model was aligned with one of the three leaflet coaptation lines.
Boundary Conditions
The contact between each pair of leaflets was modeled by using the master-slave approach in ABAQUS [38] with the contact surfaces defined on the ventricular side of the leaflets. Since the material of the stent is much stiffer than the leaflets, the deformation of the stent was neglected for the circular TAV simulations. Thus, the stent model was not created for the circular scenario. Instead, all the nodes on the leaflet attachment edges were constrained in all three transitional degrees of freedom. However, for the elliptical configurations, the cylindrical tube was modeled and deformed to an eccentricity of 0.5 by using the displacement boundary conditions [35]. For both circular and elliptical configurations, a quasi-static approach [39] was utilized to analyze the deformation of the TAV from unloaded to the fully loaded state, achieved by applying a uniform transvalvular pressure of 120 mmHg to the aortic side of the leaflets.
Parametric Study of TAV in Circular and Elliptical Configurations
The computational parametric study (Fig. 2) was carried out by using the process automation and design optimization program Isight 5.7 and ABAQUS Python scripts as shown in Fig 5. The objectives were a) for TAV in the circular configuration, to minimize the peak maximum principal stress (MPS) on the leaflets, and b) for TAV in the elliptical configuration, to minimize the peak MPS on the leaflets within the design space, with the constraint that there was no gap at the leaflet coaptation areas when the valve is fully closed, i.e., no central backflow leakage.
Figure 5.
Isight workflow for computational analysis of TAV leaflet design.
The design space for each variable (b, h or a) was initially approximated through trial and error in MATLAB (The MathWorks, Inc., Natick, MA, USA) and then refined in Isight in order to optimize the objective function in a smaller space. Perturbations of the design variables were chosen so that the leaflet width and height could be adjusted in a physically meaningful range to avoid an excessive amount of simulations.
The optimization process started with an initial guess of the design variables within the design space. ABAQUS was called by the Python script to run the 2D leaflet-to-3D valve model simulation (Figs. 5 and 2). Then, the coordinates of all the nodes in the new 3D TAV model were used to update a second FE model in which the TAV closing simulation and “stent” deformation (for elliptical configurations only) would be performed. Once the simulation was completed successfully, the peak MPS obtained from the simulation result was used for the design optimization. Note that some of the FE simulations might encounter non-convergence issues, for which no simulation results could be obtained. Thus, only data from successfully completed simulations were used for post-processing data analysis. Due to limited computational resources, the maximum number of different TAV designs was set to be 500. A built-in optimization algorithm in Isight, Adaptive Simulated Annealing (a global search method [40]), was chosen for this study.
RESULTS
Remeshing of 2D Leaflet Geometry and Construction of 3D TAV Model
Illustrated in Fig.1(b) is a 2D leaflet geometry created with the following parameters: b = −0.0083 mm−3, h = 0.49 mm, and a = 5.09 mm. The width of the leaflet free edge is 22.2 mm, and the height of the leaflet is 14.1 mm. Remeshing of this geometry is shown in Fig. 1(c). All the nodes along the leaflet edges as well as two layers of internal nodes adjacent to the leaflet attachment edge and four layers of internal nodes adjacent to leaflet free edge were remeshed. The corresponding 3D TAV model with this 2D geometry is shown in Fig. 1(d) with mesh of the cylindrical tube (2/3 model shown).
Optimization of TAV in Circular Configuration
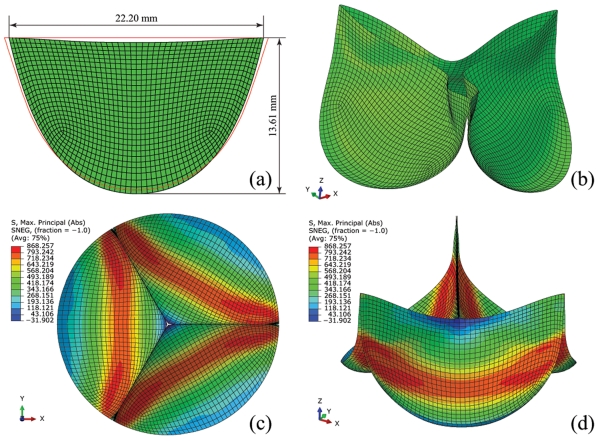
Within the design space of TAV leaflet designs listed in Table 2 for the circular configuration, 478 out of 500 optimization runs were successfully completed. Twenty-two simulations were not completed due to convergence issues, and were not included in the data analysis. The optimization results revealed a new optimized 2D leaflet geometry shown in Fig. 6(a). The height of this 2D leaflet design is 13.61 mm, and the width is 22.20 mm. The input values of the design parameters for this optimal leaflet design are listed in Table 2. The final 3D TAV model with this 2D design is shown in Fig. 6(b). A peak MPS of 868.26 kPa was obtained in this model under 120 mmHg (Figs. 6(c-d)). The high stress regions on the optimized TAV model were distributed in the leaflet belly region along the circumferential direction and extended to the areas near the centerline of the leaflet (Figs. 6(c-d)).
Table 2.
The results of TAV leaflet design in circular and elliptical configurations
| Parameters | a (mm) | h (mm) | b (mm−3) | Peak MPS (kPa) | |
|---|---|---|---|---|---|
| Circular configuration |
Design Space | 4.86 ~ 5.32 | −0.51 ~ 0.51 | −0.0217 ~ −0.0003 | 868.26 ~ 2769.76 |
| Optimal design | 5.12 | −0.41 | −0.0015 | 868.26 | |
| Elliptical configuration |
Design Space | 4.81 ~ 5.32 | 0.46 ~1.02 | −0.0339 ~ −0.0003 | 1712.45~2195.22 |
| Optimal design | 5.20 | 0.47 | −0.007 | 1712.45 | |
MPS: maximum principal stress.
Figure 6.
The parametric study result of TAV leaflet design in circular configuration: (a) optimized 2D (red lines denote the original design) and (b) the corresponding 3D leaflet models, (c) top view and (d) side view of maximum principal stress distribution on the deformed and fully loaded TAV model under 120 mmHg.
Optimization of TAV in Elliptical Configuration
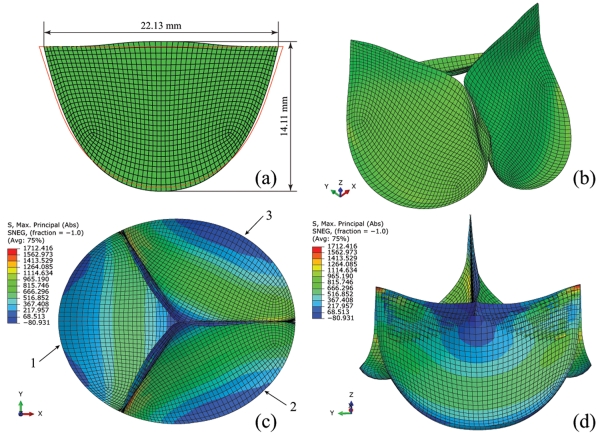
For TAVs deployed in the elliptical configuration (e = 0.5), the design space is listed in Table 2. 358 out of 500 optimization runs were successfully completed. The free edge of the leaflet design needs to be high enough, h > 0.4572 mm, to prevent central backflow leakage. A new optimized 2D leaflet geometry shown in Fig. 7(a) was obtained. The total height of this leaflet design is 14.11 mm, and the width is 22.13 mm. The values of input parameters of this design are listed in Table 2. The final 3D TAV model with this 2D design is shown in Fig. 7(b). The peak MPS on this TAV model under 120 mmHg was 1712.45 kPa as shown in Fig. 7(c-d).
Figure 7.
The parametric study result of TAV leaflet design in elliptical configuration: (a) optimized 2D (red lines denote the original design) and (b) the corresponding 3D leaflet models, (c) top view and (d) side view of maximum principal stress distribution on the deformed and fully loaded TAV model under 120 mmHg.
The stress distributions on this optimized TAV model are asymmetrical. The high stress regions were observed in the vicinity of the commissure on leaflet 1 and below commissural areas near leaflet-stent attachment edges on leaflets 2 and 3 (See Fig. 7(c) for leaflet numbering). The peak MPS values on leaflets 1, 2 and 3 were 1712.42 kPa, 1516.27 kPa and 1299.49, respectively. The peak MPS on leaflets 2 and 3 were located on the side near leaflet 1 due to the twisting of leaflets at the valve center.
Effect of Design Variables on TAV Peak Stress in Circular and Elliptical Configurations
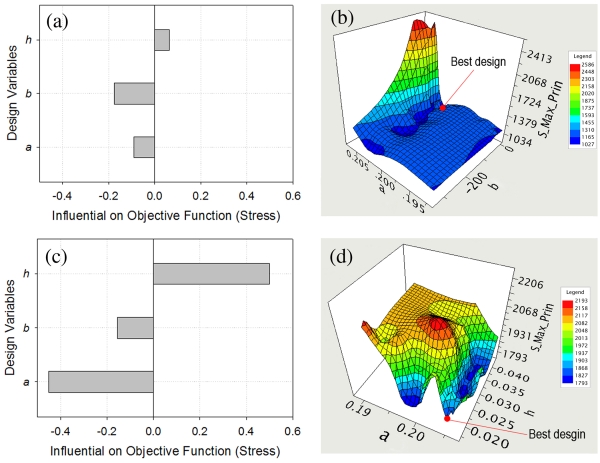
The impact of the design variables on the peak MPS of the TAV leaflets in the circular and elliptical configurations is shown in Fig. 8. For TAV in the circular configuration, increasing design variable b had the greatest overall impact on decreasing the peak MPS. For TAV in the elliptical configuration, the free edge height (h) had the greatest positive influence on the peak MPS. The surface fitting of peak TAV MPS with respect to the most influential design variables as shown in Fig. 8(b) and Fig. 8(d), revealed a complex response surface, which underscores the importance of performing numerical optimization of TAV designs to reduce leaflet peak stress.
Figure 8.
Effect of design variables on the objective function: influence (dimensionless) of design variables on TAV peak maximum principal stress in (a) circular and (c) elliptical configurations, surface fitting of TAV peak maximum principal stress with respect to the most influential design variables (inch) in (b) circular and (d) elliptical configurations.
DISCUSSION
FE analysis of heart valve has traditionally been conducted using deterministic FE simulation, in which specific valve geometry, material properties, loading and boundary conditions are given for a structural analysis of valve deformation. In this study, built upon the prior deterministic FE analyses of TAVs [18, 35], we developed novel mathematical equations to parameterize the TAV leaflet geometry; we incorporated variations of the geometry into the deterministic FE models of TAVs and performed computational parametric analyses to evaluate the impact of each leaflet geometric parameter on the TAV leaflet peak stress. This study is, to our knowledge, the first parametric study of TAV leaflet designs.
TAV in Circular Configuration
In this study, we started the optimization process with a 2D leaflet design that has a straight line at the free edge (see Curve 1 in Fig. 1(a)) and a scallop-shaped curve at the leaflet-stent attachment edge. This design is a typical 2D leaflet design that has been adopted in commercial BHVs. For example, the Edwards CEP valves, which have clinically proved long-term durability, use a straight line at the free edge. Thus, it is not surprising to see that the optimization process did not result in a substantial change of the leaflet shape (Fig. 6(a)), nor a dramatic reduction of the leaflet peak stress (Fig. 6(c)).
Within the chosen design space, we have obtained a range of leaflet peak MPS between 868 kPa and 2769 kPa under the nominal circular configuration. Comparing with the original straight line design of 916 kPa [18], a 5% reduction of the peak MPS was obtained with the new optimized leaflet shape of Fig. 6(a). This peak stress value of 868 kPa is considerably lower than the peak stresses reported in some recent TA studies [41] [42]. Auricchio et al. [41] reported a peak leaflet stress of 2.23 MPa in TAV within a patient-specific aortic root geometry, and Gunning et al. [42] reported a peak leaflet stress of 1.52 MPa in TAV in a patient-specific study of self-expanding TAV. In addition to the difference in material models used for the leaflets, i.e., the isotropic and linear elastic material model adopted in [41] and the isotropic material model in [42], specific leaflet geometry designs may be a significant factor contributing to the substantial difference in TAV leaflet peak stress. The stress distribution of the new optimized geometry was also different from that of the original design. As shown in Fig. 6(c-d), the high stress regions were observed in the leaflet belly region along the circumferential direction. With the original design, the high stress region was located on the two sides of the leaflet belly region near the leaflet attachment edge.
TAV in Elliptical Configuration
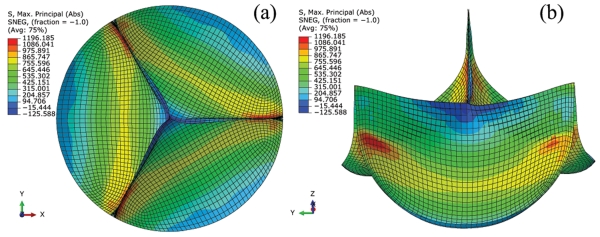
In order to eliminate the valve central leakage, the height of the free edge could be increased so that the central leakage region can be covered by the extended leaflets. According to the parametric study, a minimal value of 0.4572 mm for the free edge height (h) should be adopted to prevent the central backflow leakage for the elliptical configuration (e = 0.5). This increase of the free edge height resulted in an increase of the leaflet peak MPS at both circular and elliptical configurations. As shown in Fig. 9, the new optimized leaflet design (Fig. 7(a)) accounting for the elliptical deployment would have a peak MPS of 1196.19 kPa if it is deployed in a circular configuration, a 38% increase compared to the optimal design (Fig. 6(a)). In addition, as shown in Fig. 9, a slight leaflet wrinkling or “pin-wheeling” was observed with this high free edge design. This leaflet wrinkling was identified as a potential cause of early failure of the first-generation surgical pericardial valves [43]. Also, leaflet wrinkling could cause difficulty in the tracking of contact between the master and slave surfaces which may lead to non-converging results.
Figure 9.
Maximum principal stress distribution on the deformed and fully loaded TAV model in circular configuration with optimal 2D leaflet geometry from the computational analysis of TAV in the elliptical configuration: (a) top view and (b) side view.
Because elliptical TAVs will increase the leaflet stress [35] and the transvalvular pressure gradient [44], for a TAV design, efforts to preserve the circularity of the TAV deployment shape should be encouraged. A balloon-expanded TAV with a stainless steel or cobalt chromium stent may be more likely to preserve the TAV circularity than that of a self-expandable Nitinol stent, and thus have a better leaflet durability. This hypothesis remains to be confirmed by clinical studies of TAV implantation.
Limitations of the Study
We assumed that the cross section of the TAV deployed in a non-circular configuration was a perfect elliptical shape. The TAV deployed in a calcified aortic valve could be of other non-circular shapes such as a triangular shape [45], and the side profile could be conic or biconic in shape [46]. Such TAV deployed configurations were not investigated in this study. Since all our initial 3D TAV geometries were generated from 2D leaflet designs automatically by one Python script and this is a side-by-side comparison study, we assumed that the small residual stress introduced during this model construction process should be comparable among all simulations, and our comparative results should still be valid without considering this small residual stress in the valve closing simulations. A future study incorporating this residual stress into the TAV models may provide improved results. In addition, due to numerical convergence issues and complex leaflet contacts, some of the TAV closing simulations failed to converge. It is difficult to identify the causes of non-convergence issues due to the nonlinear, large deformation simulations with complex leaflet contacts that we performed in this study. These failed simulations might contain a better design compared to the optimal one obtained in this study. Finally, we have limited our optimization runs to 500 due to the computational resources.
Conclusions
In this study, a computational framework was developed to investigate the impact of leaflet geometrical parameters on valve peak stresses in both circular and elliptical configurations. The optimization analysis of circular TAV deployment resulted in an optimal leaflet design that could reduce the peak stress on the TAV leaflets by about 5% compared with the original leaflet design. Among all leaflet design variables, increasing the free edge width had the greatest overall impact on decreasing the peak MPS in circular configuration. For a TAV deployed in the elliptical configuration, a minimal value of 0.4572 mm for the free edge height should be adopted to prevent central backflow leakage. This increase of the free edge height resulted in an increase of the leaflet peak MPS, at both the elliptical and nominal circular configurations. For the elliptical configuration, among all leaflet design variables, the free edge height has the greatest positive influence on the peak MPS. Furthermore, the parametric analysis revealed a complicated response surface for the impact of the leaflet variables on the TAV leaflet peak MPS, underscoring the need for performing numerical optimization processes to obtain the optimal TAV leaflet design. The current approach was developed specifically for TAV devices. However, it could be readily extended to study other bioprosthetic heart valve devices.
ACKNOWLEDGMENTS
This research was supported in part by the NIH grants HL104080 and HL108240.
Footnotes
CONFLICTS OF INTEREST
None.
REFERENCES
- 1.Cribier A, et al. Percutaneous transcatheter implantation of an aortic valve prosthesis for calcific aortic stenosis: first human case description. Circulation. 2002;106(24):3006–3008. doi: 10.1161/01.cir.0000047200.36165.b8. [DOI] [PubMed] [Google Scholar]
- 2.Zhao Z-G, et al. Transcatheter aortic valve implantation in bicuspid anatomy. Nat Rev Cardiol. 2015;12(2):123–128. doi: 10.1038/nrcardio.2014.161. [DOI] [PubMed] [Google Scholar]
- 3.Blanke P, Schoepf UJ, Leipsic JA. CT in transcatheter aortic valve replacement. Radiology. 2013;269(3):650–69. doi: 10.1148/radiol.13120696. [DOI] [PubMed] [Google Scholar]
- 4.Webb J, et al. Percutaneous transarterial aortic valve replacement in selected high-risk patients with aortic stenosis. Circulation. 2007;116(7):755–763. doi: 10.1161/CIRCULATIONAHA.107.698258. [DOI] [PubMed] [Google Scholar]
- 5.Rodés-Cabau J, et al. Transcatheter Aortic Valve Implantation for the Treatment of Severe Symptomatic Aortic Stenosis in Patients at Very High or Prohibitive Surgical Risk: Acute and Late Outcomes of the Multicenter Canadian Experience. Journal of the American College of Cardiology. 2010;55(11):1080–1090. doi: 10.1016/j.jacc.2009.12.014. [DOI] [PubMed] [Google Scholar]
- 6.Leon MB, et al. Transcatheter aortic-valve implantation for aortic stenosis in patients who cannot undergo surgery. New England Journal of Medicine. 2010;363(17):1597–1607. doi: 10.1056/NEJMoa1008232. [DOI] [PubMed] [Google Scholar]
- 7.Smith CR, et al. Transcatheter versus surgical aortic-valve replacement in high-risk patients. New England Journal of Medicine. 2011;364(23):2187–2198. doi: 10.1056/NEJMoa1103510. [DOI] [PubMed] [Google Scholar]
- 8.Masson JB, et al. Transcatheter Aortic Valve Implantation. Review of the Nature, Management, and Avoidance of Procedural Complications. JACC: Cardiovascular Interventions. 2009;2(9):811–820. doi: 10.1016/j.jcin.2009.07.005. [DOI] [PubMed] [Google Scholar]
- 9.Moat NE, et al. Long-Term Outcomes After Transcatheter Aortic Valve Implantation in High-Risk Patients With Severe Aortic StenosisThe U.K. TAVI (United Kingdom Transcatheter Aortic Valve Implantation) Registry. Journal of the American College of Cardiology. 2011;58(20):2130–2138. doi: 10.1016/j.jacc.2011.08.050. [DOI] [PubMed] [Google Scholar]
- 10.Eltchaninoff H, et al. Transcatheter aortic valve implantation: early results of the FRANCE (FRench Aortic National CoreValve and Edwards) registry. European Heart Journal. 2011;32(2):191–197. doi: 10.1093/eurheartj/ehq261. [DOI] [PubMed] [Google Scholar]
- 11.Grube E, et al. Percutaneous Aortic Valve Replacement for Severe Aortic Stenosis in High-Risk Patients Using the Second- and Current Third-Generation Self-Expanding CoreValve Prosthesis. Device Success and 30-Day Clinical Outcome. Journal of the American College of Cardiology. 2007;50(1):69–76. doi: 10.1016/j.jacc.2007.04.047. [DOI] [PubMed] [Google Scholar]
- 12.Adams DH, et al. Transcatheter Aortic-Valve Replacement with a Self-Expanding Prosthesis. New England Journal of Medicine. 2014;370(19):1790–1798. doi: 10.1056/NEJMoa1400590. [DOI] [PubMed] [Google Scholar]
- 13.Kodali SK, et al. Two-year outcomes after transcatheter or surgical aortic-valve replacement. New England Journal of Medicine. 2012;366(18):1686–1695. doi: 10.1056/NEJMoa1200384. [DOI] [PubMed] [Google Scholar]
- 14.Muneretto C, et al. A comparison of conventional surgery, transcatheter aortic valve replacement, and sutureless valves in “real-world” patients with aortic stenosis and intermediate- to high-risk profile. The Journal of Thoracic and Cardiovascular Surgery. doi: 10.1016/j.jtcvs.2015.08.052. [DOI] [PubMed] [Google Scholar]
- 15.Codner P, et al. Long-Term Outcomes for Patients With Severe Symptomatic Aortic Stenosis Treated With Transcatheter Aortic Valve Implantation. American Journal of Cardiology. 2015;116(9):1391–1398. doi: 10.1016/j.amjcard.2015.08.004. [DOI] [PubMed] [Google Scholar]
- 16.Rodés-Cabau J. Transcatheter aortic valve implantation: Current and future approaches. Nature Reviews Cardiology. 2012;9(1):15–29. doi: 10.1038/nrcardio.2011.164. [DOI] [PubMed] [Google Scholar]
- 17.Détaint D, et al. Determinants of Significant Paravalvular Regurgitation After Transcatheter Aortic Valve Implantation: Impact of Device and Annulus Discongruence. JACC: Cardiovascular Interventions. 2009;2(9):821–827. doi: 10.1016/j.jcin.2009.07.003. [DOI] [PubMed] [Google Scholar]
- 18.Li K, Sun W. Simulated thin pericardial bioprosthetic valve leaflet deformation under static pressure-only loading conditions: Implications for percutaneous valves. Annals of Biomedical Engineering. 2010;38(8):2690–2701. doi: 10.1007/s10439-010-0009-3. [DOI] [PubMed] [Google Scholar]
- 19.Zajarias A, Cribier AG. Outcomes and Safety of Percutaneous Aortic Valve Replacement. Journal of the American College of Cardiology. 2009;53(20):1829–1836. doi: 10.1016/j.jacc.2008.11.059. [DOI] [PubMed] [Google Scholar]
- 20.Movahed MR. Where are we going with percutaneous aortic valve replacement? Expert Rev Cardiovasc Ther. 2007;5(6):997–8. doi: 10.1586/14779072.5.6.997. [DOI] [PubMed] [Google Scholar]
- 21.Martin C, Sun W. Comparison of transcatheter aortic valve and surgical bioprosthetic valve durability: A fatigue simulation study. Journal of Biomechanics. 2015;48(12):3026–3034. doi: 10.1016/j.jbiomech.2015.07.031. [DOI] [PMC free article] [PubMed] [Google Scholar]
- 22.Gonzalez-Lavin L, et al. The pericardial valve in the aortic position ten years later. Journal of Thoracic and Cardiovascular Surgery. 1991;101(1):75–80. [PubMed] [Google Scholar]
- 23.Reul GJ, Jr, Cooley DA, Duncan JM. Valve failure with the Ionescu-Shiley bovine pericardial bioprosthesis: Analysis of 2680 patients. Journal of Vascular Surgery. 1985;2(1):192–204. [PubMed] [Google Scholar]
- 24.Walley VM, et al. Ionescu-Shiley valve failure I: Experience with 125 standard-profile explants. Annals of Thoracic Surgery. 1992;54(1):111–116. doi: 10.1016/0003-4975(92)91153-z. [DOI] [PubMed] [Google Scholar]
- 25.Walley VM, et al. Patterns of failure in Hancock pericardial bioprostheses. Journal of Thoracic and Cardiovascular Surgery. 1991;102(2):187–194. [PubMed] [Google Scholar]
- 26.Wheatly DJ, Fisher J, Reece IJ. Primary tissue failure in pericardial heart valves. Journal of Thoracic and Cardiovascular Surgery. 1987;94(3):367–374. [PubMed] [Google Scholar]
- 27.Bortolotti U, et al. Failure of Hancock pericardial xenografts: Is prophylactic bioprosthetic replacement justified? Annals of Thoracic Surgery. 1991;51(3):430–437. doi: 10.1016/0003-4975(91)90859-o. [DOI] [PubMed] [Google Scholar]
- 28.Thiene G, et al. Mode of failure of the Hancock pericardial valve xenograft. American Journal of Cardiology. 1989;63(1):129–133. doi: 10.1016/0002-9149(89)91099-0. [DOI] [PubMed] [Google Scholar]
- 29.Schoen FJ, et al. Causes of failure and pathologic findings in surgically removed Ionescu-Shiley standard bovine pericardial heart valve bioprostheses: emphasis on progressive structural deterioration. Circulation. 1987;76(3):618–27. doi: 10.1161/01.cir.76.3.618. [DOI] [PubMed] [Google Scholar]
- 30.Hilbert SL, Ferrans VJ, Swanson WM. Optical methods for the nondestructive evaluation of collagen morphology in bioprosthetic heart valves. Journal of Biomedical Materials Research. 1986;20:1411–1421. doi: 10.1002/jbm.820200914. [DOI] [PubMed] [Google Scholar]
- 31.Love JW, Willems PW, Love CS. New Horizons and the future of heart valve prostheses. In: Gabbay S, R.W. F, editors. Silent Partners; Austin: 1994. [Google Scholar]
- 32.Sacks MS, Schoen FJ. Collagen fiber disruption occurs independent of calcification in clinically explanted bioprosthetic heart valves. J Biomed Mater Res. 2002;62(3):359–71. doi: 10.1002/jbm.10293. [DOI] [PubMed] [Google Scholar]
- 33.Christie GW. Computer modelling of bioprosthetic heart valves. European Journal of Cardio-thoracic Surgery. 1992;6(Supplement 1):S95–S101. [PubMed] [Google Scholar]
- 34.Sun W, Abad A, Sacks MS. Simulated bioprosthetic heart valve deformation under quasi-static loading. J Biomech Eng. 2005;127(6):905–14. doi: 10.1115/1.2049337. [DOI] [PubMed] [Google Scholar]
- 35.Sun W, Li K, Sirois E. Simulated elliptical bioprosthetic valve deformation: Implications for asymmetric transcatheter valve deployment. Journal of Biomechanics. 2010;43(16):3085–3090. doi: 10.1016/j.jbiomech.2010.08.010. [DOI] [PubMed] [Google Scholar]
- 36.Morganti S, et al. Simulation of transcatheter aortic valve implantation through patient-specific finite element analysis: Two clinical cases. Journal of Biomechanics. 2014;47(11):2547–2555. doi: 10.1016/j.jbiomech.2014.06.007. [DOI] [PubMed] [Google Scholar]
- 37.Fung YC. Biomechanics: Mechanical Properties of Living Tissues. 2nd ed. Springer Verlag; New York: 1993. p. 568. [Google Scholar]
- 38.Sun W, Sacks MS. Finite element implementation of a generalized Fung-elastic constitutive model for planar soft tissues. Biomechanics and Modeling in Mechanobiology. 2005;4(2-3):190–199. doi: 10.1007/s10237-005-0075-x. [DOI] [PubMed] [Google Scholar]
- 39.SIMULIA . Abaqus Analysis User’s Manual. Providence, RI: 2012. [Google Scholar]
- 40.Halloran J, Erdemir A. Adaptive Surrogate Modeling for Expedited Estimation of Nonlinear Tissue Properties Through Inverse Finite Element Analysis. Annals of Biomedical Engineering. 2011;39(9):2388–2397. doi: 10.1007/s10439-011-0317-2. [DOI] [PMC free article] [PubMed] [Google Scholar]
- 41.Auricchio F, et al. Simulation of transcatheter aortic valve implantation: a patient-specific finite element approach. Computer Methods in Biomechanics and Biomedical Engineering. 2013:1–11. doi: 10.1080/10255842.2012.746676. [DOI] [PubMed] [Google Scholar]
- 42.Gunning P, Vaughan T, McNamara L. Simulation of Self Expanding Transcatheter Aortic Valve in a Realistic Aortic Root: Implications of Deployment Geometry on Leaflet Deformation. Annals of Biomedical Engineering. 2014;42(9):1989–2001. doi: 10.1007/s10439-014-1051-3. [DOI] [PubMed] [Google Scholar]
- 43.Vesely I. Transcatheter valves: a brave New World. The Journal of heart valve disease. 2010;19(5):543–558. [PubMed] [Google Scholar]
- 44.Sirois E, et al. Hemodynamic Impact of Transcatheter Aortic Valve Deployment Configuration. Journal of Medical Devices. 2013;7(4):040922. doi: 10.1115/1.4025938. [DOI] [PMC free article] [PubMed] [Google Scholar]
- 45.Zegdi R, et al. Increased Radial Force Improves Stent Deployment in Tricuspid but Not in Bicuspid Stenotic Native Aortic Valves. Annals of Thoracic Surgery. 2010;89(3):768–772. doi: 10.1016/j.athoracsur.2009.12.022. [DOI] [PubMed] [Google Scholar]
- 46.Zegdi R, et al. Deployed Edwards Sapien prosthesis is always deformed. The Journal of Thoracic and Cardiovascular Surgery. 2010;140(3):e54–e56. doi: 10.1016/j.jtcvs.2010.03.003. [DOI] [PubMed] [Google Scholar]


